
 Open Access Article
 This Open Access Article is licensed under a
 Creative Commons Attribution 3.0 Unported Licence
Synthesis of rhombohedral Hf0.5Zr0.5O2 and analysis by X-ray diffraction through dynamical diffraction simulations†
Kit
de Hond
 ,
Guus
Rijnders
and
Gertjan
Koster
*
,
Guus
Rijnders
and
Gertjan
Koster
*
MESA+ Institute for Nanotechnology, University of Twente, P.O. Box 217, 7500 AE Enschede, The Netherlands. E-mail: g.koster@utwente.nl
First published on 14th August 2024
Abstract
The persistence of ferroelectricity down to nanometer scales in hafnia-based materials makes these compounds promising candidates for future electronic applications. Moreover, theoretical calculations show the existence of several meta-stable phases of hafnia, which means that epitaxial strain engineering might be capable of stabilizing some of these meta-stable phases. In this work, Hf0.5Zr0.5O2 (HZO) was deposited on an epitaxial layer of La0.7Sr0.3MnO3 (LSMO), which was grown on a (100)-oriented SrTiO3 (STO) single crystal substrate. High-resolution X-ray diffraction measurements, combined with dynamical X-ray diffraction simulations of the multilayer, give new insights into the delicate interplay between interfacial layers and the strain state of the LSMO and HZO layers. This sheds new light on the way we can model these kinds of multilayers and potentially investigate strain relaxation through XRD simulations.
Over the last decade, the interest in hafnia-based ferroelectrics has increased dramatically. A major advantage of hafnia is that its ferroelectricity persists down to small length scales, making it more interesting for further miniaturizing electronic components. The fact that hafnia's ferroelectricity remains down to nm scales is contrary to what is observed in most other ferroelectric materials, such as, for instance, lead zirconate titanate (PZT). In most conventional ferroelectric materials, the ferroelectricity tends to vanish in ultrathin films due to depolarization fields.1,2 The need for miniaturization and more energy-efficient materials makes hafnia-based materials promising candidates for future applications. Another advantage of hafnia that is often overlooked is the fact that its toxic effects on humans and the environment are virtually nonexistent. Especially compared to the most widely used lead-containing ferroelectrics, hafnia can be regarded as a much safer material.
Different phases of hafnia-based compounds
Various pseudo-stable phases of hafnia have been known for years. Apart from the parent high-symmetry cubic Fm![[3 with combining macron]](https://www.rsc.org/images/entities/char_0033_0304.gif) m phase, other phases include tetragonal (t-phase, P42/nmc), orthorhombic (o-phase, Pbca, Pnma, Pca21 and Pmn21) and monoclinic (m-phase, P21/m, P21/c, Pm and Cc) variations. In ambient conditions, the ground state phase is the centro-symmetric, monoclinic P21/c phase. Because of the underlying symmetry, this phase does not show any ferroelectricity. However, first-principle calculations have shown that the free energy differences between some of these hafnia phases are only on the order of few tens of meV per atom and that they are pressure-dependent.3 For the polar, orthorhombic Pca21 and Pmn21 phases the difference in free energy per atom is < kBT/5 in ambient conditions, and it has indeed been shown that the Pca21 phase can be stabilized in a lab environment.
m phase, other phases include tetragonal (t-phase, P42/nmc), orthorhombic (o-phase, Pbca, Pnma, Pca21 and Pmn21) and monoclinic (m-phase, P21/m, P21/c, Pm and Cc) variations. In ambient conditions, the ground state phase is the centro-symmetric, monoclinic P21/c phase. Because of the underlying symmetry, this phase does not show any ferroelectricity. However, first-principle calculations have shown that the free energy differences between some of these hafnia phases are only on the order of few tens of meV per atom and that they are pressure-dependent.3 For the polar, orthorhombic Pca21 and Pmn21 phases the difference in free energy per atom is < kBT/5 in ambient conditions, and it has indeed been shown that the Pca21 phase can be stabilized in a lab environment.
Stabilization of meta-stable hafnia phases is usually accomplished by applying strain or doping.4–7 In literature, the mostly investigated phase is the ferroelectric Pca21 orthorhombic phase, because it was the only known meta-stable ferroelectric hafnia phase for some time.6 Because of the meta-stable character of this phase, a lot of effort has been put into investigating different dopants and strain conditions and other pathways to stabilize it. Several first-principles studies into the effect dopants have on this hafnia phase showed that a wide variety of dopants could be used to stabilize the Pca21 phase.7 According to these studies, the most suitable dopants are atoms with relatively high ionic radii, such as La, Y, and Sr. Although it should be noted that, even in optimal doping conditions, these dopants lead to a maximum remanent polarization of approximately 15 μC cm−2 and they still cannot stabilize the polar Pca21 phase completely. Other factors, such as electric field, strain or surface energy is still needed to achieve stabilization. Apart from the orthorhombic Pca1 phase, another ferroelectric phase in hafnia was recently discovered: A rhombohedral (r-phase) in Hf0.5Zr0.5O2 (HZO) was claimed to be found by Wei et al.8 A further investigation into this rhombohedral phase suggests that it is strain-stabilized: Growing on top of relatively small substrates, such as YAlO3 (a = 3.72 Å), results in a non-ferroelectric, mixed t-phase/m-phase HZO film. As the lattice parameter of the substrate gets bigger, more and more r-phase appears. At a > 3.88 Å the growth of HZO is completely surface energy mediated and therefore phase-pure rhombohedral HZO grows. Furthermore, when the LSMO bottom electrode in these samples is compressively strained on the substrate, a mix of m- and t-phases appears, whereas tensile strained LSMO results in purely rhombohedral HZO.9 It should be noted that whether or not this HZO is truly rhombohedral is an ongoing debate. Alternatively, it could be that the HZO simply undergoes a structural distortion caused by epitaxial stress, which is more often seen in heteroepitaxial systems.10 In this manuscript we will refer to the HZO as being rhombohedral, but the reader should keep in mind that the HZO may not have a true rhombohedral phase. The r-phase HZO stays ferroelectric down to the ultrathin limit (film thickness of < 10 nm). The largest remanent polarization in these films (Pr = 34 μC cm−2) was reported for 5 nm thick HZO films.8 Compared to other ferroelectric materials, such as PZT, remanent polarization in these HZO films is relatively small, but the persistence of ferroelectricity down to nanometer thick films makes it a potentially interesting material for a wide range of applications.
Ferroelectricity in hafnia-based materials
The persistence of ferroelectricity down to nanometer scales defies our current understanding of ferroelectricity. In conventional ferroelectrics, a depolarization field arises to counter the electric field from the spontaneous polarization. This field is usually weakened by internal charge carriers in the ferroelectric, domain formation and free charge carriers in metallic electrodes, if they are present. As a ferroelectric film gets thinner, more and more of these dipoles lie at its surface and the depolarization field starts dominating more. This leads to a suppression of the spontaneous polarization until, below a certain critical thickness, the ferroelectricity vanishes all together.11 However, somehow the ferroelectricity in these hafnia-based compounds persists, suggesting there is another mechanism at play here compared to conventional ferroelectrics. There is some evidence that flat phonon bands in hafnia give rise to unipolar 2D domains forming, separated by non-polar 2D slices. This specific configuration comes with a relatively small depolarization field and is therefore also stable at small length scales.12 There has also been some research conducted into what drives the switching in these compounds, which suggests oxygen vacancies play an important role. Nukala et al.13 showed that oxygen migration seems to drive polarization switching in hafnia-based compounds, by utilizing in operando STEM measurements in both high-angle annular dark field (HAADF) and integrated differential phase contrast (iDPC) modes. iDPC made imaging of light elements possible, such as hydrogen and oxygen, allowing for direct imaging of the oxygen ions in hafnia, as well as oxygen vacancies (VO). By monitoring the hafnia while applying a bias voltage, it was shown that VO migration plays a key role in the switching of hafnia. Moreover, they showed that the formation of oxygen vacancies in tensile strained LSMO creates a conducting, oxygen deficient interface layer between the LSMO and HZO. Moreover, it is well-known from previous research that tensile strain can lead to the formation of oxygen vacancies.14 This means that the formation of this interface layer allows for effective screening, and therefore stabilization of the polar r-phase in the HZO at these small length scales. Ultimately, the presence and migration of VO also hint at a possible stabilization mechanism of the rhombohedral phase.Here, we present a careful study of the growth of thin rhombohedral HZO films on LSMO electrodes and an investigation of its structure by XRD measurements (using both symmetrical scans as well as phi-scans). Subsequently, we use dynamical X-ray diffraction simulations to study the interfaces and the strain state within the layers and shed more light on the stabilization of rhombohedral HZO.
HZO on single crystal STO
Firstly, several samples on single crystal (100) STO substrates were made to achieve high quality HZO films. An La0.7Sr0.3MnO3 (LSMO) bottom electrode with a thickness of 20 nm was used in these samples. The layer thickness for the HZO was aimed to be approximately 10 nm. All layers were deposited by pulsed laser deposition (PLD) using stoichiometric targets and the growth was monitored by in-situ reflection high-energy electron diffraction (RHEED). The PLD system was equipped with a KrF excimer laser with a wavelength of 248 nm to ablate the targets. A fluence of 1.9 J cm−2 was used at a frequency of 2 Hz. The growth was done in a pure oxygen atmosphere. For the growth of the bottom electrode, an LSMO target with a composition of La0.67Sr0.33MnO3 was used. The growth conditions of the LSMO bottom electrode were set the same as the conditions for the HZO layer on top. For the three samples that are discussed in this work, slightly different growth temperatures and background pressures were chosen to investigate what conditions would give the best quality films. The intensity of the specular RHEED spot was tracked during the growth to allow for thickness calibration and to get more insight into the growth mode. For the three LSMO layers, the RHEED intensity is shown in Fig. 1(a) as a function of time together with the growth temperature and oxygen pressure.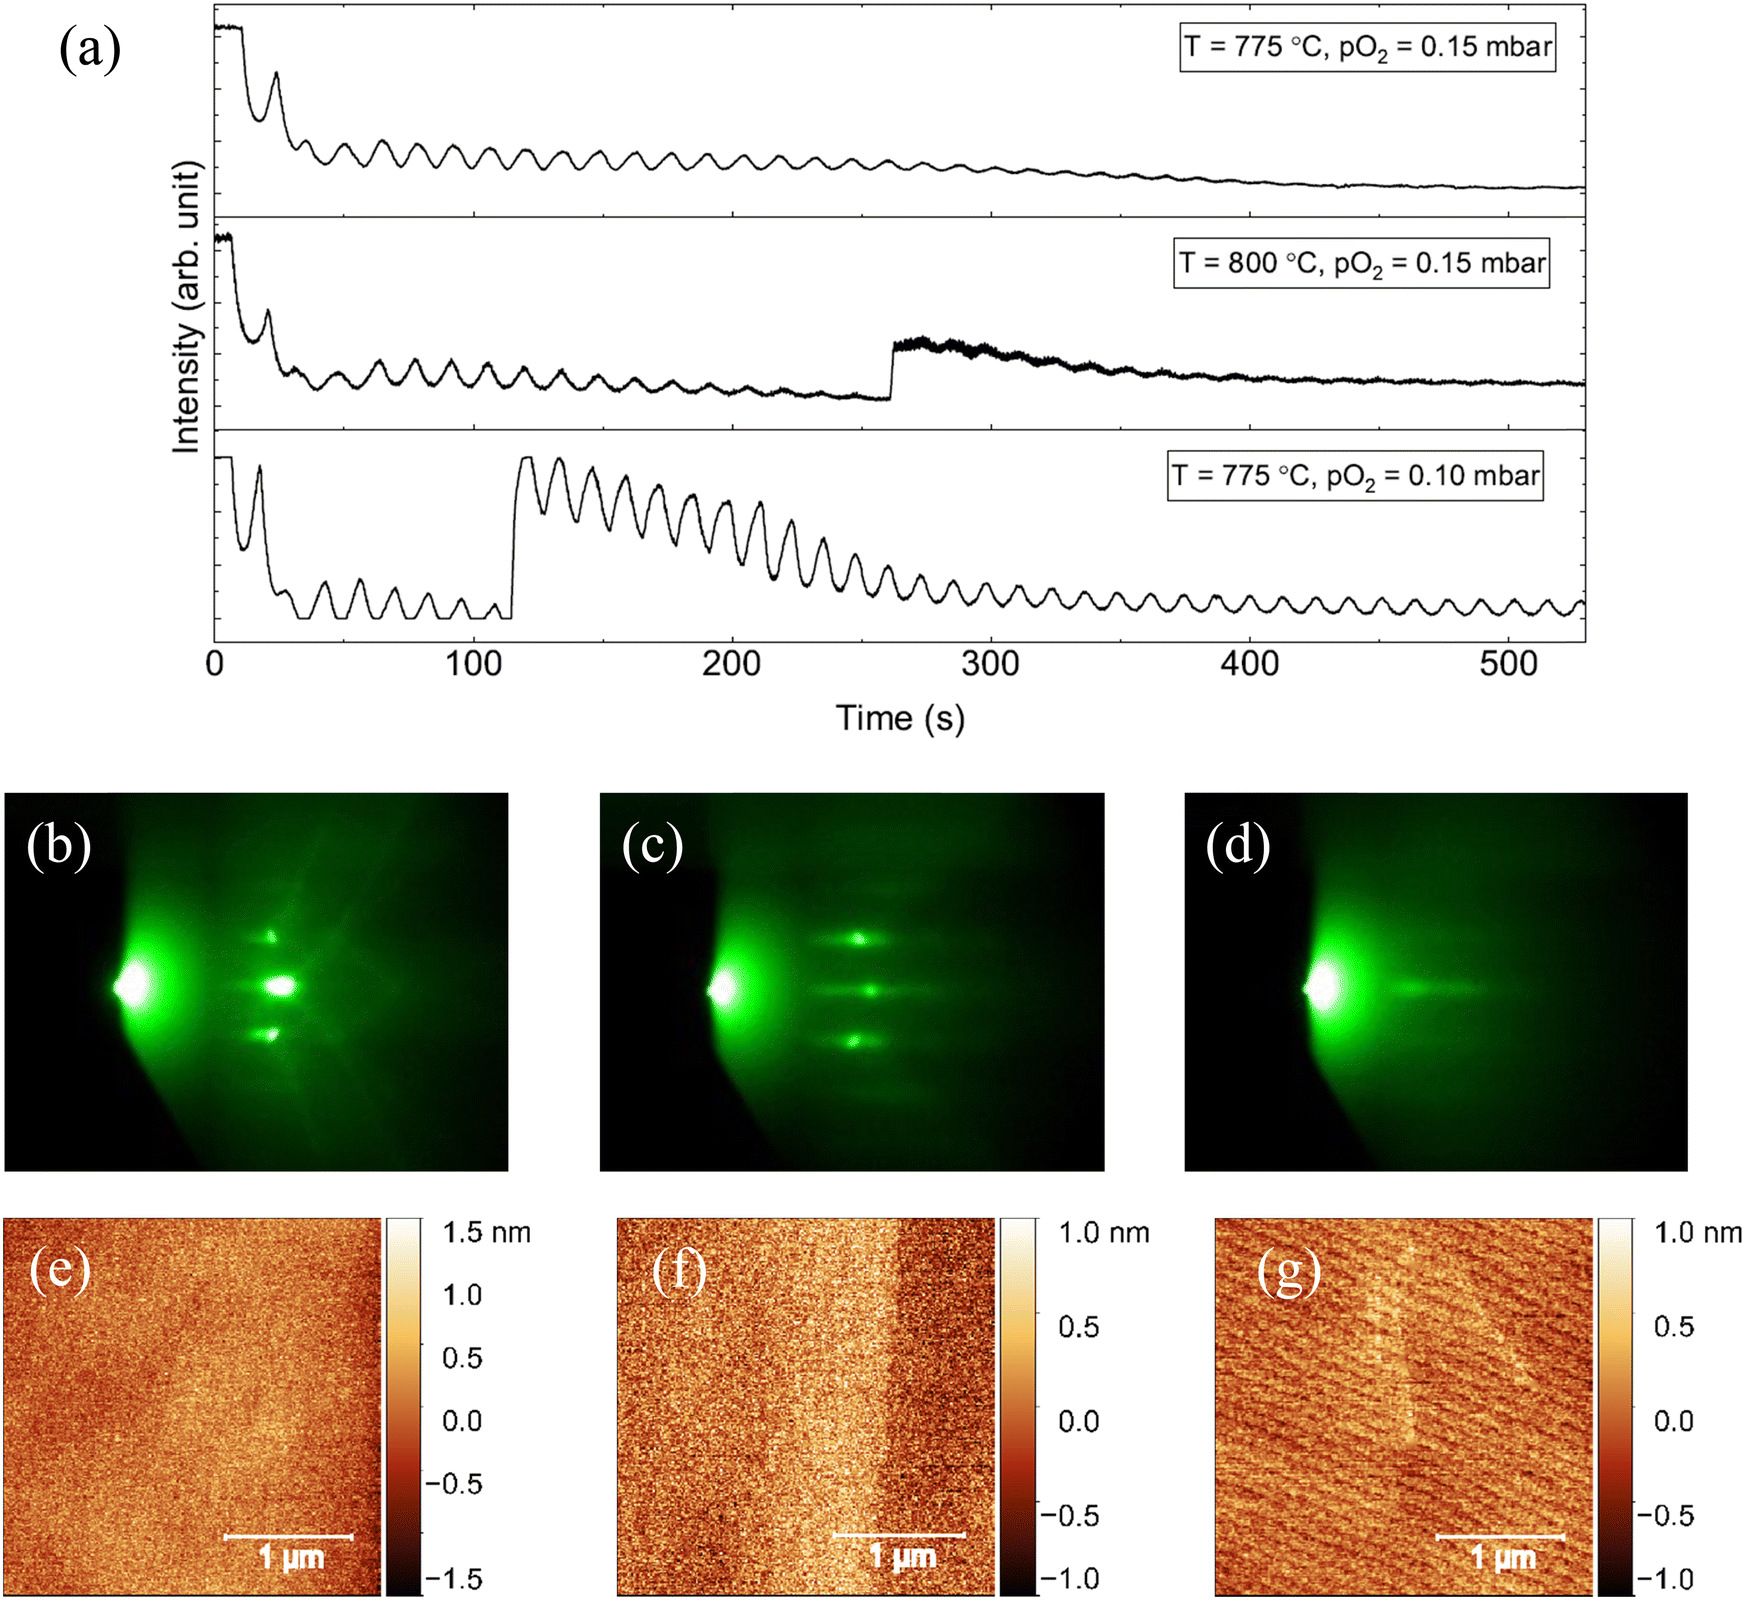 | ||
| Fig. 1 RHEED traces of the LSMO growth at different conditions are shown in panel (a). The jump in the traces of samples 2 and 3 at around 260 s and 115 s, respectively, is caused by a manual increase of the RHEED current. The oscillations are an indication of a 2D layer-by-layer growth mode. The oscillations are used in order to accurately estimate the growth rate of the LSMO. Evolution of the RHEED pattern during deposition is shown in panels (b)–(d), with the RHEED pattern of the bare STO substrate in (b), the RHEED pattern after depositing 20 nm of LSMO in (c) and after deposition of 10 nm of HZO in (d). The surfaces of the samples (corresponding to the traces from panel (a) from top to bottom) are shown in the AFM micrographs in panels (e)–(g), respectively. All samples show very smooth surfaces where the vicinal steps of the underlying STO substrate are still visible. | ||
Although all traces show oscillations, there are some distinctive differences between the samples visible. Samples 1 and 2 initially show oscillations that dampen out later on, until no oscillations are visible anymore. The main difference between these traces is that the trace of sample 2 shows a more prominent recovery of the intensity after every pulse. The origin for this is probably the slightly higher growth temperature that provides the incoming adatoms with more kinetic energy, allowing them to find a more favorable nucleation site. This results in the growth showing more characteristics of a step-flow mode, although it should be noted that no clear increase in the RHEED signal was observed after the deposition was interrupted. Sample 3 shows oscillations that continue until the end of the deposition. Although the intensity of the oscillations decreases slightly for the first twenty oscillations, a steady layer-by-layer growth state is reached eventually. For all samples, the RHEED patterns themselves look similar during growth. The evolution of the RHEED pattern is shown in Fig. 1(b)–(d).
Considering the pattern after depositing LSMO in Fig. 1(c), it is clear that the LSMO layer indeed grows in a 2D mode with small roughness. A streaky pattern emerges, as is common for 2D, heteroepitaxial cube-on-cube growth. As soon as the HZO deposition starts, the pattern fades out until only a few streaks remain visible in Fig. 1(d). The streaks are evidence of a flat surface. However, the decrease in intensity and definition of the streaks means there are likely multiple domains forming with sizes that are smaller than the coherence length of the electron beam. This results in a widening of the rods in reciprocal space. Impurities and other defects probably result in the pattern becoming less well-defined. However, no 3D spots are visible, which is an indication of a flat surface topology. The surface of the samples was checked by AFM (see Fig. 1(e)–(g)). RMS roughness for all samples is below 0.5 nm and the vicinal steps of the underlying STO substrate are still visible, which means the roughness is relatively small. This matches with the RHEED patterns.
HR-XRD measurements
High Resolution XRD measurements were carried out in order to get more information about the crystal structure of the thin films. All XRD measurements were performed on a Bruker D8 system with a rotating anode for extra brilliance. The results are shown in Fig. 2. X-ray reflectivity (XRR) scans are shown in Fig. 2(a). Simulation of these measurements results in very comparable thicknesses for the layers between the samples. The LSMO layer is approximately 20 nm and the HZO is 10 nm. The LSMO (001) peak in Fig. 2(b) peak looks similar for all samples.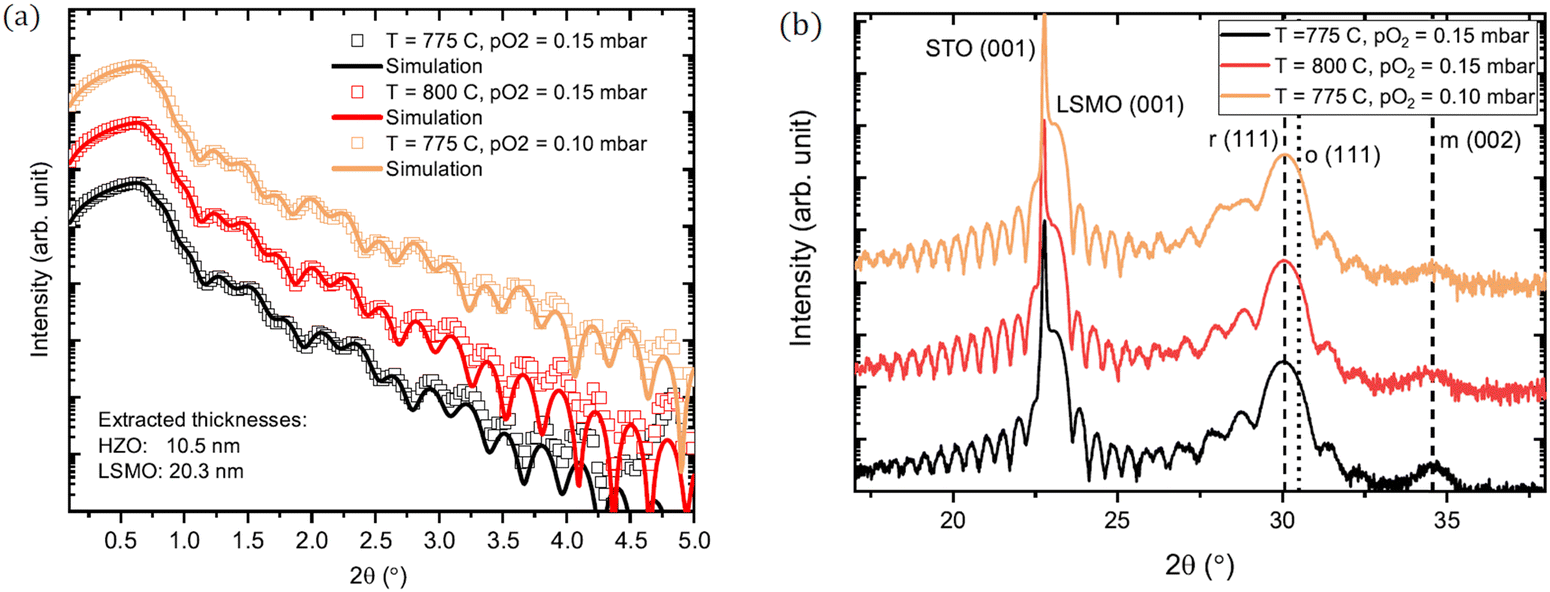 | ||
| Fig. 2 (a) shows XRR measurements of the films with the extracted thicknesses. The squares are the measured data points, and the lines represent simulated fittings. (b) shows 2θ–ω scans of the films at different growth conditions. The main peaks are indicated by their Miller indices. For HZO, the theoretically expected positions of the rhombohedral (111) and the orthorhombic (111) peaks are indicated by the dashed and dotted lines, respectively.15 The monoclinic (002) peak is indicated by a dashed line. | ||
Its position of 23.03° corresponds to an out-of-plane lattice constant of 3.85 Å, which fits with tensile-strained LSMO. Laue oscillations on both sides of the LSMO peak indicate good crystallinity of the layer. The equidistant spacing of the oscillations indicates similar thickness and quality of the LSMO layers for all samples. The HZO (111) peak appears around 30°. Its broad appearance can be related to the relatively small thickness of the HZO layer (10 nm). The dashed line that is annotated with r (111) shows the expected 2θ-angle of the rhombohedral phase. The dotted line that is indicated with o (111) indicates the expected position of orthorhombic Pca21 HZO. Laue oscillations are also present on both sides of the HZO peak. Moreover, the Laue oscillations around the peak show an asymmetry, which can be explained by multiple phenomena. Firstly, the strain that is induced within the HZO film. The strain-driven shift of ions within the crystal lattice effectively breaks the symmetry of the diffraction pattern. This results in an asymmetry around all non-zero order diffraction peaks.16 Furthermore, it is expected that relatively large strain fields are present within the HZO film, since its presumed phase is strain-stabilized. From literature it is known that the interfacial layer of the HZO film can show values up to 8% tensile strain.8 Another mechanism that might play a role here is the change in phase relationship between the Kiessig fringes and the Laue oscillations.17 This asymmetry is usually more prominent at lower 2θ angles and only shows up when the interfaces between the different layers are smooth. Otherwise, the Kiessig fringes will decay rapidly to a level where they no longer interfere with the Laue oscillations. However, in order for this phenomenon to play a key role, the Kiessig fringes will have to extend all the way up to the diffraction peak that is investigated. Since Kiessig fringes for these samples usually fall below the noise level at 2θ angles between 5° and 10°, this mechanism is assumed to play a very minor role here. Small amounts of unwanted monoclinic HZO, indicated by m (002), show up just below 35°, which is to be expected for films of this thickness. As film thickness grows, the strain starts to relax and more of the unstrained, monoclinic ground state is expected. Based on the results from Fig. 2(b), the sample grown at 800 °C and 0.15 mbar pO2 showed the least monoclinic contamination in the HZO layer. Therefore, this sample was investigated more thoroughly.
In order to get a better understanding of the strain state and crystal quality of these samples, dynamical XRD simulations are run and compared to the experimental data. The simulations are done by employing the XRD server from S. Stepanov.18–20 For the simulations the substrate is STO and the main reflection is the (001) peak. The LSMO is simulated as LaMnO3 (LMO), since this is easier to incorporate into the simulations. The simulation of the HZO layer is slightly more cumbersome, since it does not grow in a cube-on-cube-like manner on top of the LSMO and the platform as developed by Stepanov simulates the same main diffraction peak, in this case (001), for all subsequent layers. In order to circumvent this problem, a rhombohedral HfO2 crystal was added to its internal database. Instead of letting the program simulate this layer by its default settings, the susceptibility of the HZO layer (χ0, χh) is manually entered into the simulation so that it is possible to simulate the correct (111) reflection. The overall fidelity of the simulation can partly be judged by eye. However, a more quantitative and verifiable parameter would be useful for determining how good the simulation is. In order to do this, a figure of merit of the fit is defined by looking at the root mean square error on a log scale:  .
.
Here the sum runs over all data points indexed by i and the subscripts m and s denote the measured and simulated data points, respectively. This value is minimized within the given restraints in order to get the best fit.
The model was refined by employing a similar strategy as Kane et al. for their work on LaNiO3 grown on LaAlO3.21 To model strain and interfacial layers, the layers are split up into multiple sublayers, each with slightly different strain and roughness parameters. The single layer simulation in the top panel of Fig. 3 shows a reasonable match between experiment and simulation, with the periodicity of the Laue oscillations in good agreement. For this simulation, the thickness of the LSMO layer was set at 19.5 nm and the HZO thickness was set at 10.3 nm. This is in reasonable agreement with the thicknesses that were extracted from the XRR measurements, although the LSMO seems to be slightly thinner here. The asymmetry around the STO and LSMO (001) peak is not completely reproduced, as can be seen from the fact that the intensity of the simulation is a bit too high on the right-hand side. Splitting up the LSMO and HZO layers into three and two sublayers, respectively, gives the results that are shown in the bottom panel of Fig. 3. The sublayer thickness adds up to the same thickness as for the single layer simulation. The LSMO layer is split up into three equally thick sublayers, with a strain gradient being modelled as decreasing strain throughout the stack. For the HZO layer it is known that an interfacial tetragonal phase is formed of about one unit cell. This interfacial layer has been observed in ALD-grown HfO222 as well as in yttria-stabilized zirconia (YSZ) on STO23 and is known to be heavily strained. Therefore, when modelling the HZO, a very thin interfacial layer is added with a thickness of 5 Å. The rest of the HZO is modelled as a homogeneous layer. Although the asymmetry around the peak at 23° is still not completely matched, it is clear that splitting up the layers results in a better fit. The intensities of the experimental and simulated data are more similar and the overall Laue fringes are replicated more accurately. The asymmetry of the Laue oscillations around the HZO (111) peak is present in the simulation. Similar simulations for the other two samples can be found in Fig. S2 in the ESI.†
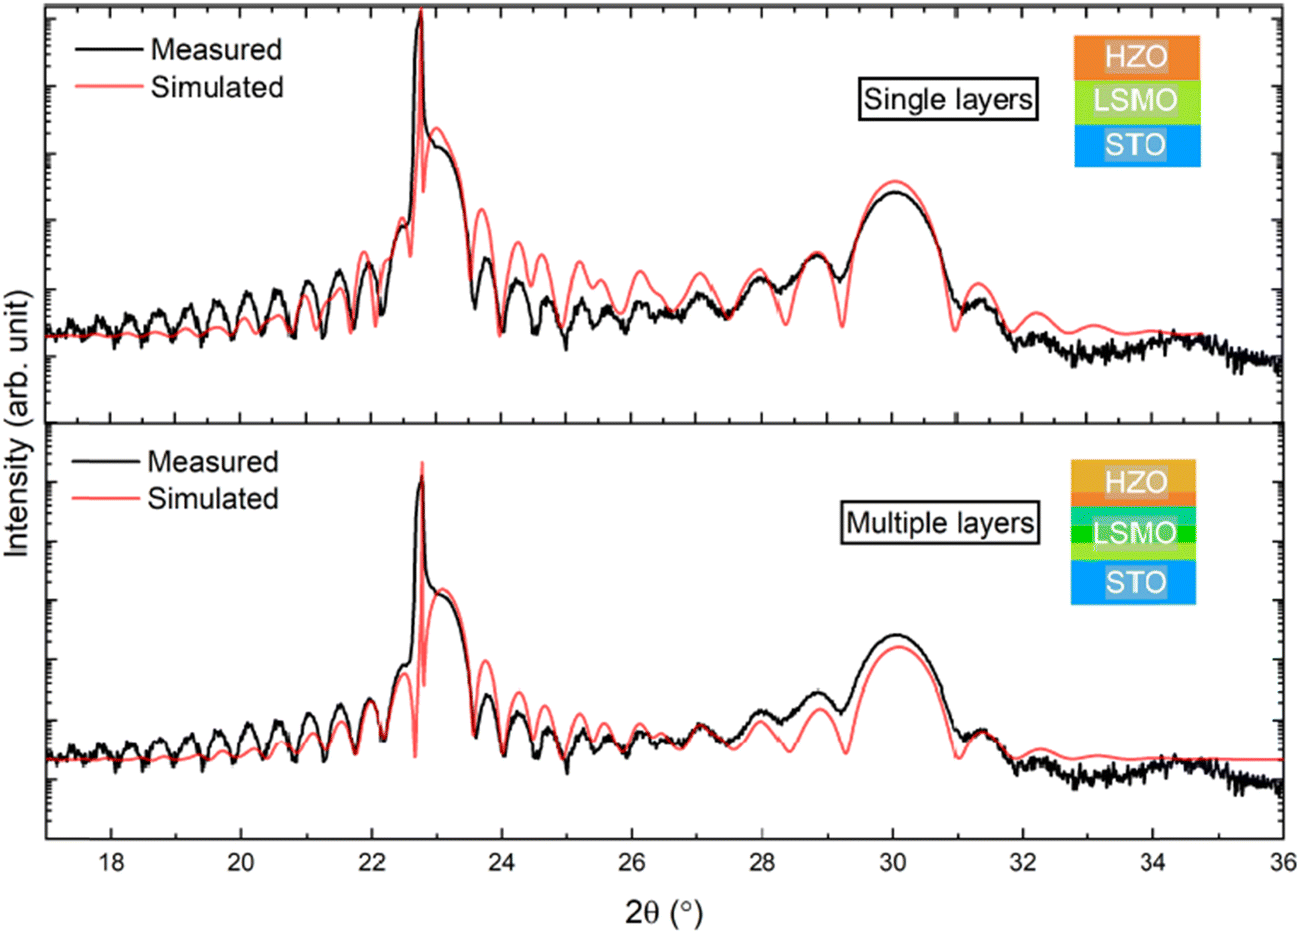 | ||
| Fig. 3 Both graphs show the experimental data in black and the simulated data in red. The top graph shows the simulation for single layers. The bottom graphs show the results of the simulation in case the LSMO and the HZO layers are split up into three and two sublayers, respectively. | ||
Whether or not the HZO is truly rhombohedral can be verified by measuring a pole figure at the 2θ position of the HZO (111) peak. This pole figure is shown in Fig. 4.
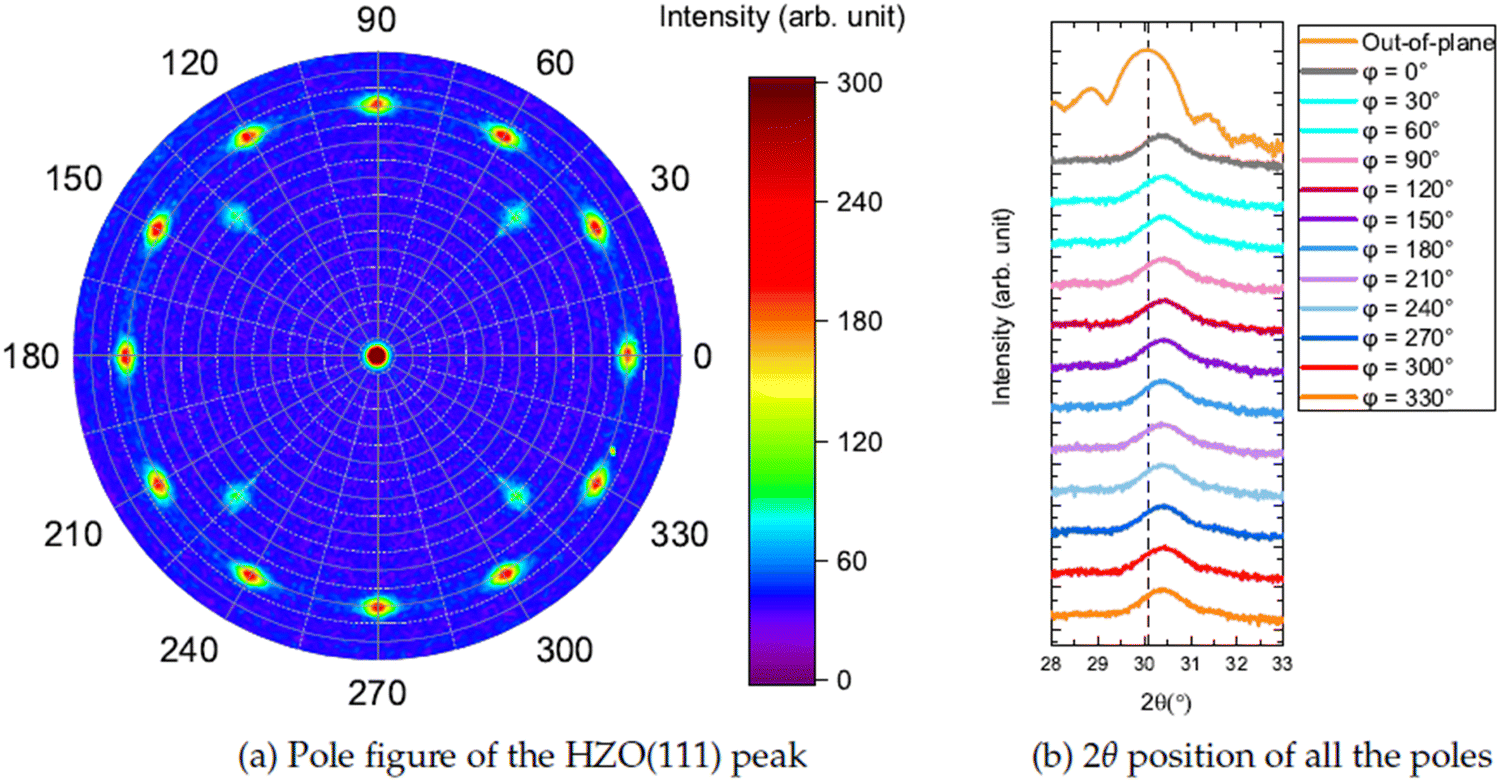 | ||
| Fig. 4 Panel (a) shows the pole figure of the HZO (111) peak of a 10 nm HZO film on a single crystal STO substrate. The radial angle χ ranges from 0° up to 85° and the azimuthal angle ϕ ranges from 0° to 359°. Panel (b) shows the 2θ position of each pole. The dashed line is drawn at the position of the out-of-plane (111) pole as a guide to the eye. | ||
Twelve poles are clearly visible at ϕ ≈ 71°, fitting with 4 crystallographic domains corresponding to the (11−1), (1−11) and (−111) reflections. These domains follow the 4-fold cubic symmetry of the underlying substrate. The 4 weaker reflections at ϕ ≈ 55° correspond to (001)-oriented domains in the film, with the (111), (−111), (1−11) and (−1−11) reflections expected at (for cubic symmetry) χ ≈ 55°, separated by an azimuthal angle of ϕ = 90°. Scanning the 2θ angles of each pole separately results in the graph of Fig. 4(b). The poles are all shifted slightly to higher 2θ angles with respect to the 2θ angle of the out-of-plane pole, indicating that the d-spacing of the planes corresponding to the poles is smaller than the out-of-plane d-spacing. This can only be related to a rhombohedral symmetry.
Discussion & conclusions
The samples that were grown show a well-controlled growth, as indicated by the RHEED oscillations and confirmed by XRR measurements. Moreover, the 2θ–ω scans reveal a well-oriented HZO (111) layer with small amounts of the contaminating monoclinic phase present. Judging from the Laue oscillations, it seems as if the films that are presented here are at least of similar quality as the films grown in,8 with good crystalline coherence in both the LSMO and HZO layers. Dynamical XRD simulations show that the interface roughnesses are indeed relatively small. The RMS roughness values of all the interfaces are ≤ 0.5 nm in the simulations, which is in good agreement with the RMS roughness that is extracted from the AFM measurements. The extracted thicknesses from the simulations agree well with the thicknesses that were extracted from the XRR measurements. The simulations shed more light on the important role that interfacial layers and strain play in these thin films. Modelling a strain gradient within the LSMO layer and introducing an interfacial sublayer within the HZO was necessary to have an agreement between experimental and simulated data. This shows that the modelling of multilayer systems, where epitaxial strain plays a role, can benefit from these kinds of dynamical XRD simulations. Furthermore, a thorough investigation of the interfaces in this system, e.g. by STEM, would be invaluable to get a better understanding of the structure of the interfaces themselves and help further improve the XRD model as described in this manuscript.Data availability
The data that support the findings of this study are available in the main text, ESI,† as well as from the corresponding authors upon reasonable request.Conflicts of interest
There are no conflicts to declare.Acknowledgements
The authors would like to thank H2020 Marie Sklodowska-Curie Action ITN-MANIC 861153 for funding.References
- I. P. Batra, P. Wurfel and B. D. Silverman, Phase transition, stability, and depolarization field in ferroelectric thin films, Phys. Rev. B: Condens. Matter Mater. Phys., 1973, 8(7), 3257–3265 CrossRef CAS.
- S. S. Cheema, Enhanced ferroelectricity in ultrathin films grown directly on silicon, Nature, 2020, 580(7804), 478–482 CrossRef CAS PubMed.
- T. D. Huan, V. Sharma, G. A. Rossetti and A. R. Ramprasad, Pathways towards ferroelectricity in hafnia, Phys. Rev. B: Condens. Matter Mater. Phys., 2014, 90(6), 064111 CrossRef CAS.
- M. Hoffmann, U. Schroeder, T. Schenk, T. Shimizu, H. Funakubo, O. Sakata, D. Pohl, M. Drescher, C. Adelmann, R. Materlik, A. Kersch and T. Mikolajick, Stabilizing the ferroelectric phase in doped hafnium oxide, J. Appl. Phys., 2015, 118(7), 072006 CrossRef.
- F. P. G. Fengler, M. Pesic, S. Starschich, T. Schneller, U. Bottger, T. Schenk, M. H. Park, T. Mikolajick and U. Schroeder, Comparison of hafnia and pzt based ferroelectrics for future non-volatile frame applications, in 46th European Solid-State Device Research Conference (ESSDERC), Lausanne, Switzerland, 2016.
- R. Batra, H. D. Tran and R. Ramprasad, Stabilization of metastable phases in hafnia owing to surface energy effects, Appl. Phys. Lett., 2016, 108(17), 172902 CrossRef.
- S. Starschich and U. Boettger, An extensive study of the influence of dopants on the ferroelectric properties of HfO2, J. Mater. Chem. C, 2017, 5(2), 333–338 RSC.
- Y. Wei, P. Nukala, M. Salverda, S. Matzen, H. J. Zhao, J. Momand, A. S. Everhardt, G. Agnus, G. R. Blake, P. Lecoeur, B. J. Kooi, J. Iniguez, B. Dkhil and B. Noheda, A rhombohedral ferroelectric phase in epitaxially strained Hf0.5Zr0.5O2 thin films, Nat. Mater., 2018, 17, 1095–1100 CrossRef CAS PubMed.
- P. Nukala, Y. Wei, V. D. Haas, Q. Guo, J. Antoja-Lleonart and B. Noheda, Guidelines for the stabilization of a polar rhombohedral phase in epitaxial Hf0.5Zr0.5O2 thin films, Ferroelectrics, 2020, 569(1), 148–163 CrossRef CAS.
- I. Fina and F. Sánchez, Epitaxial Ferroelectric HfO2 Films: Growth, Properties, and Devices, ACS Appl. Electron. Mater., 2021, 3(5), 1530–1549 CrossRef CAS.
- M. D. Glinchuk, B. Y. Zaulychny and V. A. Stephanovich, Depolarization field and properties of thin ferroelectric films with inclusion of the electrode effect, Phys. Solid State, 2005, 47(7), 1331–1339 CrossRef CAS.
- H.-J. Lee, M. Lee, K. Lee, J. Jo, H. Yang, Y. Kim, S. C. Chae, U. Wafhmare and J. H. Lee, Scale-free ferroelectricity induced by flat phonon bands in HfO2, Science, 2020, 369(6509), 1343–1347 CrossRef CAS PubMed.
- P. Nukala, M. Ahmadi, Y. Wei, S. D. Graaf, E. Stylianidis, T. Chakrabortty, S. Matzen, H. W. Zandbergen, A. Björling, D. Mannix, D. Carbone, B. Kooi and B. Noheda, Reversible oxygen migration and phase transitions in hafnia-based ferroelectric devices, Science, 2021, 372(6542), 630–635 CrossRef CAS PubMed.
- A. Marthinsen, C. Faber, U. Aschauer, N. A. Spaldin and S. M. Selbach, Coupling and competition between ferroelectricity, magnetism, strain, and oxygen vacancies in amno3 perovskites, MRS Commun., 2016, 6(3), 182–191 CrossRef CAS.
- M. H. Park, H. J. Kim, Y. J. Kim, W. Lee, T. Moon and C. S. Hwang, Evolution of phases and ferroelectric properties of thin Hf0.5Zr0.5O2 films according to the thickness and annealing temperature, Appl. Phys. Lett., 2013, 102, 242905 CrossRef.
- I. Robinson and I. Vartanyants, Use of coherent X-ray diffraction to map strain fields in nanocrystals, Appl. Surf. Sci., 2001, 182(3), 186–191 CrossRef CAS.
- A. M. Miller, M. Lemon, M. A. Choffel, S. R. Rich, F. Harvel and D. C. Johnson, Extracting information from X-ray diffraction patterns containing laue oscillations, Z. Naturforsch., 2022, 77(4–5), 313–322 CrossRef CAS.
- S. Stepanov, https://x-server.gmca.aps.anl.gov/, [Online]. Available: https://x-server.gmca.aps.anl.gov/. [Accessed 12 9 2022].
- S. A. Stepanov, E. A. Kondrashkina, R. Koehler, D. V. Novikov, G. Materlik and S. M. Durbin, Dynamical X-ray diffraction of multilayers and superlattices: Recursion matrix extension to grazing angles, Phys. Rev. B: Condens. Matter Mater. Phys., 1998, 57(8), 4829–4841 CrossRef CAS.
- W. J. Bartels, J. Hornstra and D. J. W. Lobeek, X-ray diffraction of multilayers and superlattices, Acta Crystallogr. Sect. A, 1986, 42(6), 539–545 CrossRef.
- M. M. Kane, A. Vailionis, L. J. Riddiford, A. Mehta, A. T. N’Diaye, C. Klewe, P. Shafer, E. Arenholz and Y. Suzuki, Emergent longrange magnetic order in ultrathin (111)-oriented lanio3 films, npj Quantum Mater., 2021, 6(1), 44 CrossRef CAS.
- M. Pešić, F. Fengler, L. Larcher, A. Padovani, T. Schenk, E. Grimley, X. Sang, J. LeBeau, S. Slesazeck, U. Schroeder and T. Mikolajick, Physical Mechanisms behind the Field-Cycling Behavior of HfO2-Based Ferroelectric Capacitors, Adv. Funct. Mater., 2016, 26(25), 4601–4612 CrossRef.
- J. Garcia-Barriocanal, A. Rivera-Calzada, M. Varela, Z. Sefrioui, E. Iborra, C. Leon, S. J. Pennycook and J. Santamaria, Colossal ionic conductivity at interfaces of epitaxial zro2:y2o3/srtio3 heterostructures, Science, 2008, 321(5889), 676–680 CrossRef CAS PubMed.
Footnote |
| † Electronic supplementary information (ESI) available. See DOI: https://doi.org/10.1039/d4ma00550c |
| This journal is © The Royal Society of Chemistry 2024 |