 Open Access Article
Visible light photocatalytic NOx removal with suppressed poisonous NO2 byproduct generation over simply synthesized triangular silver nanoparticles coupled with tin dioxide
Viet Van
Pham
 *a,
Thang Quoc
Nguyen
a,
Hai Viet
Le
 b and
Thi Minh
Cao
a
aHUTECH University, Ho Chi Minh City, Viet Nam. E-mail: pv.viet@hutech.edu.vn
bVNUHCM, University of Science, Ho Chi Minh City, Viet Nam
First published on 20th March 2024
Abstract
The treatment or conversion of air pollutants with a low generation of secondary toxic substances has become a hot topic in indoor air pollution abatement. Herein, we used triangle-shaped Ag nanoparticles coupled with SnO2 for efficient photocatalytic NO removal. Ag triangular nanoparticles (TNPs) were synthesized by the photoreduction method and SnO2 was coupled by a simple chemical impregnation process. The photocatalytic NO removal activity results show that the modification with Ag TNPs significantly boosted the removal performance up to 3.4 times higher than pristine SnO2. The underlying roles of Ag TNPs in NO removal activity improvement are due to some advantages of Ag TNPs. Moreover, the Ag TNPs contributed photogenerated holes as the main active species toward enhancing the NO oxidation reaction. In particular, the selectivity toward green products significantly improved from 52.78% (SnO2) to 86.99% (Ag TNPs/SnO2). The formation of reactive radicals under light irradiation was also verified by DMPO spin-trapping experiments. This work provides a potential candidate for visible-light photocatalytic NO removal with low toxic byproduct generation.
1. Introduction
Currently, air pollution has become one of the most concerning issues. The increasing emission of nitrogen oxide (NOx), a typical air pollutant, from fossil fuel combustion into the atmosphere has multiple effects on human health and the environment, such as photochemical smog and acid rain.1 Therefore, it is essential to find an approach that can effectively convert NO without secondary emissions. Among the current strategies, semiconductor photocatalysis is considered a promising and sustainable solution because it uses limitless solar light as the input energy source and does not require harsh temperature and pressure conditions.2–10 In addition, in photocatalytic NO removal, simultaneous toxic NO2 conversion and green product (NO3−) selectivity are also worth considering along with the NO removal efficiency.11,12 Hence, it is vital to find a promising catalyst system that can meet these requirements.So far, a wide range of metal oxide catalysts such as CeO2, CoOx, Fe2O3, WO2, WO3, ZnO, TiO2, and SnO2 have been systematically studied.12–22 As an n-type metal oxide semiconductor, SnO2 has been extensively applied in photo-electrochemistry because of its advantages, such as high stability, non-toxicity, and cost-effectiveness. However, the use of SnO2 as a single catalyst is not efficient enough due to the large bandgap and rapid charge recombination;23 accordingly, many modification strategies such as doping,24,25 morphology control,26,27 and incorporation of a co-catalyst28,29 have been devoted to further enhance the photocatalytic efficiency. Among these approaches, coupling with a plasmonic co-catalyst, typically silver (Ag), is beneficial for not only expanding the light absorption range but also enhancing photogenerated charge separation.30 Moreover, compared with other plasmonic metals (such as Au and Pt), Ag is more cost-effective.31 Zhang et al. reported that the presence of the co-catalyst Ag0 could boost electron transport to nitrate and enhance nitrate to N2 conversion with a selectivity of 98.8%.32 In addition, the strong metal–support interaction between the Ag nanoparticles and TiO2 provided an enhanced localized surface plasmonic resonance (LSPR) effect and enhanced the efficiency (39.5%) and selectivity (96.7%) of the photocatalytic oxidation reaction of 5-hydroxymethylfurfural.33 Moreover, it has been proven that the LSPR of Ag triangular nanoparticles (TNPs) is much stronger than that of Ag spherical nanoparticles.34 The distribution of the electric field around the sharp tips of the triangular nanoparticles is significantly higher than that around the edge of the spherical nanoparticles, thus enhancing the photocatalytic activity.35
In this study, our group modified the surface of SnO2 with Ag triangular nanoparticles (TNPs) using a simple impregnation method. The synthesized Ag TNPs coupled with SnO2 showed a substantial improvement in both NO removal efficiency and selectivity. The photogeneration of reactive species and their role in NO oxidation were systematically investigated by scavenger trapping and DMPO spin-trapping tests. Eventually, a possible mechanism of the photocatalytic NO removal reaction over Ag TNPs coupled with SnO2 was also proposed based on the obtained results.
2. Experimental methods
2.1. Materials
Silver nitrate (AgNO3), trisodium citrate dihydrate (C6H5Na3O7·2H2O), sodium borohydride (NaBH4), sodium hydroxide (NaOH), tin(IV) oxide, potassium iodide (KI), terephthalic acid (C8H6O4), potassium dichromate (K2Cr2O7), benzoquinone (C6H4O2), and deionized (DI) water were used. All chemicals were of analytical grade and used without further purification.2.2. Synthesis of Ag TNPs/SnO2
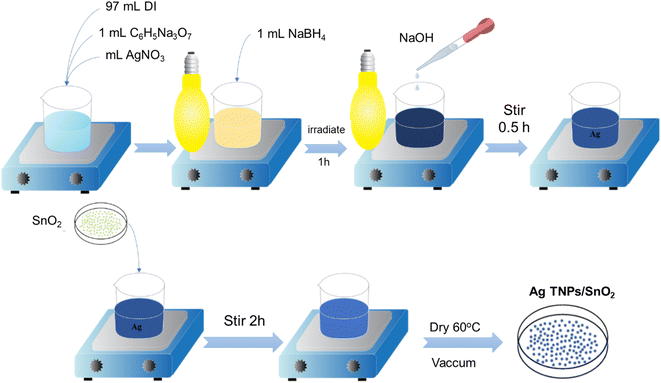
Ag TNP solution was prepared by a photoreduction method based on the optimized parameters used in our previously reported studies.36 First, 1 mL of AgNO3 (20 mM) and 1 mL of C6H5Na3O7·2H2O (900 mM) were dropped slowly into 97 mL DI water and stirred in the dark for 15 min. Second, 1 mL of NaBH4 (0.25 mM) was added to the above solution to reduce the Ag+ ions. Third, the solution was irradiated with a sodium lamp (Phillips, 70 W, λ = 589 nm) for 60 min. Finally, the solution pH was tuned to pH 9 using NaOH, and the solution was further illuminated for 130 min. The formation of Ag TNPs was verified using UV-Vis absorption spectroscopy in the wavelength range of 350–800 nm.The Ag TNPs/SnO2 sample was prepared by a chemical impregnation method following the steps shown in Scheme 1. First, a specific amount of SnO2 powder was added to the Ag TNP solution and magnetically stirred for 2 h to achieve a concentration of 1.5 wt% Ag TNPs/SnO2. The use of 1.5 wt% Ag was based on the optimization results from previous works.37,38 The suspension was then centrifuged, washed, and dried at 60 °C under a vacuum for 4 h to obtain Ag TNPs/SnO2.
2.3. Characterization of the materials
An X-ray diffractometer (Bruker D8) was employed to check the crystal structure and phases of the as-prepared materials. The chemical bond vibration and composition of the materials were studied using Fourier-Transform Infrared (FTIR) spectrometry (JASCO V-4700). The morphology and elemental composition of the samples were investigated using field-emission scanning electron microscopy (FESEM, Hitachi S-4800) equipped with an EDS detector. UV-Vis diffuse reflectance spectra of the powder samples were monitored using a JASCO V-770 spectrometer according to an integrated sphere method. The photoluminescence (PL) was measured using an Agilent Cary spectrometer to determine the emissions and photogenerated charge transfer of the materials. BET measurements were conducted on a Micromeritics machine to identify the pore size and surface area of the as-prepared materials. High-resolution mode X-ray photoelectron spectroscopy (HRXPS) of Sn 3d, O 1s, and Ag 3d in the Ag TNPs/SnO2 samples was performed to identify the existence of compounds in the product (K-Alpha, Thermo Fisher Scientific). Electron spin resonance (ESR) was used to identify the hydroxyl radicals (˙OH) and superoxide radicals (˙O2−) in the powder photocatalyst in a DMPO solution under visible light conditions. This method has been widely used in research on photocatalytic reagents used for NOx gas decomposition on solid materials.39–42 Mott–Schottky curves were recorded using a Biologic SP200 Potentiostat with a three-electrode cell to determine the conduction band potentials of the catalysts.2.4. Photocatalytic NO removal activity assessment
The photocatalytic NO oxidation experiment was conducted using a continuous-stream stainless-steel reactor (30 cm × 15 cm × 10 cm in length × width × height) under visible-light illumination at room temperature. An Osram 300 W, 230 V with a cut-off filter (λ > 380 nm) and a light intensity of 4000–4600 lux was used as the visible light source and placed 20 cm vertically above the reactor window. A schematic illustration of the setup is illustrated in our previous study.43 Typically, 0.2 g of the photocatalyst was dispersed in 20 mL of DI water by ultrasonication for 20 min. The suspension was then transferred to a 12 cm diameter glass dish and dried at 60 °C in a vacuum oven. Before light irradiation, the NO adsorption–desorption equilibrium was established by flowing a stream of 500 ppm NO into the reactor for 30 min in the dark. The reactor chamber system was maintained at room temperature using a cooling fan to maintain the stability of the reaction conditions. After reaching the adsorption–desorption equilibrium, the lamp was switched on, and the decline in NO concentration was monitored using a NOx analyzer (Model 42C, Thermo Environmental Instruments Inc. Franklin, MA). This machine determined the NO, NO2 and total NOx concentrations during the photocatalytic reaction test.The conversion efficiency of NO (η) was calculated using eqn (1):
 | (1) |
The Langmuir–Hinshelwood model22 was used to determine the kinetic rate k (min−1) of the photocatalytic NO removal reaction (eqn (2)):
 | (2) |
The NO2 conversion performance ψ (%) was calculated using eqn (3):
 | (3) |
 is the initial concentration of NO2;
  is the NO2 concentration after light illumination.
The green product selectivity ε (%) was evaluated using eqn (4)
 | (4) |
The trapping test was carried out in the same conditions as the photocatalytic NO removal activity evaluation experiment with the addition of scavengers to investigate the photocatalytic NO removal mechanism and the role of reactive species formed during the reaction. The assay was conducted as follows: 1.0 wt% of KI, K2Cr2O7, terephthalic acid, and benzoquinone were dispersed in 25 mL DI water and then dried at 60 °C to test the ability of the sample in trapping holes (h+), electrons (e−), hydroxyl (˙OH), and superoxide radicals (˙O2−).
3. Results and discussion
3.1. Properties of the materials
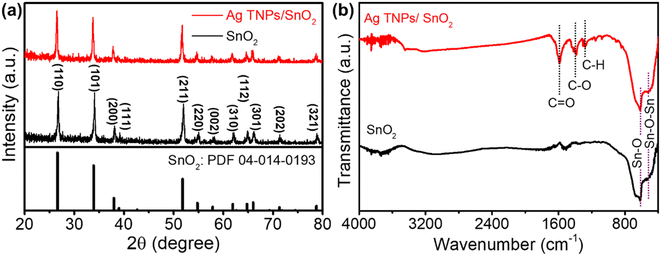
The crystal structure and phases of the as-prepared samples were analyzed using XRD. As shown in Fig. 1a, SnO2 showed good crystallinity with its typical peaks indexed to the (110), (101), (200), (211), (220), (002), (310), (112), (301), (202), and (312) planes (PDF-04-014-0193). For Ag TNPs/SnO2, there was no formation of secondary phases, indicating that modification with the Ag TNPs did not introduce impurities or change the crystal structure of SnO2. In addition, the absence of Ag peaks in the XRD pattern of Ag TNPs/SnO2 could be due to the low amount and weak crystal characterization of Ag TNPs. The structural information of the functional groups was further determined using FTIR spectroscopy (Fig. 1b). For SnO2, there were two characteristic bands located at around 533 and 620 cm−1 assigned to the Sn–O–Sn and Sn–O stretching vibration modes, respectively.44,45 Similar features with some additional bands in the 1200–1700 cm−1 range were observed for the Ag TNPs/SnO2 sample. The peaks at around 1589, 1388, and 1281 cm−1 could be attributed to the C![[double bond, length as m-dash]](https://www.rsc.org/images/entities/char_e001.gif) O asymmetric stretching, C–O stretching, and C–H stretching modes46 that stem from the precursor of Ag TNPs synthesis.
O asymmetric stretching, C–O stretching, and C–H stretching modes46 that stem from the precursor of Ag TNPs synthesis.
For photocatalytic NO removal, morphology could also be an important parameter that influences the photocatalytic activity. Hence, the morphology of the as-prepared materials was observed by SEM (Fig. 2). Fig. 2a illustrates that SnO2 possessed different shapes, of which the spherical shape was the primary shape, and there were no significant changes in the morphology after modification with Ag TNPs (Fig. 2b). The size distribution histogram (Fig. 2c and d) indicates that SnO2 nanoparticles had an average size of 40–50 nm. In addition, Fig. 2c shows some triangular particles with an average edge length of 20–30 nm, representing the existence of Ag TNPs in the products. In addition, the chemical composition of Ag TNPs/SnO2 was further studied by STEM-EDS elemental mapping (Fig. 2e–h), which showed the presence of Sn, O, and Ag elements and the uniform distribution of Ag TNPs. Furthermore, the amount of Ag formed after the synthesis process was determined by X-ray fluorescence (XRF) spectrum analysis, and the results indicated that the amount of Ag was about 1.5 wt% in the product.
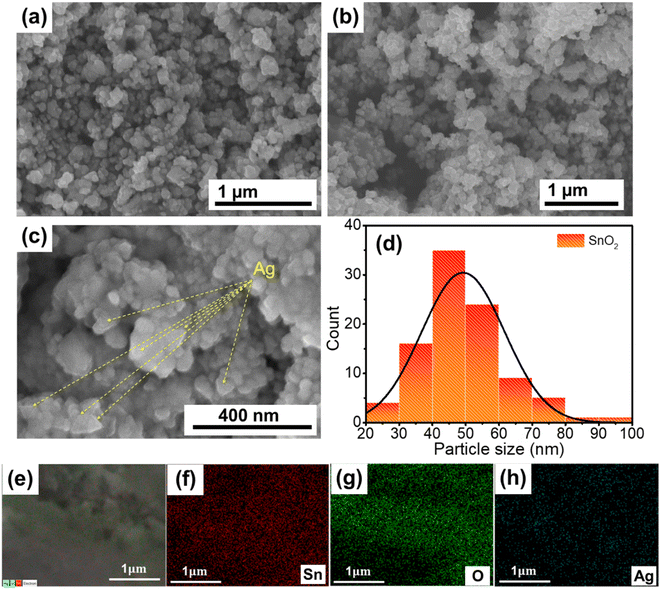 | ||
| Fig. 2 SEM images of (a) SnO2 and (b and c) Ag TNPs/SnO2; (c) particle size distribution histogram of SnO2 in the Ag TNPs/SnO2 sample; (e–h) SEM-EDS elemental mapping of Ag TNPs/SnO2. | ||
The optical properties of the as-prepared catalysts were examined by UV-Vis DRS. Fig. 3a shows the absorption spectrum of SnO2, which has an absorption edge positioned at around 370 nm. After the incorporation of Ag TNPs, there was a redshift in the absorption edge to 390 nm and a broad peak in the range of 500–800 nm due to the presence of the LSPR effect of Ag TNPs (Fig. 3b). In addition, the bandgap values were calculated using the Kubelka–Munk function (eqn (5)) and data from the DRS UV-Vis spectra as it is an efficient method for estimating the optical bandgap of semiconductor and metal/semiconductor heterojunctions.47–51
 | (5) |
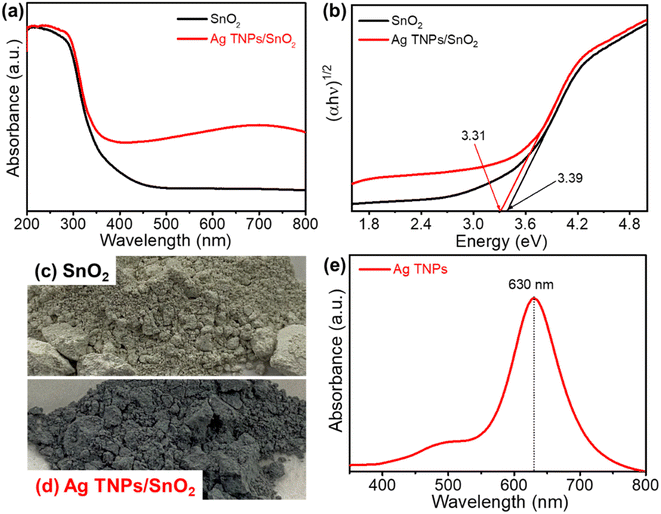 | ||
| Fig. 3 (a) UV-Vis DRS and (b) Tauc plots of SnO2 and Ag TNPs/SnO2; (c and d) optical images of as-prepared SnO2 and Ag TNPs/SnO2; (e) UV-Vis absorption spectrum of Ag TNPs. | ||
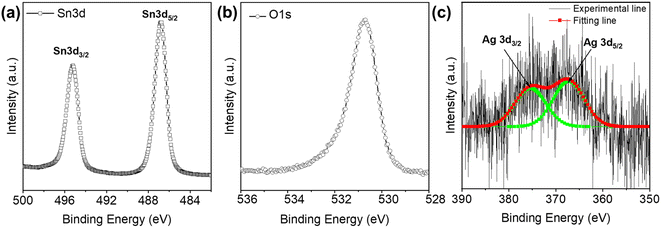
Furthermore, the existence of Ag TNPs in the Ag TNPs/SnO2 product was also determined by XPS measurement, as shown in Fig. 4. The HR-XPS results of Sn 3d and O 1s showed the existence of SnO2 in the products. In detail, the two peaks at binding energies of 495 eV and 486 eV represented the Sn4+ ions in SnO2. Further, the O 1s peak at a binding energy of 530.7 eV represented the O atoms in SnO2. The results are in agreement with the earlier reports.52,53 The presence of metallic Ag in the compound after the synthesis process was confirmed by the appearance of peaks for the Ag 3d3/2 and Ag 3d5/2 orbitals at 373.7 eV and 368.2 eV, respectively.54,55 Along with the other results, i.e., EDX mapping, UV-Vis DRS, and UV-Vis of the Ag TNPs solution, the HR-XPS data of Ag 3d demonstrated the existence of Ag in the Ag TNPs/SnO2 products although the concentration of Ag TNPs in the composite was relatively small.
3.2. Photocatalytic NO removal activity assessment
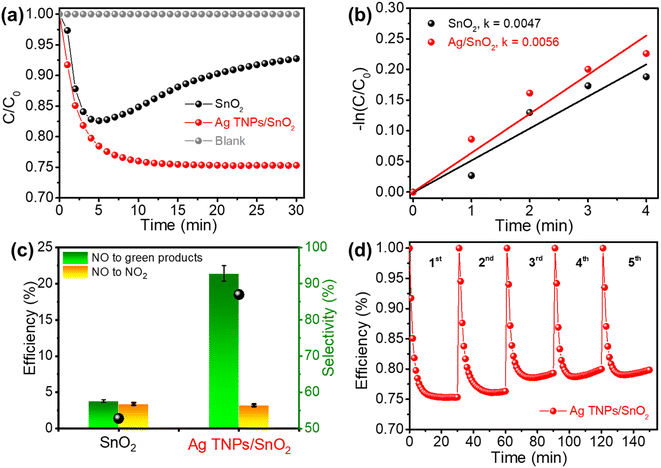
The photocatalytic activity of the as-prepared samples was evaluated based on the NO removal ability under a 500 ppb NO flow and visible-light irradiation. Before switching the light on, the adsorption–desorption equilibrium between the NO gas and catalyst was established. In addition, the blank test was conducted without the presence of a catalyst, which showed the high stability of NO under light illumination (Fig. 5a). Pristine SnO2 exhibited a low photocatalytic NO removal performance of 7.2% because of ineffective light utilization and rapid charge recombination. Moreover, the NO photocatalytic performance of pure SnO2 tended to decrease sharply after 5 min of illumination. This can be explained by the special surface properties of SnO2; surface oxygen vacancy defects that often exist in SnO2 adsorb the NO2 gas produced during the reaction process. This conclusion has also been mentioned in recent studies.56–59 The existence of these defects is also verified by the PL analysis results shown in Fig. 6. In comparison, a substantial enhancement in photocatalytic activity was observed in the Ag TNPs/SnO2 sample because the presence of Ag TNPs extended the light absorption range and improved photogenerated charge separation. The photocatalytic NO removal performance over Ag TNPs/SnO2 (24.6%) was 3.4 times higher than that of pristine SnO2. Table 1 shows the characterized properties of the pores and surface area of SnO2 and Ag TNPs/SnO2. Clearly, the modification of SnO2 with Ag TNPs helps increase the surface area and the volume of pores, thereby enhancing the adsorption ability and interaction of the NO gas with the catalyst. Furthermore, the NO removal rate of Ag TNPs/SnO2 (0.0056 min−1) was 1.2 times higher than that of pristine SnO2 (0.0047 min−1) (Fig. 5b). Apart from the photocatalytic NO removal efficiency, the toxic NO2 conversion performance is another important factor. As we know, NO2 is a poisonous gas and a byproduct generated during the NO removal reaction;60 therefore, it is necessary to achieve good NO removal with suppressed NO2 formation. Further, NO3− conversion is considered a green product of the NOx photocatalytic reaction, and the rate of NO3− formation was calculated and is expressed in Fig. 5c. In detail, NO to NO2 conversion could be significantly reduced to 3.2%, and the green product (NO3−) selectivity achieved was 86.99% over Ag TNPs/SnO2. For the commercial aspect, the stability of a catalyst also needs to be investigated in addition to the removal activity (Fig. 5d). The NO removal efficiency over Ag TNPs/SnO2 decreased by 4% after 5 runs, demonstrating that the stability of Ag TNPs/SnO2 is not durable. The decrease in NO removal efficiency over Ag TNPs/SnO2 after the recycling test can be explained by the lower stability of the Ag TNPs.| Sample | S BET (m2 g−1) | V pore (cm3 g−1) | D pore (nm) |
|---|---|---|---|
| SnO2 | 25.6 | 0.078 | 11 |
| Ag TNPs/SnO2 | 34 | 0.082 | 7.8 |
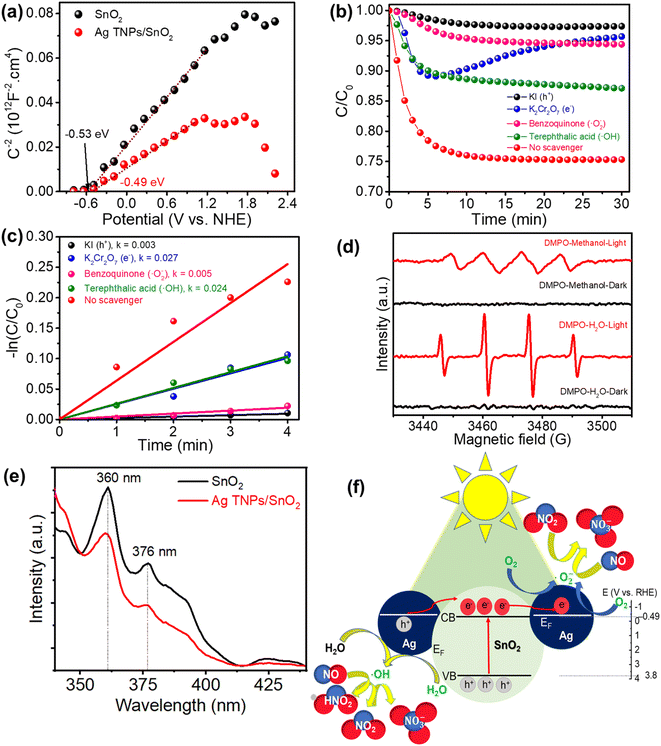
To get insights into the photocatalytic NO removal mechanism, the band structure was determined using Mott–Schottky (M–S) measurements (Fig. 6a). The M–S curve is an efficient method for determining the flat band potential that is nearly estimated for the conduction band of a semiconductor.61,62 Previous publications also indicate that the M–S curve test can be used to widen the metal/semiconductor heterojunction.47,63,64 The acquired conduction band (CB) values from the interception of the x-axis and the Mott–Schottky curves were −0.53 and −0.49 eV for SnO2 and Ag TNPs/SnO2, respectively. By combining these with the UV-Vis DRS results, the valence band values could be inferred as 3.18 and 3.17 eV for SnO2 and Ag TNPs/SnO2, respectively. Furthermore, the role of the reactive species in photocatalytic NO removal was studied by trapping tests in the presence of KI, K2Cr2O7, benzoquinone, and terephthalic acid as scavengers of photogenerated h+, e−, ˙O2−, and ˙OH, respectively. It is found that the addition of KI and benzoquinone has negative impacts on the photocatalytic NO removal efficiency and kinetic rate (Fig. 6b and c), implying the critical role of photogenerated holes and ˙O2− radicals. Obviously, photogenerated holes play an active role in the photocatalytic NOx removal reaction of Ag TNPs/SnO2, leading to the capture of free radicals generated mainly owing to the photogenerated holes. These photogenerated holes contribute to the formation of ˙OH agents that cause a decrease in NO concentration at the beginning (as per eqn (10) and (13)). Subsequently, other agents generated by the photogenerated electrons are no longer formed (as per eqn (9) and (12)), leading to a significant decrease in the photocatalytic activity of Ag TNPs/SnO2 in the presence of K2Cr2O7, causing an increasing trend of the C/C0 curve, as shown in Fig. 6b.
In addition, the formation of reactive radicals during the reaction was further verified by the DMPO spin-trapping test (Fig. 6d) in water and methanol environments to detect HO˙ and ˙O2− radicals, respectively. No signals were observed in the dark condition, whereas intensive signals of DMPO–HO˙ (intensity of 1![[thin space (1/6-em)]](https://www.rsc.org/images/entities/char_2009.gif) :
:![[thin space (1/6-em)]](https://www.rsc.org/images/entities/char_2009.gif) 2
2![[thin space (1/6-em)]](https://www.rsc.org/images/entities/char_2009.gif) :
:![[thin space (1/6-em)]](https://www.rsc.org/images/entities/char_2009.gif) 2
2![[thin space (1/6-em)]](https://www.rsc.org/images/entities/char_2009.gif) :
:![[thin space (1/6-em)]](https://www.rsc.org/images/entities/char_2009.gif) 1) and –˙O2− (intensity of 1
1) and –˙O2− (intensity of 1![[thin space (1/6-em)]](https://www.rsc.org/images/entities/char_2009.gif) :
:![[thin space (1/6-em)]](https://www.rsc.org/images/entities/char_2009.gif) 1
1![[thin space (1/6-em)]](https://www.rsc.org/images/entities/char_2009.gif) :
:![[thin space (1/6-em)]](https://www.rsc.org/images/entities/char_2009.gif) 1
1![[thin space (1/6-em)]](https://www.rsc.org/images/entities/char_2009.gif) :
:![[thin space (1/6-em)]](https://www.rsc.org/images/entities/char_2009.gif) 1) were detected under light illumination. This result indicates the indispensable role of light in reactive radical formation. The PL spectra of SnO2 and Ag TNPs/SnO2 (Fig. 6e) showed primary emission peaks related to the near-band-edge exciton emissions at 360 and 376 nm.65 In addition, a mission peak found at 425 nm could be assigned to the surface defect signal of materials.66 Moreover, the intensity of the emission peaks of SnO2 decreased significantly when Ag TNPs were decorated on SnO2, demonstrating a decrease in the recombination of photogenerated charges.
1) were detected under light illumination. This result indicates the indispensable role of light in reactive radical formation. The PL spectra of SnO2 and Ag TNPs/SnO2 (Fig. 6e) showed primary emission peaks related to the near-band-edge exciton emissions at 360 and 376 nm.65 In addition, a mission peak found at 425 nm could be assigned to the surface defect signal of materials.66 Moreover, the intensity of the emission peaks of SnO2 decreased significantly when Ag TNPs were decorated on SnO2, demonstrating a decrease in the recombination of photogenerated charges.
Based on the above results, the mechanism of photocatalytic NO removal is proposed in Fig. 6e. First, the electron–hole pairs are photo-generated, separated, and migrate to the surface of the catalyst (eqn (6)). As the Fermi level of Ag is the approximate conduction band (CB) of SnO2, the photoinduced electrons in the CB of SnO2 would transfer to the Ag TNPs and take part in the reduction reaction of adsorbed oxygens to form ˙O2− radicals (eqn (7)). This charge transfer process improves the separation of photoinduced charges. Meanwhile, the adsorbed H2O is oxidized into HO˙ radicals by the photogenerated holes in the valence band of SnO2 (eqn (8)). These reactive ˙O2− and HO˙ radicals can directly react with NO to produce NO3− (eqn (9) and (10)). Moreover, metallic Ag acts as the active site for NO, favoring the adsorption, activation, and stabilization of NO and NO2 to further undergo the deep oxidation process (eqn (11)–(13)) and preventing the release of toxic NO2.67,68
| Ag TNPs/SnO2 + hν → e− + h+ | (6) |
| e− + O2 → ˙O2− | (7) |
| h+ + H2O → HO˙ + H+ | (8) |
| NO + ˙O2− → NO3− | (9) |
| NO + 2HO˙ → NO3− + H+ | (10) |
 | (11) |
| 2NO2 + 2˙O2− → NO3− + O2 | (12) |
| NO2 + HO˙ → NO3− + H+ | (13) |
4. Conclusion
We prepared triangular-shaped Ag and coupled it with SnO2 using a simple method for effective NO elimination. The successful incorporation of Ag was verified by the plasmonic characteristic peak in UV-Vis DRS. The Ag TNPs/SnO2 sample exhibits superior NO removal performance compared with pristine SnO2. Furthermore, the presence of Ag also inhibits NO2 generation during the photocatalytic NO removal reaction. The selectivity of green products significantly improved from 52.78% (SnO2) to 86.99% (Ag TNPs/SnO2). This work highlights the role of plasmonic Ag triangular nanoparticles in the enhancement of NO removal efficiency and elimination of harmful NO2 byproduct conversion.Conflicts of interest
There are no conflicts to declare.Acknowledgements
This study was funded by the Department of Science and Technology of Ho Chi Minh City under contract No. 57/2021/HĐ-QKHCN.References
- J. Lin, W. Ho, X. Qin, C. F. Leung, V. K. Au and S. C. Lee, Small, 2022, 18, e2105484 CrossRef PubMed.
- M. N. Gordon, K. Chatterjee, N. Christudas Beena and S. E. Skrabalak, ACS Sustain. Chem. Eng., 2022, 10, 15622–15641 CrossRef CAS.
- G. Jiang, X. Li, M. Lan, T. Shen, X. Lv, F. Dong and S. Zhang, Appl. Catal., B, 2017, 205, 532–540 CrossRef CAS.
- D. Tantraviwat, A. Nattestad, J. Chen and B. Inceesungvorn, J. Colloid Interface Sci., 2023, 629, 854–863 CrossRef CAS PubMed.
- S. Boochakiat, B. Inceesungvorn, A. Nattestad and J. Chen, ChemNanoMat, 2023, 9, e202300140 CrossRef CAS.
- Y. Luo, B. Deng, Y. Pu, A. Liu, J. Wang, K. Ma, F. Gao, B. Gao, W. Zou and L. Dong, Appl. Catal., B, 2019, 247, 1–9 CrossRef CAS.
- Y. Li, Y. Xia, K. Liu, K. Ye, Q. Wang, S. Zhang, Y. Huang and H. Liu, ACS Appl. Mater. Interfaces, 2020, 12, 25494–25502 CrossRef PubMed.
- X. Li, Q. Dong, F. Li, Q. Zhu, Q. Tian, L. Tian, Y. Zhu, B. Pan, M. Padervand and C. Wang, Appl. Catal., B, 2024, 340, 123238 CrossRef CAS.
- Y. Xin, Q. Zhu, T. Gao, X. Li, W. Zhang, H. Wang, D. Ji, Y. Huang, M. Padervand, F. Yu and C. Wang, Appl. Catal., B, 2023, 324, 122238 CrossRef CAS.
- B. Rhimi, M. Padervand, H. Jouini, S. Ghasemi, D. W. Bahnemann and C. Wang, J. Environ. Chem. Eng., 2022, 10, 108566 CrossRef CAS.
- V. V. Pham, N. N. T. Pham, H. V. Le and T. M. Cao, J. Environ. Chem. Eng., 2023, 11, 111556 CrossRef CAS.
- P. Van Viet, T.-D. Nguyen, D.-P. Bui and C. M. Thi, J. Materiomics, 2022, 8, 1–8 CrossRef.
- H. Shang, S. Huang, H. Li, M. Li, S. Zhao, J. Wang, Z. Ai and L. Zhang, Chem. Eng. J., 2020, 386, 124047 CrossRef CAS.
- J. Fragoso, D. Barreca, L. Bigiani, A. Gasparotto, C. Sada, O. I. Lebedev, E. Modin, I. Pavlovic, L. Sánchez and C. Maccato, Chem. Eng. J., 2022, 430, 132757 CrossRef CAS.
- Y. Wan, J. Li, J. Ni, C. Wang, C. Ni and H. Chen, J. Hazard. Mater., 2022, 435, 129073 CrossRef CAS PubMed.
- Y. Ou, J. Lu, W. Zhang, Q. U. Hassan, L. Zhu, J. Gao, X. Shi, Y. Huang, P. Liu and G. Zhu, Mater. Today Phys., 2022, 27, 100804 CrossRef CAS.
- H. Wu, C. Yuan, R. Chen, J. Wang, F. Dong, J. Li and Y. Sun, ACS Appl. Mater. Interfaces, 2020, 12, 43741–43749 CrossRef CAS.
- Y. Huang, Z. Guo, H. Liu, S. Zhang, P. Wang, J. Lu and Y. Tong, Adv. Funct. Mater., 2019, 29, 1903490 CrossRef CAS.
- N. Li, X. Gao, J. Su, Y. Gao and L. Ge, Chin. J. Catal., 2023, 47, 161–170 CrossRef CAS.
- X. Shi, Y. Huang, R. Long, Z. Wang, L. Wang, J. Cao, G. Zhu and Y. Xiong, Natl. Sci. Rev., 2023, 11(2), 1 CAS.
- H. Qin, W. Zhang, Q. Zheng, P. Zhang, S. Zhang and X. Xu, J. Materiomics, 2023, 9, 882–891 CrossRef.
- S.-H. Liu and W.-X. Lin, J. Photochem. Photobiol., A, 2019, 378, 66–73 CrossRef CAS.
- C. Sun, J. Yang, M. Xu, Y. Cui, W. Ren, J. Zhang, H. Zhao and B. Liang, Chem. Eng. J., 2022, 427, 131564 CrossRef CAS.
- P. K. Mishra, S. K. Biswal and D. Sahu, Mater. Today: Proc., 2022, 68, 80–84 CAS.
- C. V. Reddy, R. R. Kakarla, J. Shim, R. R. Zairov and T. M. Aminabhavi, Environ. Res., 2023, 217, 114672 CrossRef CAS PubMed.
- Y. Liang, Z. Xiang, X. Zhao, F. Xiang, P. Yan, T. Yu, X. Li and Y. Yang, CrystEngComm, 2022, 24, 3865–3871 RSC.
- S. Shabna, S. S. J. Dhas and C. S. Biju, Catal. Commun., 2023, 177, 106642 CrossRef CAS.
- K. Bano, S. Kaushal, A. Kumar and P. P. Singh, Mater. Today Chem., 2022, 26, 101193 CrossRef CAS.
- V. H. Huong, V.-C. Nguyen, M. N. Ha, D. V. Pham, T. B. Nguyen, Y.-R. Ma, A. B. Ngac and T. T. Loan, Opt. Mater., 2023, 140, 113864 CrossRef CAS.
- Y. Liu, C.-H. Liu, T. Debnath, Y. Wang, D. Pohl, L. V. Besteiro, D. M. Meira, S. Huang, F. Yang, B. Rellinghaus, M. Chaker, D. F. Perepichka and D. Ma, Nat. Commun., 2023, 14, 541 CrossRef CAS.
- A. Holewinski, J.-C. Idrobo and S. Linic, Nat. Chem., 2014, 6, 828–834 CrossRef CAS.
- Y. Zhang, C. Liu, Y. Zhou, J. Wang, A. Li and P. F.-X. Corvini, Chem. Eng. J., 2023, 457, 140992 CrossRef CAS.
- W. Zhang, X. Li, S. Liu, J. Qiu, J. An, J. Yao, S. Zuo, B. Zhang, H. Xia and C. Li, ChemSusChem, 2022, 15, e202102158 CrossRef CAS PubMed.
- Y. Yang, S. Matsubara, L. Xiong, T. Hayakawa and M. Nogami, J. Phys. Chem. C, 2007, 111, 9095–9104 CrossRef CAS.
- X. Zhang, J. Zhao, S. Wang, H. Dai and X. Sun, Int. J. Hydrogen Energy, 2014, 39, 8238–8245 CrossRef CAS.
- T. H. N. Nguyen, T. D. Nguyen, M. T. Cao and V. V. Pham, Colloids Surf., A, 2020, 594, 124659 CrossRef CAS.
- D. Gogoi, A. Namdeo, A. K. Golder and N. R. Peela, Int. J. Hydrogen Energy, 2020, 45, 2729–2744 CrossRef CAS.
- J. Peng, T. Lu, H. Ming, Z. Ding, Z. Yu, J. Zhang and Y. Hou, Catalysts, 2019, 9, 1006 CrossRef CAS.
- H. Wang, Y. Sun, G. Jiang, Y. Zhang, H. Huang, Z. Wu, S. C. Lee and F. Dong, Environ. Sci. Technol., 2018, 52, 1479–1487 CrossRef CAS PubMed.
- T. Xiong, X. a. Dong, H. Huang, W. Cen, Y. Zhang and F. Dong, ACS Sustain. Chem. Eng., 2016, 4, 2969–2979 CrossRef CAS.
- M. Ran, W. Cui, K. Li, L. Chen, Y. Zhang, F. Dong and Y. Sun, Energy Environ. Mater., 2021, 5, 305–312 CrossRef.
- F. Dong, X. Xiao, G. Jiang, Y. Zhang, W. Cui and J. Ma, Phys. Chem. Chem. Phys., 2015, 17, 16058–16066 RSC.
- T. H. Huy, D. P. Bui, F. Kang, Y. F. Wang, S. H. Liu, C. M. Thi, S. J. You, G. M. Chang and V. V. Pham, Chemosphere, 2019, 215, 323–332 CrossRef CAS PubMed.
- L. Yang, J. Huang, L. Shi, L. Cao, H. Liu, Y. Liu, Y. Li, H. Song, Y. Jie and J. Ye, Appl. Catal., B, 2018, 221, 670–680 CrossRef CAS.
- V. Perumal, C. Inmozhi, R. Uthrakumar, R. Robert, M. Chandrasekar, S. B. Mohamed, S. Honey, A. Raja, F. A. Al-Mekhlafi and K. Kaviyarasu, Environ. Res., 2022, 209, 112821 CrossRef CAS PubMed.
- K. Ranoszek-Soliwoda, E. Tomaszewska, E. Socha, P. Krzyczmonik, A. Ignaczak, P. Orlowski, M. Krzyzowska, G. Celichowski and J. Grobelny, J. Nanopart. Res., 2017, 19, 273 CrossRef PubMed.
- X. Zhang, W. Zhang, Y. Xu and M. Jin, Front. Phys., 2020, 8, 616349 CrossRef.
- S. Oros-Ruiz, R. Zanella and B. Prado, J. Hazard. Mater., 2013, 263(Pt 1), 28–35 CrossRef CAS PubMed.
- P. Makula, M. Pacia and W. Macyk, J. Phys. Chem. Lett., 2018, 9, 6814–6817 CrossRef CAS PubMed.
- S. Bouhadoun, C. Guillard, F. Dapozze, S. Singh, D. Amans, J. Bouclé and N. Herlin-Boime, Appl. Catal., B, 2015, 174–175, 367–375 CrossRef CAS.
- M. Pisarek, M. Krawczyk, A. Kosinski, M. Holdynski, M. Andrzejczuk, J. Krajczewski, K. Bienkowski, R. Solarska, M. Gurgul, L. Zaraska and W. Lisowski, RSC Adv., 2021, 11, 38727–38738 RSC.
- S. Gubbala, H. B. Russell, H. Shah, B. Deb, J. Jasinski, H. Rypkema and M. K. Sunkara, Energy Environ. Sci., 2009, 2, 1302–1309 RSC.
- D. Mohanta, S. V. Gupta, V. Gadore, S. Paul and M. Ahmaruzzaman, ACS Omega, 2022, 7, 20357–20368 CrossRef CAS PubMed.
- A. M. Ferraria, A. P. Carapeto and A. M. Botelho do Rego, Vacuum, 2012, 86, 1988–1991 CrossRef CAS.
- C. Zhang, H. Hua, J. Liu, X. Han, Q. Liu, Z. Wei, C. Shao and C. Hu, Nano-Micro Lett., 2017, 9, 49 CrossRef PubMed.
- J. Li, M. Yang, Y. Li, X. Cheng, X. Zhang, Y. Xu, S. Gao, H. Zhao and L. Huo, Sens. Actuators, B, 2022, 361, 131703 CrossRef CAS.
- Z. Wu, Y. Wang, Q. Wu, X. Cheng, Q. Wang, Y. Yang, B. An, P. Wang and E. Xie, Appl. Surf. Sci., 2023, 614, 156223 CrossRef CAS.
- M. Eslamian, A. Salehi and E. Nadimi, Surf. Sci., 2021, 708, 121817 CrossRef CAS.
- M. Epifani, J. D. Prades, E. Comini, E. Pellicer, M. Avella, P. Siciliano, G. Faglia, A. Cirera, R. Scotti, F. Morazzoni and J. R. Morante, J. Phys. Chem. C, 2008, 112, 19540–19546 CrossRef CAS.
- Y. Tian, M. Kong, Z. Tao, C. Yang, S. Shang, Q. Gu, D. C. W. Tsang, L. Li and J. Shang, J. Hazard. Mater., 2023, 441, 129962 CrossRef CAS.
- K. Gelderman, L. Lee and S. W. Donne, J. Chem. Educ., 2007, 84, 685 CrossRef CAS.
- A. Hankin, F. E. Bedoya-Lora, J. C. Alexander, A. Regoutz and G. H. Kelsall, J. Mater. Chem. A, 2019, 7, 26162–26176 RSC.
- P. Zhang, Y. Jin, M. Li, X. Wang and Y.-n. Zhang, RSC Sustainability, 2023, 1, 622–630 RSC.
- H. Chen, G. Liu and L. Wang, Sci. Rep., 2015, 5, 10852 CrossRef CAS PubMed.
- S. Asaithambi, P. Sakthivel, M. Karuppaiah, Y. Hayakawa, A. Loganathan and G. Ravi, Appl. Phys. A: Solids Surf., 2020, 126, 3441–3448 CrossRef.
- S. H. Luo, Q. Wan, W. L. Liu, M. Zhang, Z. T. Song, C. L. Lin and P. K. Chu, Prog. Solid State Chem., 2005, 33, 287–292 CrossRef CAS.
- H. Ma, W. Yang, H. Tang, Y. Pan, W. Li, R. Fang, Y. Shen and F. Dong, J. Hazard. Mater., 2023, 452, 131269 CrossRef CAS PubMed.
- M. Wang, G. Tan, S. Feng, L. Yin, Y. Wang, B. Zhang, L. Lv and H. Ren, J. Hazard. Mater., 2021, 416, 125877 CrossRef CAS PubMed.
| This journal is © The Royal Society of Chemistry 2024 |

