
 Open Access Article
 This Open Access Article is licensed under a
 Creative Commons Attribution 3.0 Unported Licence
Antimicrobial activity of safe concentrations of ozone, hydrogen peroxide, and triethylene glycol in air and surfaces
Joan
Truyols-Vives
 abc,
Salut
Botella-Grau
d,
Josep
Mercader-Barceló
c and
Herme G.
Baldoví
*abc
abc,
Salut
Botella-Grau
d,
Josep
Mercader-Barceló
c and
Herme G.
Baldoví
*abc
aDepartamento de Química, Universitat Politècnica de València (UPV), 46022, Valencia, Spain. E-mail: hergarba@cam.upv.es
bInstituto de Tecnología Química CSIC-UPV, Universitat Politècnica de València (UPV), 46022, Valencia, Spain
cMolecular Biology and One Health Research Group (MolONE), Universitat de les Illes Balears (UIB), 07122, Palma de Mallorca, Spain
dDepartamento de Biotecnología, Centro Avanzado de Microbiología Aplicada (CAMA), Universitat Politècnica de València (UPV), 46022, Valencia, Spain
First published on 22nd April 2024
Abstract
Monitoring and control of indoor air hygiene has gained much interest since the COVID-19 pandemic because the airborne route is the main pathway for the spread of SARS-CoV-2 and other pathogens, making it necessary to develop strategies to mitigate airborne transmission of diseases. This work addresses indoor breathable air hygiene by proposing the “in situ” reduction of airborne microorganisms with the nebulization of low and safe concentrations of hydrogen peroxide (H2O2, 0.5 and 1 ppm), ozone (O3, 0.06 and 0.2 ppm), triethylene glycol (TEG, 17.1, 52 and 171.2 ppm), and their combinations. The antimicrobial activity was evaluated in an office room by assessing the viability of commercial extremophile sporulated bacteria and naturally present bacteria and fungi in surfaces and air. All three chemicals individually dispersed reduced the viability of sporulated bacteria and naturally occurring microorganisms. Binary combinations were more effective than individual agents in the case of the H2O2 and O3 mixture against sporulated bacteria, and the O3 and TEG mixture against airborne and surface bacteria. The ternary mixture was the most effective against commercial sporulated bacteria and airborne microorganisms. These results illustrate that the application of low and safe concentrations of antimicrobial compounds in indoor air could be an interesting strategy to reduce infection risk.
Environmental significanceOur work is a scientific answer to the question raised during the COVID-19 pandemic on how to treat indoor airborne droplets to stop disease transmission. To address this, we have studied the effectiveness of triethylene glycol (TEG) and breathable concentrations of O3 and H2O2 against surface and airborne microorganisms (commercial spore strips and naturally occurring bacteria and fungi) in a real environment. The disinfection mechanism was investigated applying a novel method to identify the generated radical species in air. We found that TEG aerosols were especially effective over fungi. The dispersion of the ternary mixture significantly reduced the viability of airborne bacteria and fungi. This strategy might be useful to reduce infection risk through the airborne route in indoors. |
1 Introduction
Indoor air is a natural reservoir of microorganisms that are present in small aqueous droplets suspended in air, termed bioaerosols.1 Human activities such as talking, sneezing, and coughing generate bioaerosols.2,3 In indoors, when agglomeration occurs, these actions increase microorganism populations. On average, a person breathes 14 m3 of air per day,4,5 this means that humans are daily exposed to many biological pollutants. Some of the airborne microorganisms, including bacteria, fungi, viruses, and resistant vegetative sporulated forms, can be causative etiological agents of infectious diseases,4,6–8 or even responsible for pandemic outbreaks such as the COVID-19.5,9–11 Thus, respiratory infections represent a global health problem that causes thousands of deaths and the loss of millions of economic sources every year.12–14 The identification and quantification of such agents is needed to assess the microbiological quality of indoor air and to estimate infection risk. In this context, fungi,15 bacteria16 and viruses, such as Influenza17 and SARS-CoV-2 (ref. 18–20), have been detected in indoors. In addition to the development of technologies to monitor airborne microorganisms, it is also necessary to develop safe and effective strategies to reduce the viability of indoor microbiota in hot spots (i.e. overcrowded spaces with poor ventilation or healthcare centres),14,21 thereby minimizing infection risk.Several technologies are currently available for infection control in the food industry, wastewater treatment and surface cleaning,6,7,22,23 while there is a lack of standardized protocols for disinfecting breathing air. Recently, researchers have focused on air treatment, by filtering or applying UV light, temperature, or others. In addition to them, the nebulization or dispersion of agents able to damage or destroy microorganisms in bioaerosols is a strategy with extensive possibilities. In this regard, there are several examples of chemical agents used to disinfect indoor environments. Some of the most used chemicals for this purpose are oxidant agents, such as HClO, O3, and H2O2, which are applied at high concentrations. For instance, concentrations higher than 200 ppm of O3 are used to manufacture sterile products,24 and H2O2 concentrations ranging between 2 and 60 ppm are used to sterilize and disinfect medical equipment and facilities.25 The antimicrobial efficacy of these compounds is due to their high oxidation capacity. As a drawback, exposure to high concentrations can cause strong irritability in the mucous membranes and lungs, limiting their application to non-occupied environments.24–26 The antimicrobial potential of such agents has not been explored at lower concentrations on airborne microbiota and they might reduce the indoor microbial load. In agreement with this hypothesis, low O3 concentrations (1.4 ppm) reduced the cell viability of pathogenic bacterial strains seeded on plates,27 while exposure to 0.5% H2O2 for a short period (5 minutes) was found to be virucidal and safe, since it was applied on persons without triggering acute inflammatory symptoms.28 Against SARS-CoV-2, O3 has been used to inactivate it in aerosols and fomites by using low concentrations, but above the limit of exposure.29 Specially for SARS-CoV-2, oxidant agents are capable of destroying the proteins and lipids present in the envelope and the nucleic acids.30–32
Another family of chemicals with antimicrobial properties are biopolymers of glycol derivatives. Specifically, the antimicrobial potential of triethylene glycol (TEG) was demonstrated against Influenza virus strains at high concentrations.33 The antimicrobial capacity of TEG could be due to its activity as a dehydrating agent.34,35 TEG was found to be non-toxic even when the atmosphere is saturated with TEG,33,36 and potential ecotoxicological effects are not reported.37 Some authors have found that polyethylene glycol (PG), which is very similar to TEG from the chemistry standpoint, increases the fluidity of the viral membrane showing a broad effect on enveloped viruses such as SARS-CoV-2.38 Moreover, as pure TEG is a dehydrating agent, it is reasonable to think that when TEG gets in contact with microorganism membranes, it will incorporate chemisorbed and physisorbed water molecules affecting arrangement of superficial proteins.
Furthermore, the combination of agents could increase the antimicrobial potential. In this regard, combinations of O3 with H2O2 have been tested,39 but using concentrations that are above the exposure limits (Table 1), thereby impeding the application in occupied indoor spaces. Other mixtures such as fogging hypochlorous acid solution and hydrogen peroxide solution have been tested against SARS-CoV-2 and influenza A virus, being more efficient when they used together, and it was found that SARS-CoV-2 was more resistant than Influenza A virus.40 More recently, mixtures of peroxyacetic acid and hydrogen peroxide solutions have been investigated for airborne disinfection against SARS-CoV-2, with encouraging results.40 The combination of antimicrobial agents with different mechanisms of action might allow a significant microbial reduction to be achieved without the need to raise the individual compound concentrations, thus allowing one to work even further away from the exposure limits of each compound. Although low concentrations of antimicrobial agents might be safe when applied separately, their behaviour must be analysed when applied in combination, including the formation of reactive oxygen species (ROS) by-products.
| Chemical | Regulatory organism | ppm | , mg m−1 | Reference |
|---|---|---|---|---|
| a The PELs (Permissible Exposure Limits) are 8 hours TWA (time-weighted average concentration). b The RELs (Recommended Exposure Limits) are 10 hours TWA. c The TLVs (Threshold Limit Values) are 8 hours TWA. d The EELVs (Environmental Exposure Limit Values for Daily Exposure) are for heavy, moderate or light work for less than 2 hours. e Parts of vapor or gas per million parts of contaminated air by volume at 25 °C and 760 torr. f Milligrams of substance per cubic meter of air. OSHA: Occupational Safety and Health Administration. NIOSH: National Institute for Occupational Safety & Health. ACGIH: American Conference of Governmental Industrial Hygienists. INSST: Instituto Nacional de Seguridad y Salud en el Trabajo. | ||||
| Hydrogen peroxide (H2O2) | OSHA PELa | 1 | 1.4 | 41 |
| NIOSH RELb | 1 | 1.4 | 42 | |
| ACGIH TLVc | 1 | 1.4 | 43 | |
| Ozone (O3) | OSHA 15 min exposure | 0.3 | 0.6 | 44 |
| ACGIH EELV-DEd | 0.2 | 0.4 | 45 | |
| INSST EELV-DEd | 0.2 | 0.4 | 46 | |
| Triethylene glycol (TEG) | OSHA PELa | — | — | — |
| NIOSH RELb | — | — | — | |
| ACGIH TLVc | — | — | — | |
The antimicrobial activity of TEG, H2O2 and O3 has been evaluated mostly only under controlled conditions inside small and airtight chambers.27,39,47,48 However, the results can differ when experiments are carried out in a real scenario. Thus, in the present work, we have analysed the chemical behaviour and the antimicrobial activity of the nebulization of low and safe concentrations of TEG, H2O2 or O3, and their mixtures over commercial sporulated bacteria and naturally occurring bacteria and fungi in surfaces and in the air of a real scenario.
2 Materials & methods
2.1 Chemical compounds and equipment
The chemical compounds assayed were H2O2 (30% w/w, Scharlau), TEG ReagentPlus® (99%, Sigma-Aldrich), and O3 gas. The chemical reagents to measure TEG and H2O2 in air were sulphuric acid (H2SO4 95–97%, J. T Baker), potassium dichromate (K2Cr2O7 99%, Sigma-Aldrich), potassium titanium oxide oxalate dihydrate (C4H2K2O9Ti·2H2O, Sigma-Aldrich) and nitric acid (HNO3 68–70%, Scharlau). 5,5-Dimethyl-1-pyrroline N-oxide (DMPO, Sigma-Aldrich) and 2,2,6,6-tetramethylpiperidine (TEMP, Sigma-Aldrich) were used to determine radicals in air.A GX500-EB ozone generator (ZonoSistem) and SM-41 ozone detector-controller (ZonoSistem) were employed to generate and measure O3, respectively. A Turbo-E 125 duct Fan (Blauberg Ventilatoren) was used to disperse the nebulized compounds through the room. A Microfogger 2-RC (Vosentech LLC) and LZ1500 Fog machine (LightSide) were used to nebulize TEG with the help of the turbo fan. A LKT170 Professional Nebulizer “NIXY Pro” (Moretti Spain) was employed to nebulize H2O2.
2.2 Chemical nebulization
Nebulization assays were performed in an office room as a model of a poorly ventilated indoor space. Dimensions of the room were 5.15 m × 3 m × 2.45 m with approximately 37.85 m3. The door and the window were closed while the assay was running. However, the room was not airtight as it was connected to the usual building ventilation system. Compounds were liberated at a height of 0.5 m from the ceiling, in a room corner and using a tube fan that recirculates the air. After reaching the desired airborne concentrations, compound concentrations were kept constant for 30 min.2.2.1.1 TEG. To study the antimicrobial activity of TEG, 0.8 mL or 2 mL of pure TEG liquid was nebulized with the Microfogger 2-RC at a flow rate of 0.24 g min−1. Larger quantities of TEG (6.5 mL) were nebulized with the LZ1500 Fog machine in 5 seconds. We observed that TEG aerosols were homogenized throughout the room after approximately 5 min. TEG concentration in the air was measured by passing 2 L of air though a gas trap charged with a TEG reactive solution, which was prepared with 0.068 M K2Cr2O7 dissolved in 1 M H2SO4. TEG concentration was controlled by weighing the amount of TEG before and after nebulization to maintain a stable airborne concentration.
2.2.1.2 O3. Dosage of O3 into the room was kept in the desired concentrations with continuous dosage using the SM-41 ozone detector-controller that measures and responds to real time O3 concentration. The O3 sensor was placed at 3.8 m distance from the O3 generator, and at 1.6 m height. O3 concentration was also measured with a personal gas detector WatchGas UNI O3 (Casella) with a working range of 0 to 5 ppm, for double checking. O3 was nebulized to achieve a concentration of 0.06 ppm and 0.2 ppm. The antimicrobial assay started when the O3 levels were stabilized and then were kept stable for 30 min.
2.2.1.3 H2O2. The procedure to nebulize H2O2 varied depending on the air concentration we wanted to reach. To reach 0.06 ppm, the H2O2 nebulizer was charged with 5 mL of 10% (w/w) H2O2 solution pH 5.4 until reaching 0.5 ppm. Then, it was turned off for ten minutes, switched on for ten minutes, and finally turned off for the last ten minutes of the assay. To reach 1 ppm, a 20% (w/w) H2O2 pH 5.4 solution was charged and continuously nebulized for 30 min. H2O2 concentration was measured with a colorimetric method by passing 28 L of air through a gas trap with a N86 LABOPORT Pump (KNF). The gas trap was filled with a 1
![[thin space (1/6-em)]](https://www.rsc.org/images/entities/char_2009.gif) :1 mixture of H2O2 detection solution and deionized water. A 0.5 L stock H2O2 detection solution was prepared by dissolving 200 mg (0.625 mmol) C4H2K2O9Ti·2H2O in a mixture of 14.5 mL of 95–97% H2SO4, 1 mL of 68–70% HNO3 and deionized water. The colorimetric method consisted of adding the “trapped liquid” in quartz cuvettes (Friedrich & Dimmock, Inc.) and measuring absorbance at 400 nm with a V-650 Spectrophotometer (Jasco).
:1 mixture of H2O2 detection solution and deionized water. A 0.5 L stock H2O2 detection solution was prepared by dissolving 200 mg (0.625 mmol) C4H2K2O9Ti·2H2O in a mixture of 14.5 mL of 95–97% H2SO4, 1 mL of 68–70% HNO3 and deionized water. The colorimetric method consisted of adding the “trapped liquid” in quartz cuvettes (Friedrich & Dimmock, Inc.) and measuring absorbance at 400 nm with a V-650 Spectrophotometer (Jasco).
2.2.2.1 O3 + TEG. First, 0.2 ppm O3 was reached, and then 2 mL of TEG was evaporated.
2.2.2.2 O3 + H2O2. After reaching 0.2 ppm O3, H2O2 (20% w/w, pH = 5,4) solution was nebulized for 10 minutes until achieving 1 ppm concentration.
2.2.2. 3H2O2 + TEG. First, 1 ppm H2O2 was reached, and then 2 mL of TEG was evaporated.
2.3 In situ antimicrobial assays
0.1 m3 of air was sampled immediately before the nebulization of the compounds of interest and 30 min after reaching the desired concentrations. The antimicrobial assays were performed in May in the city of Valencia (Spain). Room temperature and humidity were monitored before and after each nebulization and were, on an average, 25 °C and 50 to 60% relative humidity. The culture of microorganisms was carried out following the national standard indications: UNE EN-ISO 4833-1:2013, UNE EN-ISO 4833-2:2013, UNE EN-ISO 7218:2008 and UNE EN-ISO 8199:2018.49–52
Air samples were collected with an Air Sampler SAS-Super100 (InstruLab S.C.) at a flow rate of 100 L min−1. The SAS sampler collects particles by impacting through a Petri dish containing Plate-Count (01-161-500, Scharlau) for bacteria, or Sabouraud (01-165-500, Scharlau) with Chloramphenicol Selective Supplement (06-118LYO1, Scharlau) for fungi and yeast. Surface samples were collected on a table at two points located at 2 and 4 m from the nebulizer. One rodac plate of Sabouraud and one rodac plate of plate-count were used to sample, respectively, fungi and bacteria by surface contact. These zones were cleaned and disinfected the night before each assay. Rodac plates and Petri dishes were incubated at 30 ± 1 °C for 48–120 h ± 3 h. The colonies from air and surface samplings were counted manually with a colony counter. The results were given in percentage of reduction relative to the number of colonies arising from the samplings performed before the compound nebulization.
The assays with sporulated bacteria were performed using four spore strips containing a known quantity of Geobacillus stearothermophilus (Gke Steri-Record®). The strips were placed at a 1.7 m-height and at 3 m distance from the nebulization equipment. After the compound nebulization, the spore strips were introduced in tubes containing the spore culture media. The samples were mixed by vortexing for 5 minutes, sonicated for 10 minutes and, mixed for another 5 minutes to detach spores from the strips. The samples were incubated in a water bath at 85 °C for 1 minute. Under aseptic conditions, two dilutions were made from each tube. 100 mL of spore culture media dilutions were added to Petri dishes containing agar-dextrose-tryptone media (Difco) and spread with a Drigalsky handle to homogenize the bacteria through the Petri dishes. The dilutions were seeded in duplicate and incubated at 55 °C for 24–48 h. The colonies were counted manually with a colony counter and results were given in colony-forming unit per mL (CFU mL−1).
2.4 Determination of radical species in air
The formation of airborne radicals was measured by nebulizing 0.2 ppm O3, 1 ppm H2O2, or the combination of both. Liquid-phase Electronic Paramagnetic Resonance (EPR) measurements were carried out using DMPO and TEMP as spin traps. Briefly, stock aqueous solutions of DMPO and TEMP (both at 1 mg mL−1) were prepared and, sequentially, 20 mL of each solution was introduced into the air trap. After 15 minutes of nebulization, we assumed that the airborne concentration of the chemical agents was stabilized, and then an air flow of 5.3 L min−1 was induced with a N86 LABOPORT Pump for 5 min through the air trap charged with each solution. The samples were introduced into a vial where they were purged with argon for 5 minutes. A 5 mL aliquot was taken and measured on a Bruker EMS spectrometer (9.803 GHz, 3489.9 G scanning width, 40.95 ms time constant, 100 kHz modulation frequency, 1 G modulation width and 19.92 mW at 100 kHz microwave power).2.5 Statistical analysis
Graphical representations and statistical analyses were performed using GraphPad Prism 8. Data were represented as mean ± standard error of the mean (SEM). Significant differences were determined by two-way ANOVA followed by the Bonferroni multiple comparison test and by Student's t-test. Differences were considered significant at P < 0.05 (*) and P < 0.005 (**).3 Results and discussion
3.1 Environmental analysis of compound dosing
The compounds were nebulized and dispersed using a tube fan that projects an air stream parallel to the ceiling, and at the same time, induces recirculation of room air, helping to achieve a better homogenization of the chemicals. The chemicals were introduced in different ways: O3 gas was generated “in situ”, while pure TEG and H2O2 were dispersed as aerosols.Before proceeding with the antimicrobial experiments, the dispersion dynamics of the compounds were studied. For this purpose, the tube fan with the different dispensers was positioned in a corner of the office at different heights. The experiment was performed with all three chemicals but only the concentrations of H2O2 and O3 were easier to follow using the different sensors. When this experiment was performed with TEG, its distribution was assessed qualitatively by observing the light scattering produced by the TEG aerosols. Differences in the concentration of the chemicals were observed depending on the dosing height (Table 2). At 1.5 m height the air pressure pushed aerosols and gases downward, hampering the concentration homogenization (Fig. 1a). Even with TEG, gradients of light scattering were found to be denser at lower heights. In contrast, by projecting the aerosols at 2.5 m height, the chemicals were able to travel longer distances before landing on the walls, and a more homogenous dispersion was achieved for all chemicals (Fig. 1b). We attributed the better homogenization to the Coandă effect, in which fluids adhere to surfaces as they flow, in our case to the ceiling and walls. According to these results, the nebulization of the chemicals was set at a 2.5 m height for the antimicrobial assays.
| Nebulization height (m) | Sampling height (m) | [O3] ppm | [H2O2] ppm |
|---|---|---|---|
| 1.5 | 2.6 | 0.45 | 0.33 |
| 1.6 | 0.2 | 1.6 | |
| 0.4 | 0.06 | 2.18 | |
| 2.5 | 2.6 | 0.25 | 1.3 |
| 1.6 | 0.2 | 1 | |
| 0.4 | 0.18 | 0.9 |
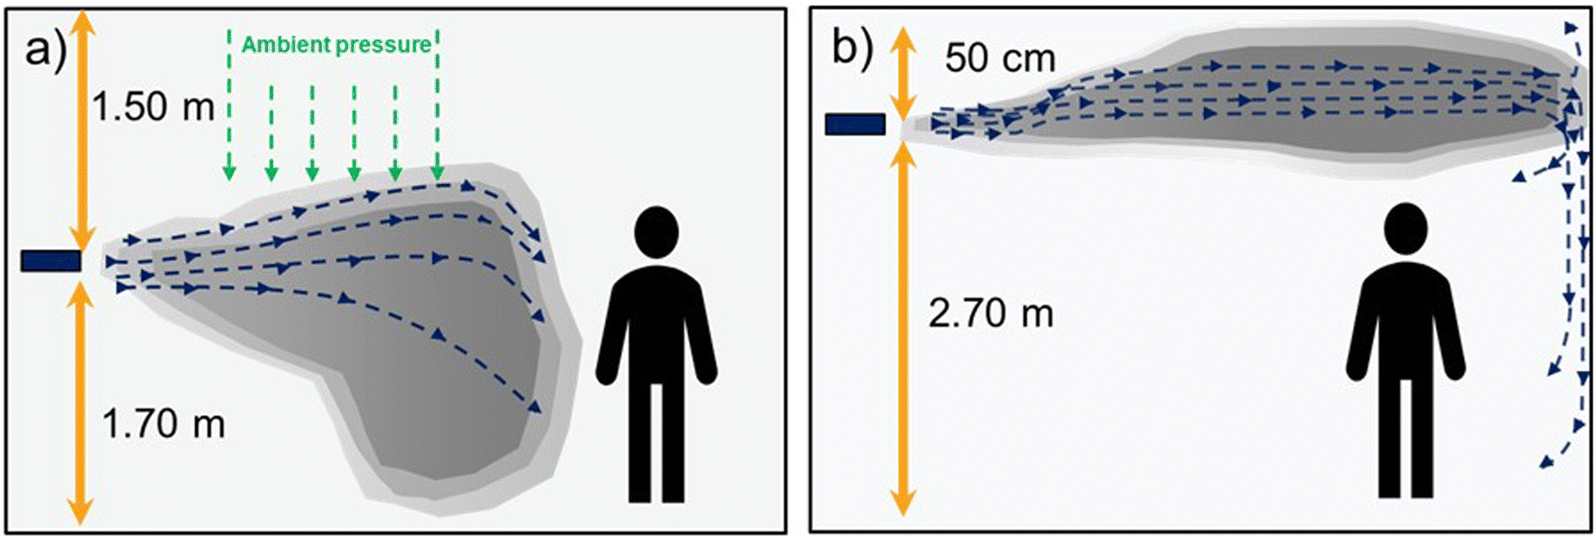 | ||
| Fig. 1 Comparison of dosing O3 gas, H2O2, or TEG aerosols into the office room at (a) a medium height of about 1.5 m (without the Coandă effect), and (b) at 50 cm from the ceiling (at a height of 2.5 meters) with the Coandă effect. | ||
Relative humidity is an environmental factor that influences microbial survival and proliferation. Therefore, we analysed the effect of compounds alone and combined at the concentrations selected to test the antimicrobial activities at relative humidity (Table 3).
| Chemical | Redox potentiala | Lifetimeb | Concentration in the airc | Relative humidity changed | Concentration decreasee |
|---|---|---|---|---|---|
| a Volts at 25 °C in a vacuum. b Stability of pure TEG in the liquid phase, O3 in air and H2O2 in 30% w/w aqueous solution. c Concentration in ppm. d HR change measurement was done straightaway after stopping fogging. e Measured 10 minutes after stopping nebulization. f In water solution53 g In the gas phase.54 h In aqueous solution.55,56 | |||||
| TEG | — | Years | 52 | −6% | <5% |
| 172 | −21% | ||||
| O3 | 2.07 | From minutes in waterf or to several minutes in airg | 0.2 | −10% | 87% |
| H2O2 | 1.78 | Monthsh | 1 | + 5% | 48% |
| O3 + TEG | — | — | 0.2 + 52 | −17% | — |
| TEG + H2O2 | — | — | 52 + 1 | −3% | — |
| O3 + H2O2 | — | — | 0.2 + 1 | −3% | — |
The stability of the chemical concentrations in air was assessed 10 min after stopping the 30 min nebulisation (Table 3). We found out that TEG concentration loss was minimum. The case of O3 was the opposite since the concentration rapidly dropped. This could be explained by its short lifetime of about few minutes in water57,58 and hours in the gas phase.59,60 As indicated by the high redox potential (Table 3), when O3 meets any kind of surface or water aerosols, the gas rapidly reacts. O3 is rapidly decomposed in water solution as the temperature, pH and stirring speed increase.53 The decomposition rate of O3 in air is fast in indoor living areas because of the presence of objects and furniture that accelerate O3 decomposition.54 On the other hand, H2O2 aerosols showed an intermediate stability. The slightly acidic pH4,5 of the solution we used could influence the stability of the molecule in air.56,61–64 Thus, alkaline solutions promote decomposition of H2O2 due to the increase of hydroxyl anions in solution, or even due to the deprotonation of H2O2 itself. Another factor that it should be considered is high temperature, which could enhance H2O2 degradation. However, as our working conditions are under 30 °C, herein the influence of this factor could be minor. In our case, the concentration drop could be mainly due to the impregnation into any type of surfaces, such as furniture, and the eventual fall of the heavier aerosols to the ground. Finally, a fact to be considered is the disappearance of 95% of TEG aerosols after 30 minutes when the three chemicals were dosed at the same time. This fact could be due to TEG degradation since it has been exposed to different reactive oxygen species (ROS) that eventually could completely degrade TEG to H2O and CO2.
3.2 Antimicrobial assays
The antimicrobial assays were conducted using commercial extremophile sporulated bacteria, and then with naturally occurring indoor airborne and surface bacteria and fungi. The antimicrobial activities of the three chemical compounds and their mixtures were evaluated using concentrations that did not present adverse effects on human health upon long-time exposure. As the purpose of this work is to study the suitability of safe concentrations and eco-friendly chemicals to reduce natural bacteria and fungi populations in occupied spaces, the concentrations of H2O2 and O3 were selected according to the guidelines of the INSST, NIOSH, ACGIH and OSHA, see Table 1. Following these criteria, we selected 0.2 ppm O3 and 1 ppm H2O2. International OSHA organism establishes a maximum safety exposure limit of 15 minutes at 0.3 ppm O3,44 while INSST proposes a 0.2 ppm limit exposure for a time period of less than two hours.46 Accordingly, we limited the O3 concentration to 0.2 ppm for 30 min. For H2O2, both organizations establish a limit of 1 ppm concentration54 per hour, so we limited H2O2 concentration to 1 ppm for 30 min. Moreover, lower concentrations of both chemicals were also tested to gain a better insight into their antimicrobial potential.The selection of TEG concentration was not based on the guidelines since there is no defined airborne toxic concentration. However, we limited the TEG concentration to 171.2 ppm because higher quantities affect visibility.
The results in Fig. 2 show the viability reduction of G. stearothermophilus spores with different concentrations of the chemical compounds applied individually and combined. The nebulization of the lowest concentrations of the oxidant agents reduced the quantity of viable G. stearothermophilus, an effect that was dose-dependently enhanced. The most effective concentrations of oxidant agents were 0.2 ppm O3 and 1 ppm H2O2, achieving around 48% and 35% reduction, respectively (P = 0.025* and P = 0.016*, respectively). The increase of time exposure or concentration may result in a higher reduction, as was demonstrated by Andersen et al., who completely eliminated the spore population contained in commercial strips located in rooms using up to 42 ppm of H2O2 for longer periods than 30 min.25 However, the use of such high doses precludes the presence of persons during nebulization.
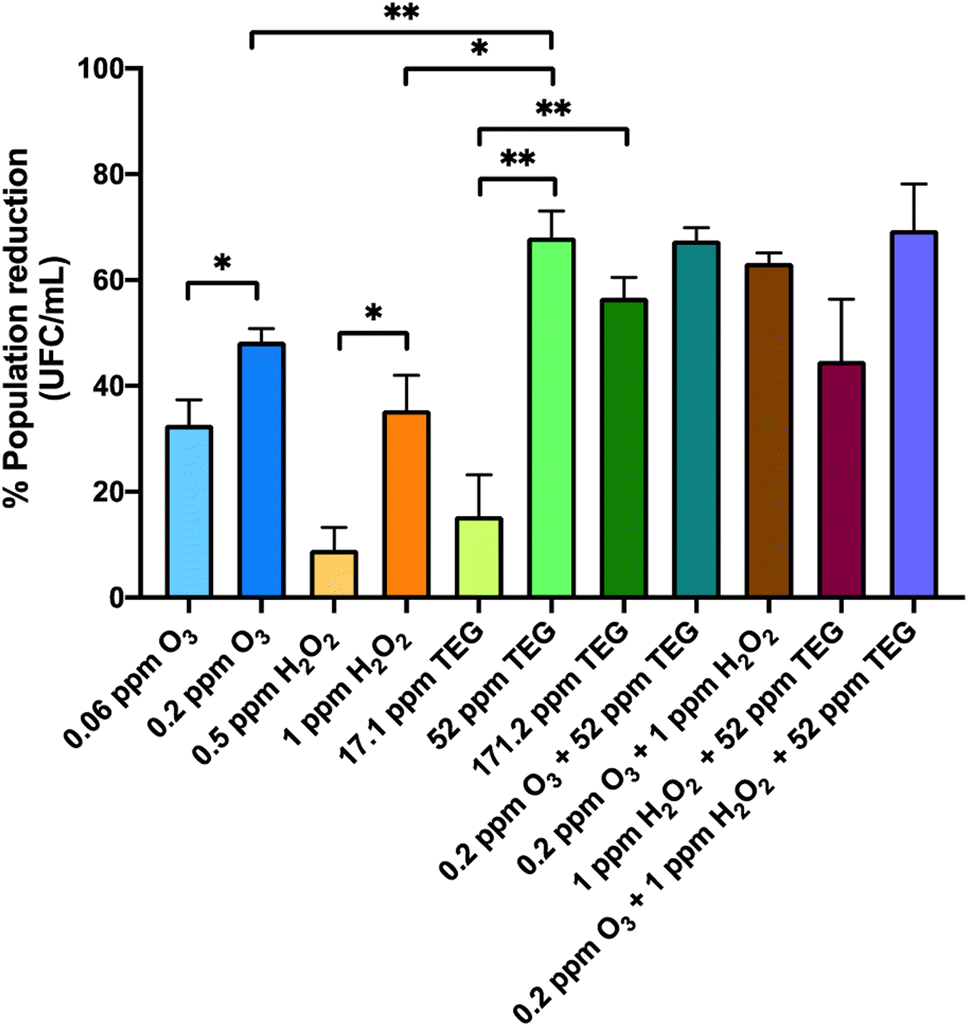 | ||
| Fig. 2 Percentage of viability reduction of sporulated G. stearothermophilus after 30 minutes exposure to TEG, O3, H2O2, or their combinations. Plots represent percentage of reduction relative to the spore strips processed before the nebulization of any compound. Error bars indicate SEM. n = 3, 4 or 8 per group. Significant differences were obtained by an unpaired two-tailed t-test *P < 0.05, **P < 0.005. | ||
The nebulization of TEG at 52 and 171.2 ppm led to a viability reduction of 68.1% and 56.7%, respectively, which were significantly higher compared to the 15.3% of reduction using 17.1 ppm (P = 0.001** and P = 0.005**, respectively). The nebulization of 52 ppm was the most effective TEG concentration and presented no significant differences compared to the highest concentration. Furthermore, 52 ppm TEG presented a higher viability reduction compared to 1 ppm H2O2 or 0.2 ppm of O3 (P = 0.008** and P = 0.012*, respectively). The efficacy of TEG aerosols to reduce G. stearothermophilus spore viability could be due to their dehydration capacity,34,35 which somehow could inhibit the rehydration of the spores, showing an advantage compared to oxidant agents.
Afterwards, G. stearothermophilus spores were exposed to the combination of two and three compounds. Jeong et al. used a combination of H2O2 and O3 at higher concentrations to obtain a complete disinfection in a chamber containing bacterial spore discs.36 In our case, the combination of 0.2 ppm O3 and 1 ppm H2O2 led to a 1.3- and 1.8-fold enhancement compared to the individual O3 and H2O2 nebulisations, respectively. The viability reduction of the combination of 52 ppm TEG with 0.2 ppm O3 was not different (67.5%) from the reduction produced by TEG alone, while the combination of 52 ppm TEG with 1 ppm H2O2 resulted in a lower reduction (44.7%) as compared to individual TEG. This result could be explained by the hydration of TEG aerosols by H2O2 aqueous solution, and glycol-derived molecules act as stabilizers of H2O2, limiting its oxidation potential.65,66 The most efficient combination in reducing G. stearothermophilus viability was the ternary mixture (69.5%), but this was not different from the binary TEG alone or in binary combination.
The fact that the viability reduction was not higher than 70% in any case may be, in part, related to how G. stearothermophilus spores are deposited in the strip. The spores are piled up on top of each other and this fact, together with the mild experimental conditions of atmospheric pressure and low concentrations of chemicals, makes it difficult to reach the spores deposited at the bottom of the dry drops. It should be pointed out that these commercial spores are prepared to guarantee disinfection efficacy in sterilization autoclaves where high pressures and temperatures are used.
Remarkably, the chemical compounds reduced a bacterial form of resistance even at low doses.67,68 This result strongly suggests that low doses of the selected compounds could also eliminate significant quantities of vegetative cells and other less resistant microorganisms.
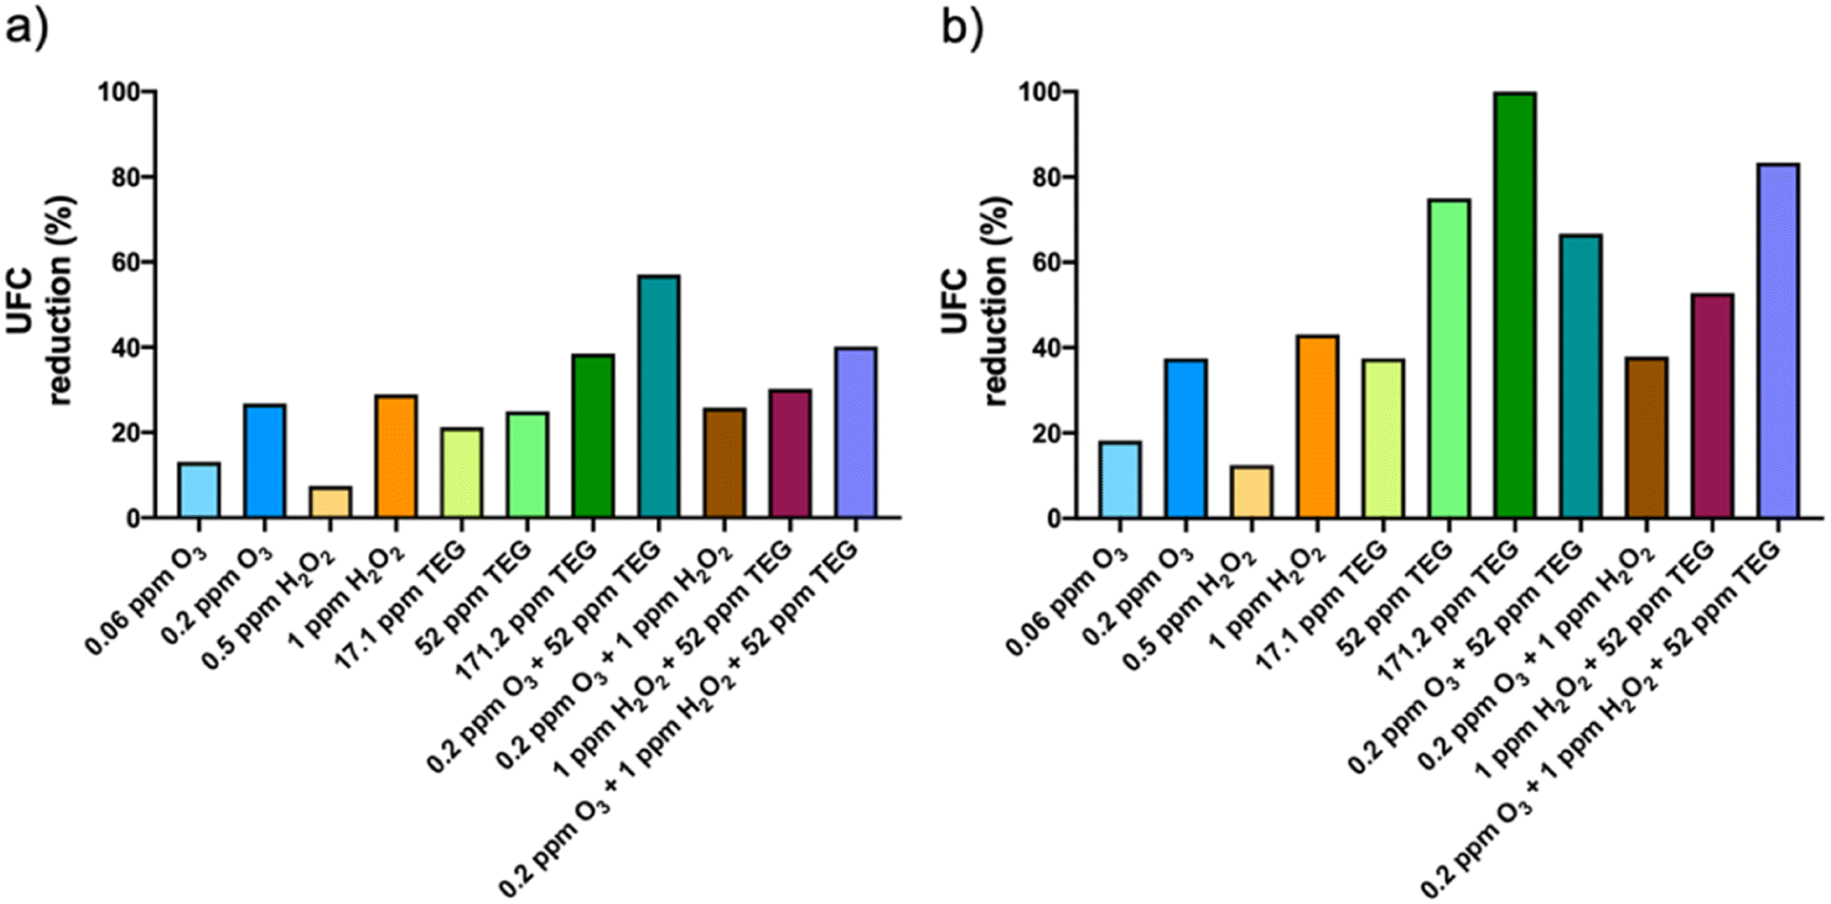 | ||
| Fig. 3 Percentage of UFC reduction of (a) bacteria and (b) fungi over surfaces with triethylene glycol (TEG), ozone (O3) and hydrogen peroxide (H2O2) nebulized individually and combined. Plots represent percentage of reduction relative to the bacteria and fungi present before the nebulization of the compounds. | ||
Surface fungi were found to be more sensitive to the selected chemicals than bacteria. As shown in Fig. 3b, the viability reduction produced by 0.2 ppm O3 and 1 ppm H2O2 was 37.5% and 43.1%, respectively. As in bacteria, TEG alone showed a higher antimicrobial activity than the oxidant agents, reaching 75% and 100% reduction with 52 ppm and 171.2 ppm TEG, respectively. The binary TEG combinations did not increase the antifungal effect of TEG dispersed alone. The combination of 0.2 ppm O3 with 1 ppm H2O2 did not increase the antifungal effects of the individual compounds either. The viability reduction of surface fungi was increased by combining O3, H2O2 and TEG (83.4%) compared to all the binary mixtures, although such effect was lower than that produced by TEG alone.
The antimicrobial effects obtained by the oxidant agents are modest compared to those presented in other studies that were designed for disinfection purposes, in which higher concentrations or longer time exposures were used.24–26,29,47 Despite that a complete viability reduction was not achieved in our study, a partial viability reduction of pathogenic microorganisms may entail a substantial reduction of infection risk. Moreover, the antimicrobial effects presented here could be further increased by extending the exposure time and/or combining with other antimicrobial agents as long as the experimental conditions are in agreement with the regulatory framework.
The differences in the antimicrobial activity between the binary TEG combinations could be explained in terms of solubility. While O3 was dispersed pure in the gas phase, H2O2 aerosols are made from a water solution. Since water has a higher solubility than O3 in TEG aerosols, H2O2 could react disintegrating them. In this way, O3 and TEG will take longer to react compared to H2O2 and TEG mixtures. In this sense, O3 and TEG could work freely by promoting oxidation and dehydration for longer periods of time. That could explain why TEG combined with O3 has shown more optimal results.
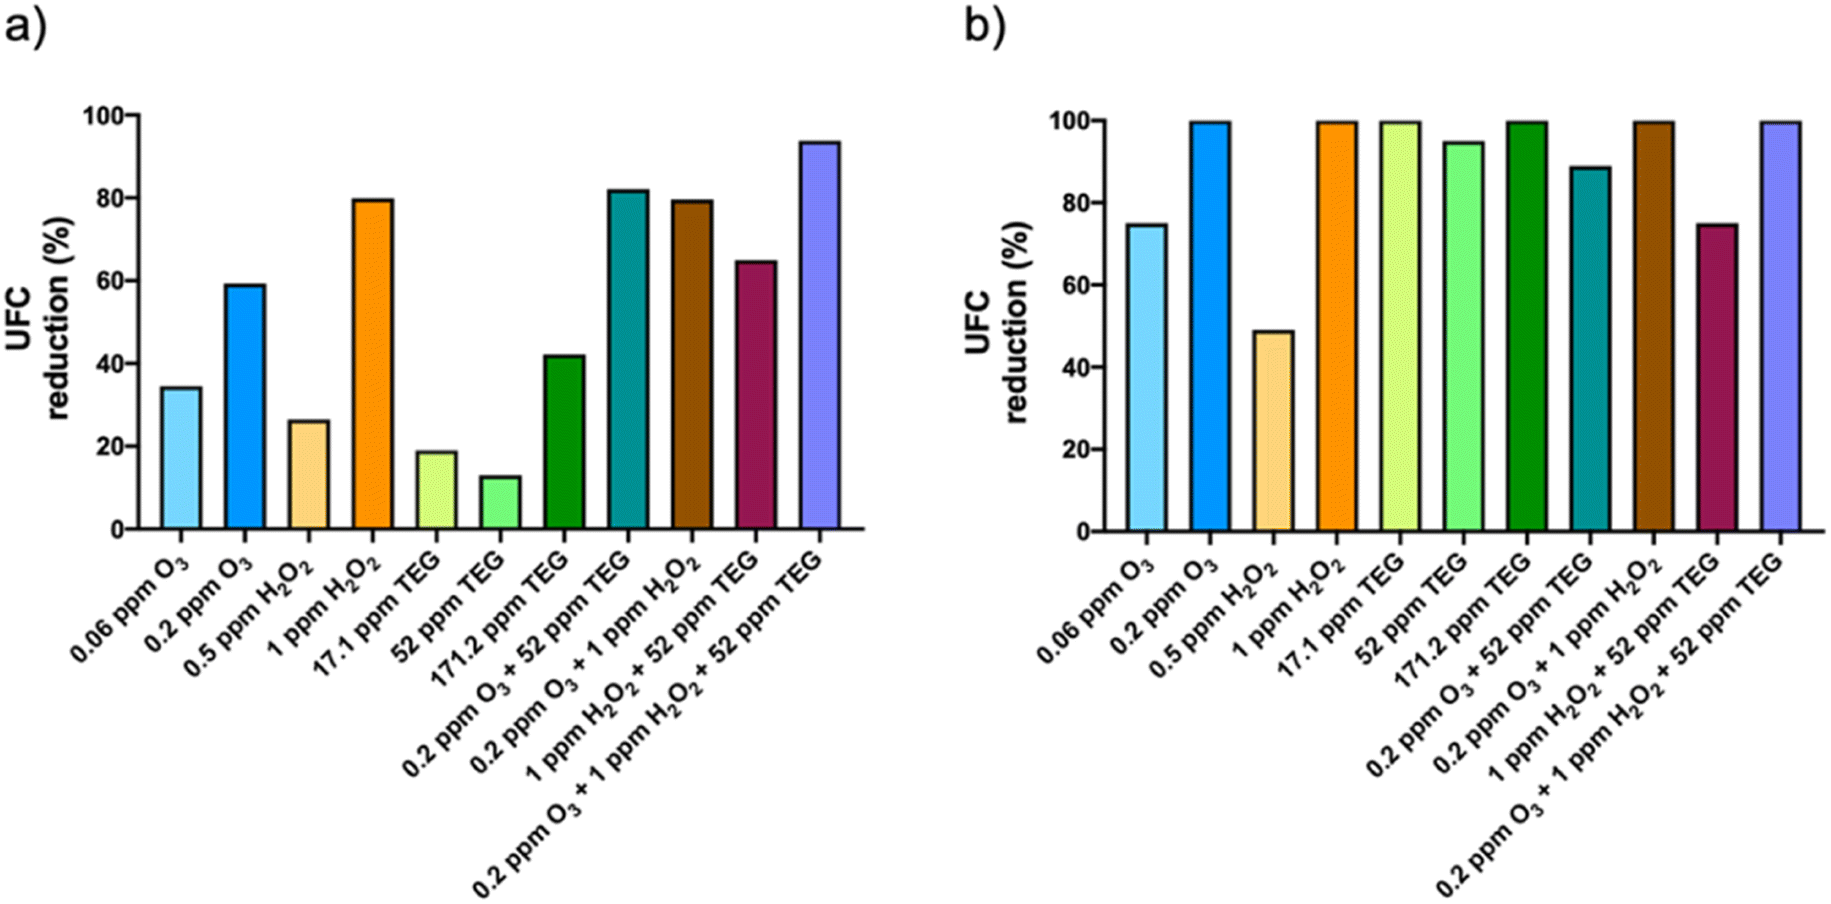 | ||
| Fig. 4 Percentage of UFC reduction of airborne (a) bacteria and (b) fungi with triethylene glycol (TEG), ozone (O3) and hydrogen peroxide (H2O2) nebulized individually and combined. Plots represent percentage of reduction relative to the bacteria and fungi present before the nebulization of the compounds. | ||
Airborne fungi were more sensitive to the tested chemicals than bacteria (Fig. 4b). In fact, the reduction of the fungal population was 100% with the highest O3 and H2O2 concentrations nebulized individually. 52 and 171.2 ppm TEG reduced the fungal population by 95% and 100%, respectively. The combinations of 52 ppm TEG with 0.2 ppm O3 and 0.2 ppm O3 with 1 ppm H2O2 resulted in 88.9 and 100% reduction of the fungal population, respectively, while the 1 ppm H2O2 with 52 ppm TEG was the binary combination that presented the lowest antifungal activity (75%). Finally, the ternary combination resulted in a 100% reduction of the fungal population.
In summary, our work shows that the ternary mixture of O3, H2O2 and TEG reduces the viability of more than 90% of the airborne microorganisms, an effect that was higher than that produced by the chemicals nebulized alone or in binary mixtures.
Our study presents several limitations. First, we mentioned that the assays were performed in a real scenario in which, however, some conditions were controlled, such as the lack of active ventilation. In real-life conditions, doors and windows are regularly opened and closed, and the air recirculation system and air conditioning units are working. In this case, the concentration of the nebulized chemical compounds will fluctuate and be diluted. Second, the concentrations of CO2, particulate matter, and volatile organic compounds, among other indicators of air ventilation were not measured. The collection of these data would have been useful in the context of this study. Finally, not all the bacteria and fungi species present in the room could be identified, whereas viruses were not analysed. The analysis on a broader range of microorganisms will provide a more complete picture of the antimicrobial potential of the candidate compounds. Future studies addressing the antimicrobial potential of safe concentrations of candidate compounds should consider these recommendations.
3.3 Chemical analysis of the nebulized compounds
The typical molecular spin probe used in chemistry to identify the presence of singlet oxygen species is TEMP, which reacts forming the TEMPO (2,2,6,6-tetramethylpiperidin-1-yl)oxyl) adduct that can be identified by EPR spectroscopy.71,72 Nebulization of H2O2, O3 and H2O2 + O3, showed the same EPR spectrum shape, containing three peaks at 3464, 3482 and 3497 G with intensity peak ratios of 1:1:1. In the literature, this characteristic TEMP signal is usually assigned to a TEMPO adduct that is formed when singlet oxygen is present in the sample.73,74 In summary, these results indicate that the concentration of singlet oxygen increases, while H2O2 and O3 are decomposed. Since all samples were measured with the same experimental conditions, it is possible to estimate that O3 nebulization generates twice the amount of singlet oxygen in comparison to H2O2 nebulization. The nebulization of both oxidating agents at the same time produces an increase in singlet oxygen concentration, however, its concentration is not significantly increased as it could be expected, meaning that the mixture of these compounds follows another chemical pathway.
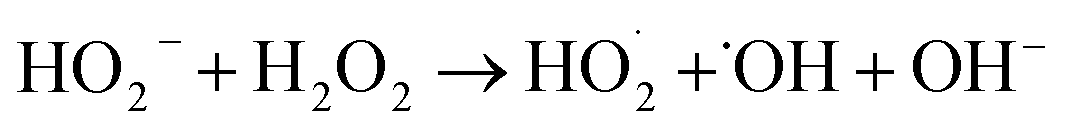
Additionally, DMPO was utilized as a spin probe to determine other oxygen-derived radical species. In the case of O3, the EPR spectrum shows the appearance of 7 peaks that should correspond to the formation of more than one derived DMPO adduct (Fig. 5b). According to the literature, the 7 peaks could be grouped into two groups: the first one is formed by the 4 smaller peaks (3460, 3474, 3488 and 3503 G) with intensity ratios 1:2:2:1 corresponding to the presence of the 2,2-dimethyl-5-hydroxy-1-pyrrolidinyloxy (DMPO-OH) adduct, and the second formed by the 3 bigger peaks (3465, 3480 and 3495 G) with ratios of 1:1:1 that corresponds to the overoxidized 5,5-dimethyl-2-oxo-pyrroline-1-oxyl (DMPOX).75 The DMPO-OH adduct is produced when DMPO is exposed to hydroxyl radicals. This fact confirms that O3 also degrades to hydroxyl radicals probably by reacting with water molecules present in air. This interpretation agrees with the humidity reduction induced by O3 nebulization in Table 2. Accordingly, the exposure of DMPO solutions to a highly oxidative environment, for example the presence of O3 or singlet oxygen at the same time, overoxidized them to DMPOx.75
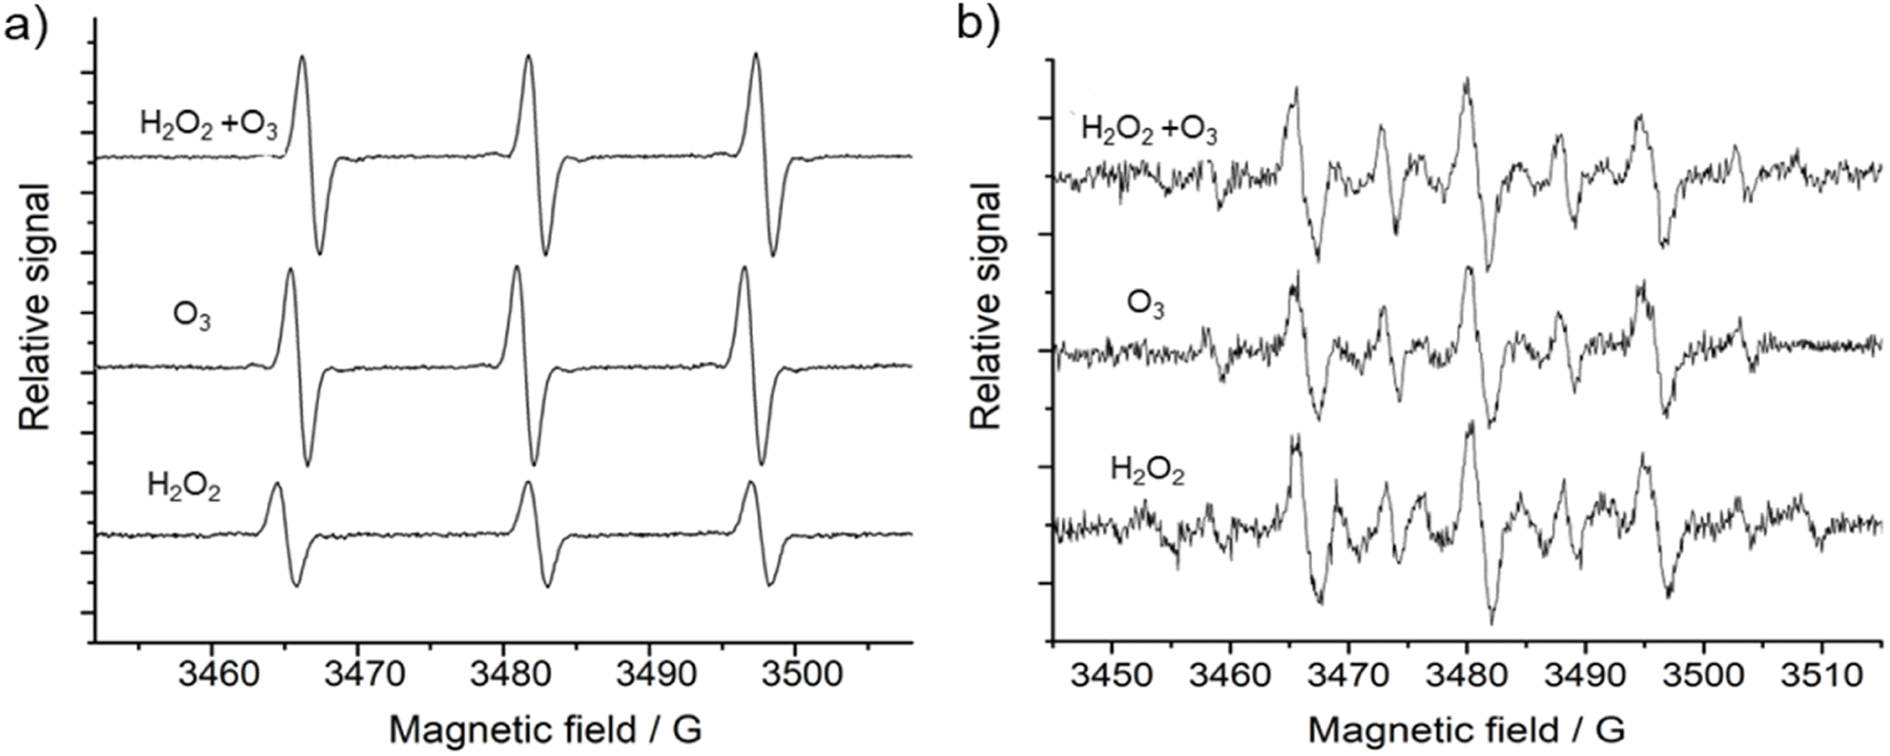 | ||
| Fig. 5 EPR experimental spectra utilizing TEMP (a) or DMPO (b) as radical probes. | ||
However, when DMPO is exposed to H2O2 aerosols, the EPR spectrum shows significant differences compared to the exposure to O3 (Fig. 5). Herein, the EPR spectrum of the H2O2 sample shows 13 peaks instead of 7 found in the case of O3. This new group of peaks means that an additional DMPO adduct has been produced. In this way, the 13 peaks have to be grouped into three different group peaks, corresponding to DMPO-OH and oxidized DMPOx, and the third group of peaks, with an intensity ratio of 1:1:1:1:1:1, is associated with the formation of the 2,2-dimethyl-5-hydroperoxy-1-pyrrolidinyloxyl (DMPO-OOH) adduct.76 With these data, we assume that nebulization of H2O2 aqueous solutions produces H2O2 aerosols that follow the common decomposition pathway through the formation of the hydroperoxyl radical, which rapidly forms hydroxyl radicals, and eventually will generate oxygen and water.
Finally, when H2O2 aerosols and O3 gas were combined, EPR spectra of DMPO showed mainly the formation of DMPOX and DMPO-OH, but small traces of DMPO-OOH are detected. Importantly, the intensity of the peaks corresponding to the DMPO-OH adduct was higher than compared with individual nebulization of H2O2, meaning that the presence of the superoxide anion radical has been considerably reduced. Somehow, O3 is combined with H2O2 and forces the decomposition of H2O2 towards the hydroxyl radical.
| O3 + M/hv/Δ → O2 + O˙ | (1) |
| O2 + O˙ → 1O2 + 3O2 | (2) |
| H2O + O˙ → 2˙OH | (3) |
Either in water solution or the gas phase, H2O2 seems to degrade to water and oxygen as shown in reaction (4),71,81,82 but in the meantime it generates free radicals, many of them known as ROS. In water solutions, H2O2 is considered as a weak acid, forming an acid–base equilibrium with the hydroperoxyl anion as shown in reaction (5), which will react with H2O2 to form the hydroperoxyl radical (reaction (6)) that can establish an acid–base equilibrium forming the superoxide radical anion as proposed in reaction (7), which could react with H2O2, following the Haber–Weiss reaction,83 see reaction (8). In our case, we nebulized a freshly prepared H2O2 solution at pH 5.5, in which, H2O2 should be relatively stable compared to more basic or acidic pHs.56 However, once we generate the aerosols, H2O2 molecules get in contact with high concentrations of O2 molecules, metal anion impurities,84 airborne dust particles, bioaerosols or any solid surface85,86 (e.g., furniture, wall paintings, room ceiling or ceramic floor) that will trigger H2O2 degradation. Products of reactions (5) to (8) such as hydroperoxyl/superoxide radicals, hydroxyl radicals and singlet oxygen have been detected in EPR spectroscopy, demonstrating the self-decomposition of H2O2 aerosols. The singlet oxygen molecule source could come from the oxygen molecules coming from H2O2 degradation.
| H2O2(l) → H2O + 1/2O2 | (4) |
| H2O2(l) ⇌ HO2− + H+ | (5) |
 | (6) |
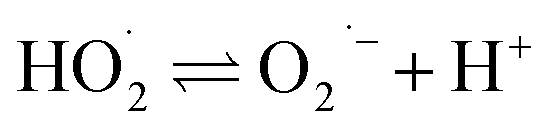 | (7) |
| H2O2(l) + O2˙− → O2 + .OH + OH− | (8) |
In the case of mixtures of H2O2 and O3, EPR spectroscopy experiments indicate the formation of hydroxyl and singlet oxygen species, indicating that the mixtures of H2O2 aerosols and O3 gas promote the direct decomposition of H2O2 molecules to hydroxyl radicals in air, see reaction (9). This fact agrees with Merényi et al. work that describes the peroxone process, in which H2O2 in water solution reacts with dissolved O3 gas, yielding hydroxy radicals and oxygen as main products.81 Although little amounts of superoxide anion radicals are formed as an intermediate, they quickly react with O3 producing hydroxyl radicals. This will explain why in our case, the DMPO-OOH adduct signal is weakened when O3 and H2O2 were mixed.81 From the chemical standpoint, this fact can be explained since redox potentials of O3, ˙OH, and H2O2 are able to oxidate hydroperoxyl radicals to hydroxyl radicals, see potentials in Table 4. In this sense, the increment of H2O2 decomposition rate due to the presence of strong oxidants, such as O3, could explain the absence of increment in the antimicrobial activity of this binary mixture.
| 2O3(g) + H2O2(l) → 3O2 + 2˙OH | (9) |
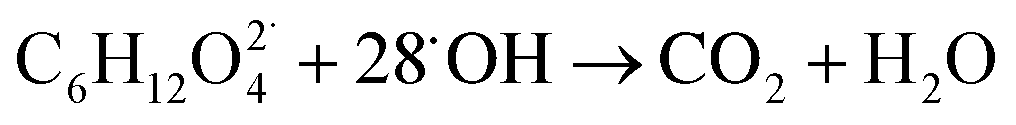
When TEG was fogged into the office room alone, or mixed with H2O2 aerosols or O3, it produced a light fog that was stable in air for a long period of time, but when equal concentrations of TEG were mixed with H2O2 and O3 gas, 90% of initial TEG was degraded. According to the literature,70,89 when TEG molecules get contact with oxygen and hydroxyl radicals, it triggers TEG degradation, ending with the formation of CO2 and H2O. In this specific case, the presence of singlet oxygen molecules triggers TEG degradation,90,91 forming terminal hydroxyl functional groups and hydroxyl radicals, which react with this pre-oxidated TEG easily,37 see reactions (10) and (11). Moreover, considering that TEG is a dehydrator agent, it is reasonable to think that in our case, TEG aerosols will incorporate ambient aqueous H2O2 aerosols facilitating the degradation of TEG. This fact would explain why the ternary mixtures trigger the highest airborne antimicrobial activity, see Fig. 4.
 | (10) |
 | (11) |
Although TEG degradation could be seen as a drawback, alkoxy and peroxyl radicals derived from TEG decomposition might act as damaging agents to microorganisms' membranes.92,93
4 Conclusions
The dispersion of low concentrations of antimicrobial agents below the exposure limit can be a useful and safe strategy to reduce environmental microorganisms in poor ventilated indoors. We showed that the application of O3, H2O2, and TEG, dispersed individually at safe concentrations, exerts antimicrobial activity on naturally occurring microorganisms and commercial sporulated bacteria. The combination of chemicals can be more effective than the dispersion of the agents alone depending on the combination, microorganism, and environment. The combination of chemicals with oxidant activity was more effective over sporulated bacteria, but not against naturally occurring microorganisms. The combination of compounds with a different mechanism of action was only more effective if TEG was combined with O3, but not with H2O2, and only against airborne and surface bacteria. However, the ternary mixture was the most effective against commercial sporulated bacteria and airborne microorganisms. Our results, obtained in a real scenario, support that the dispersion of safe concentrations of agents with antimicrobial activity is a strategy that could reduce airborne transmission diseases in indoors. More research is needed to identify combinable compounds with higher antimicrobial potential to formulate safe antimicrobial mixtures.Abbreviations
| Triethylene Glycol | TEG |
| Ozone | O3 |
| Hydrogen peroxide | H2O2 |
| Electron paramagnetic resonance | EPR |
| Permissible exposure limit | PELs |
| Recommended exposure limit | RELs |
| Time-weighted average concentrations | TWA |
| Sulfuric acid | H2SO4 |
| Potassium dichromate | K2Cr2O7 |
| Nitric acid | HNO3 |
| Potassium titanium oxide oxalate dihydrate | C4H2K2O9Ti |
| 5,5-Dimethyl-1-pyrroline N-oxide | DMPO |
| 5,5-Dimethyl-1-pyrroline N-oxide over oxidated | DMPOX |
| 2,2,6,6-Tetramethylpiperidine | TEMP |
| Oxidated 2,2,6,6-tetramethylpiperidine | TEMPO |
| Colony-forming unit | CFU |
| Reactive oxygen species | ROS |
Conflicts of interest
There are no conflicts to declare.Acknowledgements
Financial support by the Health Research Institute of the Balearic Islands (grant COVID-19/25) and by the Regional Ministry of European funds, University and Culture of the Balearic Islands (grant AP_2021_032) is gratefully acknowledged. H. G. B. grant RYC2022-037287-I funded by MICIU/AEI/10.13039/501100011033 and “ESF+”.References
- K. H. Kim, E. Kabir and S. A. Jahan, Airborne bioaerosols and their impact on human health, J. Environ. Sci., 2018, 67, 23–35 CrossRef CAS PubMed.
- M. I. Guzman, An overview of the effect of bioaerosol size in coronavirus disease 2019 transmission, Int. J. Health Plann. Manag., 2021, 36(2), 257–266 CrossRef PubMed.
- M. Delikhoon, M. I. Guzman, R. Nabizadeh and A. Norouzian Baghani, Modes of Transmission of Severe Acute Respiratory Syndrome-Coronavirus-2 (SARS-CoV-2) and Factors Influencing on the Airborne Transmission: A Review, Int. J. Environ. Res. Publ. Health, 2021, 18(2), 395 CrossRef CAS PubMed.
- M. C. de la Rosa, M. A. Mosso and C. Ullán, El aire: hábitat y medio de transmisión de microorganismos, Obs. Medioambient., 2002, 5, 375–402 Search PubMed.
- P. . M. Á. Daza, D. X. Martínez Benavides and P. A. Caro Hernández, Contaminación microbiológica del aire al interior y el síndrome del edificio enfermo, Biociencias, 2015, 10(2), 37–50 CrossRef.
- G. Dev Kumar, A. Mishra, L. Dunn, A. Townsend, I. C. Oguadinma and K. R. Bright, et al., Biocides and Novel Antimicrobial Agents for the Mitigation of Coronaviruses, Front. Microbiol., 2020, 11, 1351 CrossRef PubMed.
- M. Oliveira, B. K. Tiwari and G. Duffy, Emerging Technologies for Aerial Decontamination of Food Storage Environments to Eliminate Microbial Cross-Contamination, Foods, 2020, 9(12), 1779 CrossRef CAS PubMed.
- C. Gonzalez-Martin. Airborne Infectious Microorganisms. En, editor. Encyclopedia of Microbiology, ed. T. M. Schmidt, Academic Press, Oxford, 4th edn, 2019, [citado 13 de noviembre de 2022], pp. 52–60, Disponible en: https://www.sciencedirect.com/science/article/pii/B978012809633813002X Search PubMed.
- WHO Coronavirus (COVID-19) Dashboard [Internet], [citado 1 de agosto de 2022], Disponible en: https://covid19.who.int.
- J. W. Tang, W. P. Bahnfleth, P. M. Bluyssen, G. Buonanno, J. L. Jimenez and J. Kurnitski, et al., Dismantling myths on the airborne transmission of severe acute respiratory syndrome coronavirus-2 (SARS-CoV-2), J. Hosp. Infect., 2021, 110, 89–96 CrossRef CAS PubMed.
- Z. Peng and J. L. Jimenez, Exhaled CO2 as a COVID-19 Infection Risk Proxy for Different Indoor Environments and Activities, Environ. Sci. Technol. Lett., 2021, 8(5), 392–397 CrossRef CAS PubMed.
- K. E. Jones, N. G. Patel, M. A. Levy, A. Storeygard, D. Balk and J. L. Gittleman, et al., Global trends in emerging infectious diseases, Nature, 2008, 451(7181), 990–993 CrossRef CAS PubMed.
- M. K. Anser, Z. Yousaf, M. A. Khan, A. A. Nassani, S. M. Alotaibi and M. M. Qazi Abro, et al., Does communicable diseases (including COVID-19) may increase global poverty risk? A cloud on the horizon, Environ. Res., 2020, 187, 109668 CrossRef CAS PubMed.
- M. Lidia, A. Joseph, B. William, B. Atze and B. Giorgio, et al., A paradigm shift to combat indoor respiratory infection, Science, 2021, 372(6543), 689–691 CrossRef PubMed.
- S. Mosalaei, H. Amiri, A. Rafiee, A. Abbasi, A. N. Baghani and M. Hoseini, Assessment of fungal bioaerosols and particulate matter characteristics in indoor and outdoor air of veterinary clinics, J. Environ. Sci. Health Environ. Sci. Eng., 2021, 19(2), 1773–1780 CrossRef CAS PubMed.
- A. N. Baghani, S. Golbaz, G. Ebrahimzadeh, M. I. Guzman, M. Delikhoon and M. J. Rastani, et al., Characteristics and assessing biological risks of airborne bacteria in waste sorting plant, Ecotoxicol. Environ. Saf., 2022, 232, 113272 CrossRef CAS PubMed.
- A. López, E. Fuentes, V. Yusà, F. X. López-Labrador, M. Camaró and C. Peris-Martinez, et al., Indoor Air Quality including Respiratory Viruses, Toxic, 2021, 9(11), 274 CrossRef PubMed.
- J. Truyols Vives, J. Muncunill, N. Toledo Pons, H. G. Baldov, E. Sala Llins and B. J. Mercader, SARS-CoV-2 detection in bioaerosols using a liquid impinger collector and ddPCR, Indoor Air, 2022, 32(2), e13002 CrossRef CAS PubMed.
- T. V. Joan, S. A. Kristiyan, S. L. Ernest, T. P. Nuria, G. B. Herme and M. B. Josep, Efficiency and sensitivity optimization of a protocol to quantify indoor airborne SARS-CoV-2 levels, J. Hosp. Infect., 2022, 130, 44–51 CrossRef PubMed.
- A. Dinoi, M. Feltracco, D. Chirizzi, S. Trabucco, M. Conte and E. Gregoris, et al., A review on measurements of SARS-CoV-2 genetic material in air in outdoor and indoor environments: Implication for airborne transmission, Sci. Total Environ., 2022, 809, 151137 CrossRef CAS PubMed.
- P. Armand and J. Tâche, 3D modelling and simulation of the dispersion of droplets and drops carrying the SARS-CoV-2 virus in a railway transport coach, Sci. Rep., 2022, 12(1), 4025 CrossRef CAS PubMed.
- W. A. Rutala and D. J. Weber, Disinfection, Sterilization, and Control of Hospital Waste. Mandell, Douglas, and Bennett’s Principles and Practice of Infectious Diseases, 2015, pp. 3294–3309.e4 Search PubMed.
- S. N. Rudnick, J. J. McDevitt, M. W. First and J. D. Spengler, Inactivating influenza viruses on surfaces using hydrogen peroxide or triethylene glycol at low vapor concentrations, Am. J. Infect. Control, 2009, 37(10), 813–819 CrossRef PubMed.
- T. Iwamura, K. Nagano, T. Nogami, N. Matsuki, N. Kosaka and H. Shintani, et al., Confirmation of the Sterilization Effect Using a High Concentration of Ozone Gas for the Bio-Clean room, Biocontrol Sci., 2013, 18(1), 9–20 CrossRef CAS PubMed.
- B. M. Andersen, M. Rasch, K. Hochlin, F. H. Jensen, P. Wismar and J. E. Fredriksen, Decontamination of rooms, medical equipment and ambulances using an aerosol of hydrogen peroxide disinfectant, J. Hosp. Infect., 2006, 62(2), 149–155 CrossRef CAS PubMed.
- W. J. Kowalski, W. P. Bahnfleth and T. S. Whittam, Bactericidal Effects of High Airborne Ozone Concentrations on Escherichia coli and Staphylococcus aureus, Ozone Sci. Eng., 1998, 20(3), 205–221 CrossRef CAS.
- K. Rangel, F. O. Cabral, G. C. Lechuga, J. P. R. S. Carvalho, M. H. S. Villas-Bôas and V. Midlej, et al., Detrimental Effect of Ozone on Pathogenic Bacteria, Microorganisms, 2022, 10(1), 40 CrossRef CAS PubMed.
- J. Krishnan, N. N. Subhash, C. V. Muraleedharan, P. V. Mohanan, M. Nandakumar and S. Neethu, et al., Chitra Disinfection Gateway for the Management of COVID 19 in Public Entry Places, Trans. Indian Natl. Acad. Eng., 2020, 5(2), 289–294 CrossRef PubMed.
- B. Bayarri, A. Cruz-Alcalde, N. López-Vinent, M. M. Micó and C. Sans, Can ozone inactivate SARS-CoV-2? A review of mechanisms and performance on viruses, J. Hazard. Mater., 2021, 415, 125658 CrossRef CAS PubMed.
- C. Tizaoui, Ozone: A Potential Oxidant for COVID-19 Virus (SARS-CoV-2), Ozone: Sci. Eng., 2020, 42(5), 378–385 CrossRef CAS.
- T. Pottage, I. Garratt, O. Onianwa, J. Carter and A. M. Bennett, Rapid inactivation of SARS-CoV-2 after exposure to vapour hydrogen peroxide, J. Hosp. Infect., 2021, 118, 77–78 CrossRef CAS PubMed.
- Y. Cai, Y. Zhao, A. K. Yadav, B. Ji, P. Kang and T. Wei, Ozone based inactivation and disinfection in the pandemic time and beyond: Taking forward what has been learned and best practice, Sci. Total Environ., 2023, 862, 160711 CrossRef CAS PubMed.
- O. H. Robertson, Disinfection of the air with triethylene glycol vapor, Am. J. Med., 1949, 7(3), 293–296 CrossRef CAS PubMed.
- C. Elendu Collins, N. Ude.Callistus, E. Odoh Emmanuel and J. Ihedioha Onyedikachi, Natural gas dehydration with triethylene glycol (TEG), Eur. Sci. J., 2015, 11, 30 Search PubMed , https://url.uk.m.mimecastprotect.com/s/L9-zCoVgyClJYkBf1COEi?domain=eujournal.org.
- J. G. Speight, Chapter Seven - Properties Processing of Gas From Tight Formations, En, Deep Shale Oil and Gas [Internet], ed. J. G. Speight, Gulf Professional Publishing, Boston, 2017, pp. , pp. 307-347, Disponible en: https://www.sciencedirect.com/science/article/pii/B9780128030974000073 Search PubMed.
- R. Jeong, H. Kumar, S. Jones, A. Sandwell, K. Kim and S. S. Park, Increased sanitization potency of hydrogen peroxide with synergistic O3 and intense pulsed light for non-woven polypropylene, RSC Adv., 2021, 39(11), 23881–23891 RSC.
- B. Ballantyne and W. M. Snellings, Triethylene glycol HO(CH2CH2O)3H, J. Appl. Toxicol., 2007, 27(3), 291–299 CrossRef CAS PubMed.
- Y. Hirama, S. Onishi, R. Shibata, H. Ishida, T. Mori and N. Ota, Antiviral Effect of Propylene Glycol against Envelope Viruses in Spray and Volatilized Forms, Viruses, 2023, 15(7), 1421 CrossRef CAS PubMed.
- R. Jeong, H. Kumar, S. Jones, A. Sandwell, K. Kim and S. S. Park, Increased sanitization potency of hydrogen peroxide with synergistic O3 and intense pulsed light for non-woven polypropylene, RSC Adv., 2021, 11(39), 23881–23891 RSC.
- M. Urushidani, A. Kawayoshi, T. Kotaki, K. Saeki, Y. Mori and M. Kameoka, Inactivation of SARS-CoV-2 and influenza A virus by dry fogging hypochlorous acid solution and hydrogen peroxide solution, PLoS One, 2022, 17(4), e0261802 CrossRef PubMed.
- Table Z-1 – Table Z-1. Limits for Air Contaminants. | Occupational Safety and Health Administration [Internet]. [citado 1 de agosto de 2022]. Disponible en: https://www.osha.gov/laws-regs/regulations/standardnumber/1910/1910.1000TABLEZ1.
- CDC – NIOSH Pocket Guide to Chemical Hazards - Hydrogen peroxide [Internet]. [citado 1 de agosto de 2022]. Disponible en: https://www.cdc.gov/niosh/npg/npgd0335.html.
- Hydrogen Proxide | Occupational Safety and Health Administration [Internet]. [citado 1 de agosto de 2022]. Disponible en: https://www.osha.gov/chemicaldata/630.
- Ozone | Occupational Safety and Health Administration [Internet]. [citado 1 de agosto de 2022]. Disponible en: https://www.osha.gov/chemicaldata/9.
- Hazardous Substance Fact Sheet .pdf [Internet]. [citado 6 de febrero de 2023]. Disponible en: https://nj.gov/health/eoh/rtkweb/documents/fs/1451.pdf.
- Instituto Nacional de Seguridad y Salud en el Trabajo (INSST). Límites de Exposición Profesional 2022 [Internet]. 2022 [citado 6 de febrero de 2023]. Disponible en: https://bdlep.insst.es/LEP/vlapr.jsp?ID=708%26nombre=%C3%93xidodealuminio.
- T. Y. Fu, P. Gent and V. Kumar, Efficacy, efficiency and safety aspects of hydrogen peroxide vapour and aerosolized hydrogen peroxide room disinfection systems, J. Hosp. Infect., 2012, 80(3), 199–205 CrossRef CAS PubMed.
- M. E. Dubuis, N. Dumont-Leblond, C. Laliberté, M. Veillette, N. Turgeon and J. Jean, et al., Ozone efficacy for the control of airborne viruses: Bacteriophage and norovirus models, PLoS One, 2020, 15(4), e0231164 CrossRef CAS PubMed.
- Asociación Española de Normalización, Norma Española UNE-EN ISO 4833-1:2014/A1, 2022.
- Asociación Española de Normalización, Norma Española UNE-EN ISO 4833-2:2014/A1, 2022 Search PubMed.
- Asociación Española de Normalización, Norma Española UNE-EN ISO 7218, 2008 Search PubMed.
- Asociación Española de Normalización, Norma Española UNE-EN ISO 8199 [Internet], BSI British Standards, 2019, Disponible en: https://linkresolver.bsigroup.com/junction/resolve/000000000030291336?restype=standard Search PubMed.
- J. L. Sotelo, F. J. Beltran, F. J. Benitez and J. Beltran-Heredia, Ozone decomposition in water: kinetic study, Ind. Eng. Chem. Res., 1987, 26(1), 39–43 CrossRef CAS.
- F. X. Mueller, L. Loeb and W. H. Mapes, Decomposition rates of ozone in living areas, Environ. Sci. Technol., 1973, 7(4), 342–346 CrossRef CAS.
- E. S. Shanley and F. P. Greenspan, Highly Concentrated Hydrogen Peroxide, Ind. Eng. Chem., 1947, 39(12), 1536–1543 CrossRef CAS.
- Z. M. Galbács and L. J. Csányi, Alkali-induced decomposition of hydrogen peroxide, J. Chem. Soc., Dalton Trans., 1983,(11), 2353–2357 RSC.
- L. J. Heidt and V. R. Landi, Ozone and Ozonide Production and Stabilization in Water, J. Chem. Phys., 1964, 41(1), 176–178 CrossRef CAS.
- M. Eriksson, Ozone chemistry in aqueous solution : ozone decomposition and stabilisation, 2005 [citado 6 de febrero de 2023]; Disponible en: http://urn.kb.se/resolve?urn=urn:nbn:se:kth:diva-303 Search PubMed.
- T. Batakliev, V. Georgiev, M. Anachkov and S. Rakovsky, Ozone decomposition, Interdiscipl. Toxicol., 2014, 7(2), 47–59 CrossRef PubMed.
- J. Šakalys and R. Girgždienė, Estimation of the ground-level ozone lifetime under rural conditions, Lith. J. Phys., 2010, 50, 247–254 CrossRef.
- W. D. Nicoll and A. F. Smith, Stability of Dilute Alkaline Solutions of Hydrogen Peroxide, Ind. Eng. Chem., 1955, 47(12), 2548–2554 CrossRef CAS.
- C. C. Lin, F. R. Smith, N. Ichikawa, T. Baba and M. Itow, Decomposition of hydrogen peroxide in aqueous solutions at elevated temperatures, Int. J. Chem. Kinet., 1991, 23(11), 971–987 CrossRef CAS.
- P. Pędziwiatr, F. Mikołajczyk, D. Zawadzki, K. Mikołajczyk and A. Bedka, Decomposition of hydrogen peroxide - kinetics and review of chosen catalysts, Acta Innovations, 2018,(26), 45–52 Search PubMed.
- C. Houtman and P. Hart, Predicting the Autoaccelerating Hydrogen Peroxide Decomposition Rate after Mixing with Sodium Hydroxide, Ind. Eng. Chem. Res., 2022, 61(34), 12473–12481 CrossRef CAS.
- E. Y. Yazıcı, Improvement of Stability of Hydrogen Peroxide using Ethylene Glycol, J. Sci. Eng., 2017, 19(57), 938–949 Search PubMed.
- Stabilization of aqueous solutions of homo- and copolymers of N-vinylpyrrolidone [Internet]. DE102004049344A1, 2006 [citado 7 de febrero de 2023]. Disponible en: https://patents.google.com/patent/DE102004049344A1/en.
- N. F. Beatty and M. K. Walsh, Influence of thermosonication on Geobacillus stearothermophilus inactivation in skim milk, Int. Dairy J., 2016, 61, 10–17 CrossRef CAS.
- S. a. Burgess, S. h. Flint and D. Lindsay, Characterization of thermophilic bacilli from a milk powder processing plant, J. Appl. Microbiol., 2014, 116(2), 350–359 CrossRef CAS PubMed.
- J. McCord, M. Prewitt, E. Dyakova, S. Mookerjee and J. A. Otter, Reduction in Clostridium difficile infection associated with the introduction of hydrogen peroxide vapour automated room disinfection, J. Hosp. Infect., 2016, 94(2), 185–187 CrossRef CAS PubMed.
- R. S. Goglev and M. B. Neiman, Thermal-oxidative degradation of the simpler polyalkyleneoxides, Polym. Sci., 1968, 9(5), 2351–2364 Search PubMed.
- Y. Nosaka and A. Y. Nosaka, Generation and Detection of Reactive Oxygen Species in Photocatalysis, Chem. Rev., 2017, 117(17), 11302–11336 CrossRef CAS PubMed.
- G. R. Buettner, Spin Trapping: ESR parameters of spin adducts 1474 1528V, Free Radic. Biol. Med., 1987, 3(4), 259–303 CrossRef CAS PubMed.
- S. Ortelli, A. L. Costa, P. Matteucci, M. R. Miller, M. Blosi and D. Gardini, et al., Silica modification of titania nanoparticles enhances photocatalytic production of reactive oxygen species without increasing toxicity potential in vitro, RSC Adv., 2018, 8(70), 40369–40377 RSC.
- J. Hou, L. Xu, Y. Han, Y. Tang, H. Wan and Z. Xu, et al., Deactivation and regeneration of carbon nanotubes and nitrogen-doped carbon nanotubes in catalytic peroxymonosulfate activation for phenol degradation: variation of surface functionalities, RSC Adv., 2019, 9(2), 974–983 RSC.
- Y. Liu, C. Chen, X. Duan, S. Wang and Y. Wang, Carbocatalytic ozonation toward advanced water purification, J. Mater. Chem. A, 2021, 9(35), 18994–19024 RSC.
- I. Fenoglio, G. Greco, S. Livraghi and B. Fubini, Non-UV-Induced Radical Reactions at the Surface of TiO2 Nanoparticles That May Trigger Toxic Responses, Chem.–Eur. J., 2009, 15(18), 4614–4621 CrossRef CAS PubMed.
- S. Chapman, XXXV. On ozone and atomic oxygen in the upper atmosphere, London, Edinburgh Dublin Phil. Mag. J. Sci., 1930, 10(64), 369–383 CrossRef CAS.
- H. Itoh, M. Taguchi and S. Suzuki, Thermal decomposition of ozone at high temperature leading to ozone zero phenomena, J. Phys. D Appl. Phys., 2020, 53(18), 185206 CrossRef CAS.
- H. S. Johnston, Global ozone balance in the natural stratosphere, Rev. Geophys., 1975, 13(5), 637–649 CrossRef.
- W. H. Glaze, Reaction products of ozone: A review, Environ. Health Perspect., 1986, 69(7), 151–157 CrossRef CAS PubMed.
- G. Merényi, J. Lind, S. Naumov and S. C. von, Reaction of Ozone with Hydrogen Peroxide (Peroxone Process): A Revision of Current Mechanistic Concepts Based on Thermokinetic and Quantum-Chemical Considerations, Environ. Sci. Technol., 2010, 44(9), 3505–3507 CrossRef PubMed.
- H. Guo, X. Yu and M. Lin, Kinetic isotope effects in H2O2 self-decomposition: Implications for triple oxygen isotope systematics of secondary minerals in the solar system, Earth Planet. Sci. Lett., 2022, 594, 117722 CrossRef CAS.
- F. Haber and J. Weiss, Über die Katalyse des Hydroperoxydes, Naturwissenschaften, 1932, 20(51), 948–950 CrossRef CAS.
- J. J. Pignatello, E. Oliveros and A. MacKay, Advanced Oxidation Processes for Organic Contaminant Destruction Based on the Fenton Reaction and Related Chemistry, Crit. Rev. Environ. Sci. Technol., 2006, 36(1), 1–84 CrossRef CAS.
- A. Hiroki and J. A. LaVerne, Decomposition of Hydrogen Peroxide at Water−Ceramic Oxide Interfaces, J. Phys. Chem. B, 2005, 109(8), 3364–3370 CrossRef CAS PubMed.
- H. Yang, B. Shi and S. Wang, Fe Oxides Loaded on Carbon Cloth by Hydrothermal Process as an Effective and Reusable Heterogenous Fenton Catalyst, Catalysts, 2018, 8(5), 207 CrossRef.
- D. A. Armstrong, R. E. Huie, W. H. Koppenol, S. V. Lymar, G. Merényi and P. Neta, et al., Standard electrode potentials involving radicals in aqueous solution: inorganic radicals (IUPAC Technical Report), Pure Appl. Chem., 2015, 87(11–12), 1139–1150 CrossRef CAS.
- M. Göltz, M. Koch, R. Detsch, M. Karl, A. Burkovski and S. Rosiwal, Influence of In-Situ Electrochemical Oxidation on Implant Surface and Colonizing Microorganisms Evaluated by Scanning Electron Microscopy, Materials, 2019, 12(23), 3977 CrossRef PubMed.
- J. Glastrup, Degradation of polyethylene glycol. A study of the reaction mechanism in a model molecule: Tetraethylene glycol, Polym. Degrad. Stab., 1996, 52(3), 217–222 CrossRef CAS.
- D. B. Min and J. M. Boff, Chemistry and Reaction of Singlet Oxygen in Foods, Compr. Rev. Food Sci. Food Saf., 2002, 1(2), 58–72 CrossRef CAS PubMed.
- K. K. Høisæter, V. Buvik, S. Villa Gonzalez, S. J. Vevelstad and H. K. Knuutila, Oxidative degradation of triethylene glycol, Chem. Eng. Sci., 2024, 287, 119706 CrossRef.
- P. Chaudhary, P. Janmeda, A. O. Docea, B. Yeskaliyeva, A. F. Abdull Razis and B. Modu, et al., Oxidative stress, free radicals and antioxidants: potential crosstalk in the pathophysiology of human diseases, Front. Chem., 2023, 11, 1158198 CrossRef CAS PubMed.
- S. Matsugo, N. Kayamori, T. Ohta and T. Konishi, Mechanism of Decomposition of Cyclic Peroxides, 4-Alkoxy-1, 4-dihydro-2, 3-benzodioxin-1-ols, to Afford Hydroxyl Radical, Chem. Pharm. Bull., 1991, 39(3), 545–548 CrossRef CAS PubMed.
| This journal is © The Royal Society of Chemistry 2024 |