
 Open Access Article
 This Open Access Article is licensed under a Creative Commons Attribution-Non Commercial 3.0 Unported Licence
Interference of sea salt in capture vaporizer-ToF-ACSM measurements of biomass burning organic aerosols in coastal locations†
Adhitya
Sutresna
 *ab,
Melita
Keywood
b,
Clare
Paton-Walsh
c,
Jack
Simmons
c,
Caleb
Mynard
b,
Quang
Dang
c,
Michihiro
Mochida
d,
Sho
Ohata
d,
Sonia
Afsana
e,
Bhagawati
Kunwar
f,
Kimitaka
Kawamura
f,
Ruhi
Humphries
b,
Erin
Dunne
b,
Jason
Ward
b,
James
Harnwell
b,
Fabienne
Reisen
b,
Kathryn
Emmerson
b,
Alan
Griffiths
g,
Alastair
Williams
g,
Robyn
Schofield
a and
Peter
Rayner
a
*ab,
Melita
Keywood
b,
Clare
Paton-Walsh
c,
Jack
Simmons
c,
Caleb
Mynard
b,
Quang
Dang
c,
Michihiro
Mochida
d,
Sho
Ohata
d,
Sonia
Afsana
e,
Bhagawati
Kunwar
f,
Kimitaka
Kawamura
f,
Ruhi
Humphries
b,
Erin
Dunne
b,
Jason
Ward
b,
James
Harnwell
b,
Fabienne
Reisen
b,
Kathryn
Emmerson
b,
Alan
Griffiths
g,
Alastair
Williams
g,
Robyn
Schofield
a and
Peter
Rayner
a
aSchool of Geography, Earth & Atmospheric Sciences, University of Melbourne, Parkville, VIC 3010, Australia. E-mail: asutresna@student.unimelb.edu.au
bClimate Science Centre, CSIRO, Aspendale, VIC 3195, Australia
cCentre for Atmospheric Chemistry, University of Wollongong, NSW 2522, Australia
dInsititute for Space-Earth Environmental Research, Nagoya University, Nagoya, Aichi 464-8601, Japan
eGraduate School of Environmental Studies, Nagoya University, Nagoya, Aichi 464-8601, Japan
fGraduate School of Environmental Studies, Chubu University, Kasugai, Aichi 487-0027, Japan
gAustralian Nuclear Science & Technology Organisation, Lucas Heights, NSW 2234, Australia
First published on 7th May 2024
Abstract
The capture vaporizer (CV) was developed to reduce uncertainties in non-refractory aerosol composition measurements made using the aerosol mass spectrometer (AMS) and the aerosol chemical speciation monitor (ACSM). Use of the capture vaporizer has achieved this by improving the instruments' collection efficiency to ∼1, but it has also lengthened the aerosol particles' residence times in the instrument, which has changed AMS and ACSM measurements using the standard vaporizer by altering known fragmentation patterns of organic marker species and increasing the likelihood of detecting refractory particles such as sea salt at typical operating temperatures (∼550 °C). This study reports that the changes affected by the capture vaporizer leads to sea salt particles interfering with measurements of biomass burning organic aerosols (BBOA) in environments where both particle sources are present as the ACSM's unit mass resolution is unable to distinguish between different molecules with the same molecular mass. Demonstration of this interference was performed using CV-Time of Flight-ACSM (CV-ToF-ACSM) measurements at two coastal Australian locations: the Kennaook-Cape Grim Baseline Air Pollution Station, Tasmania; and the site of the COALA-2020 (Characterizing Organics and Aerosol Loading over Australia 2020) campaign in New South Wales. Concentrations of BBOA marker ions m/z 60 and m/z 73 were examined at both locations, which showed two distinct branches of points: one where the two marker ions were positively correlated and one that was uncorrelated. This was due to m/z 60 also being a marker for sea salt. A threshold concentration of m/z 73 was established at each location to recognise periods where m/z 60 originated from BBOA. Lower concentrations of m/z 44 and radon when m/z 73 concentration was below the BBOA threshold indicated that m/z 60 concentration during these periods corresponded to inorganic particles of marine origin. Positive Matrix Factorization has also been shown to separate m/z 60 concentration from the two sources. This study suggests that using CV-ToF-ACSMs in coastal locations that are exposed to biomass burning smoke needs to consider sea salt interference when identifying BBOA.
Environmental significanceWhat is the problem/situation?The capture vapouriser, an innovation made in a component of the Aerosol Chemical Speciation Monitor (ACSM), has made it possible for sea salt to interfere with measurements of biomass burning organic aerosols (BBOA) in environments where the two particle sources coexist. This has not been previously reported, likely due to studies measuring BBOA with capture vaporizer-ACSMs being in inland locations. Why is it important to address/understand this? The ACSM is an instrument that estimates aerosol composition and given that these estimations are currently made without taking this interference into account, it could result in incorrect composition information. What is the key finding? Measurements taken at the two coastal study locations exhibited concentrations of m/z 60 from sea salt that were not detected in measurements from other studies in inland locations and are on the same order of magnitude as m/z 60 from BBOA. Location-dependent threshold concentrations of m/z 73, another BBOA marker molecular fragment, can be used to distinguish between contributions of the two sources of m/z 60. How can this be generalised? Researchers studying BBOA using capture vaporizer -ACSMs in locations where smoke and sea salt are prominent particle sources (e.g., near the coastline) should expect a contribution to m/z 60 from sea salt. Researchers should avoid misattributing this contribution to the organic fraction, which can be achieved by using other BBOA markers, such as the threshold m/z 73 concentration. |
1. Introduction
Atmospheric aerosols exert impacts on solar radiative forcing, but their specific impacts vary according to their chemical composition.1 This variability, combined with a general lack of observations, lead to large uncertainties in estimating the overall effect of aerosols on radiative forcing.2 Instrumental observations are therefore vital in improving our understanding of how the composition of aerosols impact the climate.One instrument that is used to measure the composition of atmospheric aerosols is the Aerosol Chemical Speciation Monitor (ACSM), which is based on the technology of the Aerosol Mass Spectrometer (AMS).3 The ACSM is an online mass spectrometry technique that uses fragmentation calculations to estimate the composition of non-refractory particulate matter with diameters smaller than 1 micron (PM1), consisting of sulfate, nitrate, ammonium, chloride, and organic aerosols (OA).4 While the standard ACSM is generally less sensitive and has lower mass resolution than the AMS (unit mass resolution instead of high resolution), it is also less costly, more compact (making it better suited to aircraft campaigns), and simpler to maintain.
This study uses a Time-of-Flight ACSM (ToF-ACSM), described in Fröhlich et al.5. Briefly, the process in which aerosol composition is measured is as follows: aerosols enter the instrument when they are pumped through an inlet. They are then flash vaporized and ionised upon impact with a heated filament known as the ionizer/vaporizer system (temperature ≈ 550–600 °C). Fragmentation of the aerosol molecules also commonly occurs upon vapourisation and ionisation. The molecular fragment ions are then sorted by mass in the mass analyser.
Molecular fragment ions can be characteristic of OA that originate from different sources. Studies using the AMS and ACSM have identified marker ion fragments for many particle sources including oxygenated compounds,6,7 fossil fuel emissions,8,9 biomass burning particles,10,11 cooking-related emissions,12,13 and biogenic secondary OA.14,15
An issue encountered in AMS and ACSM measurements is that the standard vaporizer generally used in these instruments produce uncertainties caused by particles bouncing out of the vaporizers, which can be up to 30% of the total uncertainties.16,17 To address this issue, the capture vaporizer was developed,18 which eliminated the particle bounce-related uncertainties.19 The capture vaporizer differs from the standard vaporizer as it possesses an external cage that prevents particles from bouncing out, as well as it being made of molybdenum instead of tungsten.19
The use of the capture vaporizer has also resulted in some unintended side effects, outlined by Hu et al.20. Firstly, the fragmentation patterns observed in many organic marker species when using the standard vaporizer are substantially different when using the capture vaporizer. Secondly, a higher proportion of ions weighing 44 atomic mass units (also expressed as mass to charge, or m/z 44) is observed using the capture vaporizer, which typically represents the CO2+ ion and is a marker for oxygenated particles. Thirdly, Mynard et al.21 [in prep.] illustrates that instruments using the capture vaporizer are able to observe sea salt, which is a refractory particle that would ordinarily have boiling points higher than the operating temperature of typical instruments (the AMS incorporating the standard vaporizer has been shown to be able to detect sea salt when the vaporizer temperature was specifically tuned22).
All three of these side effects are the result of the longer residence time of the particles the capture vaporizer due to its cage, which encourages greater thermal degradation of the particles than in the standard vaporizer. As such, marker ions for OA identified using instruments that use the standard vaporizer may not be appropriate for identifying sources when using the capture vaporizer.
To identify biomass burning OA (BBOA), the ions at m/z 60 and m/z 73 (representing C2H4O2+ and C3H5O2+, respectively) have been used extensively as markers in data from instruments that use the standard vaporizer.23,24 Using the capture vaporizer, most studies that have identified BBOA have continued to use them as marker ions, such as Kuang et al.,25 Sofowote et al.,26 Lalchandani et al.,27 despite the signal for these two ions experiencing marked reductions due to the change in vaporizer.
However, using a capture vaporizer-ACSM allows for the possibility of sea salt interfering with measurements of BBOA. This is because the capture vaporizer enables the detection of refractory particles Mynard et al.21 [in prep.] that include sea salt; a marker of sea salt, Na37Cl+,28,29 also weighs 60 atomic mass units; and the capture vaporizer-ACSM operating at unit mass resolution being unable to distinguish between two different molecules with the same unit mass.
Interference of this nature would only be possible in environments where both BBOA and sea salt can be found simultaneously, though this phenomenon is yet to be reported. In the 22 studies that have discussed BBOA measurements using the capture vaporizer-AMS or -ACSM (refer to Table S1†), 21 of them were conducted in locations 100 km inland or further, with locations like Beijing, China and Delhi, India making up most of the study sites.
One notable outlier is a case described in Lin et al.,30 which reported the coexistence of m/z 60 from both biomass burning and sea salt sources at Carnsore Point on Ireland's coast using a standard vaporizer-AMS. The use of the standard vaporizer is likely a crucial distinction, as Hu et al.20 noted that the production of m/z 60 from levoglucosan fragmentation is lower when using the capture vaporizer compared to the standard vaporizer. This reduction in m/z 60 signal would make measurements of m/z 60 from BBOA more easily obscured by interference from sea salt.
In this paper, we investigate the effect of operating the capture vaporizer fime-of-flight ACSM (CV-ToF-ACSM) in coastal environments where biomass burning events also occur on marker ions for BBOA. CV-ToF-ACSM measurements were collected at two locations in coastal southeastern Australia, focusing specifically on biomass burning markers m/z 60 and m/z 73. Concentrations of the biomass burning ACSM marker ions were also compared to those of known biomass burning marker species levoglucosan and black carbon. Finally, CV-ToF-ACSM data from both COALA and KCG were used as inputs in the factor analysis model Positive Matrix Factorization (PMF), which is a potential means to separating m/z 60 concentrations from the different sources.
2. Methods
In addition to deploying a CV-ToF-ACSM in two coastal locations in southeast Australia, this study also measured the mass spectra of a levoglucosan standard using a separate CV-ToF-ACSM, as well as sampling particulate levoglucosan on filters and taking optical measurements of black carbon.2.1 Sampling locations
The Characterizing Organics and Aerosol Loading over Australia 2020 (COALA-2020) campaign was conducted in Cataract, New South Wales, Australia (34.25° S, 150.82° E, Fig. 1a) between January and March 2020. This site is located approximately 50 km southwest and 20 km north of the cities of Sydney and Wollongong, respectively; is surrounded by eucalyptus forests;31 and is situated around 20 km away from the coast. The timing of the early part of the campaign (prior to 9 February 2020) coincided with the historically severe Black Summer bushfires that had occurred in southeastern Australia in the preceding months,32,33 including substantial biomass burning activity in the forests close to the study site. This was followed by several days of heavy rain. The later stages of the campaign experienced much less locally-produced smoke.34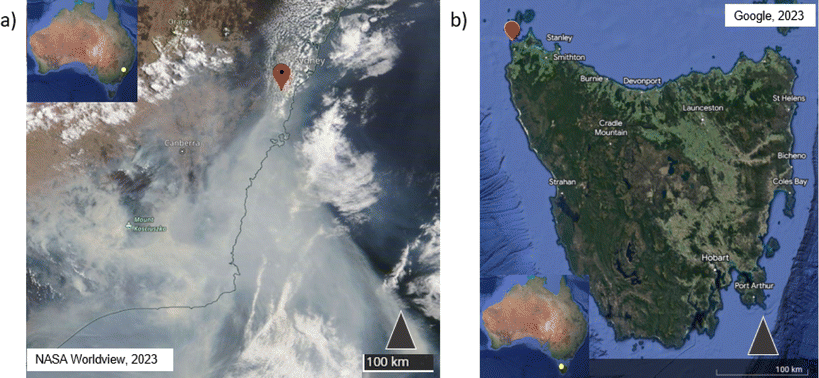 | ||
| Fig. 1 (a) Location of observation location for the COALA-2020 campaign; (b) location of the Kennaook-Cape Grim Baseline Air Pollution Station. | ||
Measurements from the CV-ToF-ACSM were also made at the Kennaook-Cape Grim (KCG) Baseline Air Pollution Station (40.68° S, 144.69° E, Fig. 1b) between February 2021 and September 2022 as part of the ongoing long term monitoring program at KCG. This site is located in a remote environment in northwest Tasmania, where to its east and southeast are primarily pastoral farmland, coastal heaths and grasslands, as well as some Melaleuca forests.35 The closest cities Launceston and Hobart are over 200 and 300 km away, respectively. To its north is the Bass Strait and the Australian mainland including the city of Melbourne (over 300 km away), while its western sector comprises the open Southern Ocean stretching to Africa's east coast. This is referred to as the “baseline sector” (190–280°), where air masses are considered to be as clean and free of anthropogenic influence as possible. Biomass burning activity occasionally occurs around KCG, particularly in the surrounding forests including on nearby islands to its north, while intense biomass burning events occurring in the southeast segment of the mainland can also be detected at the site.
2.2 Instrumental setup
At COALA, the measurements were collected from a common aerosol manifold inlet at a height of 5.13 m and used a total flow rate of 3 L min−1. At KCG, the ToF-ACSM sampled from the common aerosol inlet located on the roof deck of the station. The inlet is 10 m high and the roof-deck is 90 m above sea level. The ToF-ACSM subsampled from an aerosol manifold at the base of the aerosol inlet, through ¾ inch (19.05 mm) tubing 6.5 meters in length. The flow rate of sample into the ToF-ACSM was 3 L min−1. These inlet lines are both 316 stainless steel tube with an outside diameter of ¾ inch (19.05 mm) and are electropolished internally. The internal diameter is 15.9 mm. There are no internal steps or sharp bends in these lines and have multiple offtakes “Y fittings” at a 30-degree angle.
The radon measurements at KCG are described in detail in Williams and Chambers,39 based on an enhanced version of an instrument originally designed by Whittlestone and Zahorowski.38 Here, two detectors are run simultaneously: one operating at a delay volume of 5000 L with a flow rate of 300 L min−1 while the other has a delay volume of 1500 L and samples at a flow rate of 80 L min−1 at hourly resolution. The inlet for both of these detectors are placed on a telecom tower at a height of 70 m.
For the sample analysis, a 34 mm filter punch was extracted with a dichloromethane/methanol (2![[thin space (1/6-em)]](https://www.rsc.org/images/entities/char_2009.gif) :1, vol/vol) mixture under agitation (3 × 10 mL). Extracts were passed through a Pasteur pipet packed with quartz wool to remove filter debris and then concentrated to 200 microliters using a rotary evaporator. The extracts were dried with the help of pure nitrogen gas stream and then derivatized using 60 mL N,O-bis-(trimethylsilyl)trifluoroacetamide with 1% trimethylsilyl chloride in the presence of 10 μL of pyridine in a glass vial (1.5 mL) sealed with a Teflon-lined screw cap at 70 °C for 3 h. After the completion of derivatization, derivatized fractions were diluted using n-hexane containing an internal standard of n-C13 alkane (1.43 ng μL−1) prior to the injection into a gas chromatography (GC)/mass spectrometry (MS). GC/MS analyses of the samples were performed on a Hewlett-Packard model 6890 GC system coupled to Hewlett Packard model 5973 mass-selective detector.
:1, vol/vol) mixture under agitation (3 × 10 mL). Extracts were passed through a Pasteur pipet packed with quartz wool to remove filter debris and then concentrated to 200 microliters using a rotary evaporator. The extracts were dried with the help of pure nitrogen gas stream and then derivatized using 60 mL N,O-bis-(trimethylsilyl)trifluoroacetamide with 1% trimethylsilyl chloride in the presence of 10 μL of pyridine in a glass vial (1.5 mL) sealed with a Teflon-lined screw cap at 70 °C for 3 h. After the completion of derivatization, derivatized fractions were diluted using n-hexane containing an internal standard of n-C13 alkane (1.43 ng μL−1) prior to the injection into a gas chromatography (GC)/mass spectrometry (MS). GC/MS analyses of the samples were performed on a Hewlett-Packard model 6890 GC system coupled to Hewlett Packard model 5973 mass-selective detector.
The GC separation was attained on a HP-5 fused silica capillary column (25 m × 0.200 mm i.d., 0.5 μm film thickness). Mass spectral data were assimilated and processed with the Chemstation software. Target compound was identified and confirmed by comparing mass spectra with those of literature and library data and authentic standards and by interpretation of mass fragmentation patterns. GC-MS response factors of individual compound were determined using authentic standards and used for the quantification. Recoveries of the target compound was better than 90%. More details are presented in Fu et al.,40 Fu and Kawamura,41 and Fu et al.42.
The biomass burning contribution to black carbon was approximated according to the method by Sandradewi et al.43 This attribution to biomass burning involves calculating an absorption coefficient at 950 nm with the assumption that the Angstrom exponent for biomass burning black carbon equals to 2.
The number of factors selected were due to the solutions' ability to resolve factors containing m/z 60 – five at COALA, four at KCG May 2021. This is elaborated further in Section 3.2. May 2021 was selected as a subset of the KCG measurements due to there being appreciable biomass burning activity during the period (Fig. 3c).
3. Results
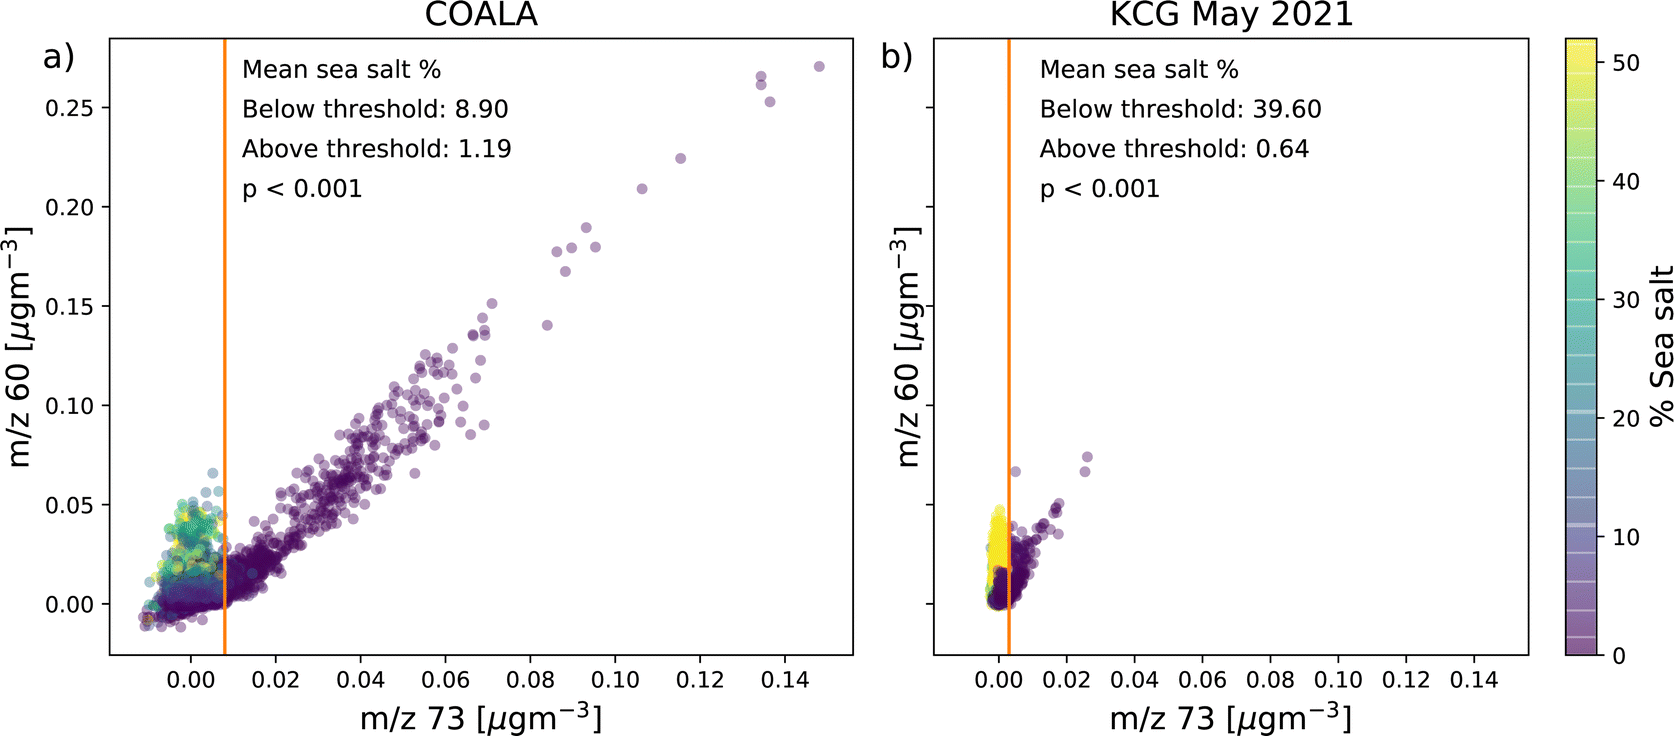
This section reports results of analysis from COALA and KCG.In Section 3.1, the relationships between concentrations at m/z 60 and m/z 73 are explained, before attempting to separate the concentration of m/z 60 that originates from sea salt (sea salt-60) or biomass burning (biomass burning-60). This is achieved by proposing a threshold concentration of m/z 73 at each site that represents the point beyond which OA at the relevant location is produced from biomass burning events (Fig. 2). Finally, the concentration of m/z 73 is correlated with levoglucosan at COALA and the biomass burning fraction of black carbon (BC_bb) at KCG to verify that m/z 73 is a reliable marker for biomass burning, especially at concentrations above the proposed thresholds (Fig. 3).
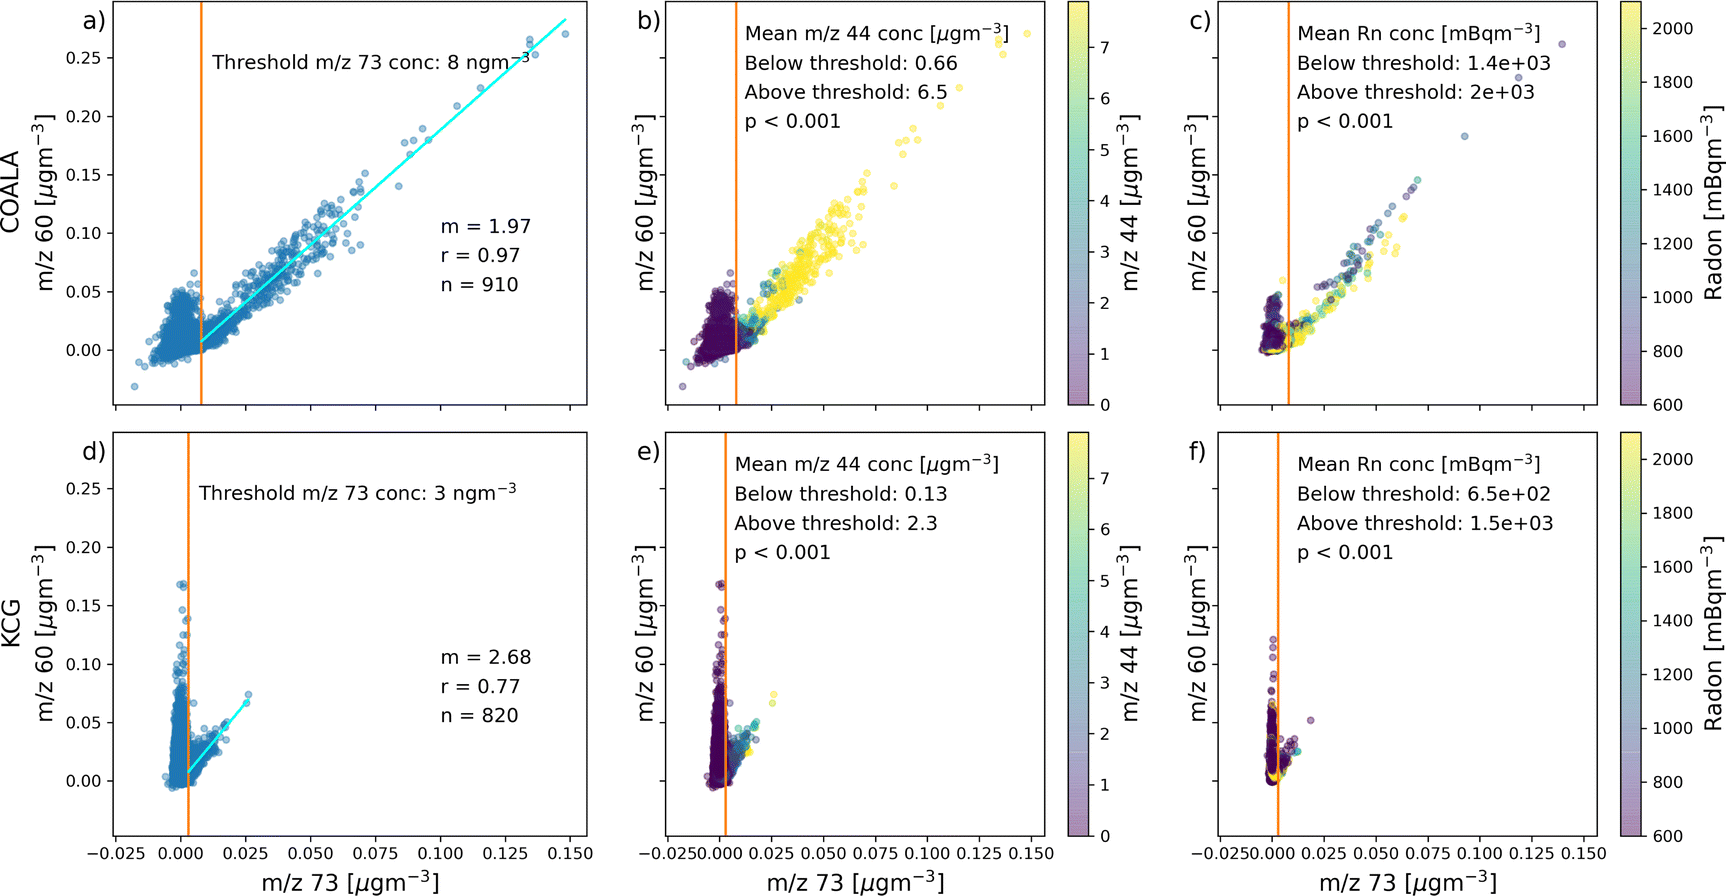 | ||
| Fig. 2 Left column: distinguishing between the two sources of m/z 60 by applying a biomass burning threshold concentration of m/z 73 for COALA (a) and KCG (d). Parameters of the slope for points above the thresholds are shown, with n being the number of points above the thresholds at each location. Middle column: concentrations of m/z 60 and m/z 73 shaded by that of m/z 44 at COALA (b) and KCG (e). Right column:concentrations of m/z 60 and m/z 73 shaded by that of radon at COALA (c) and KCG (f). Note that CV-ToF-ACSM concentrations in were integrated over 30 minutes in (c) and over 60 minutes in (f). p-Values quoted are the result of independent t-tests comparing mean concentrations of m/z 44 and radon (where appropriate) above and below m/z 73 threshold concentration at each site. | ||
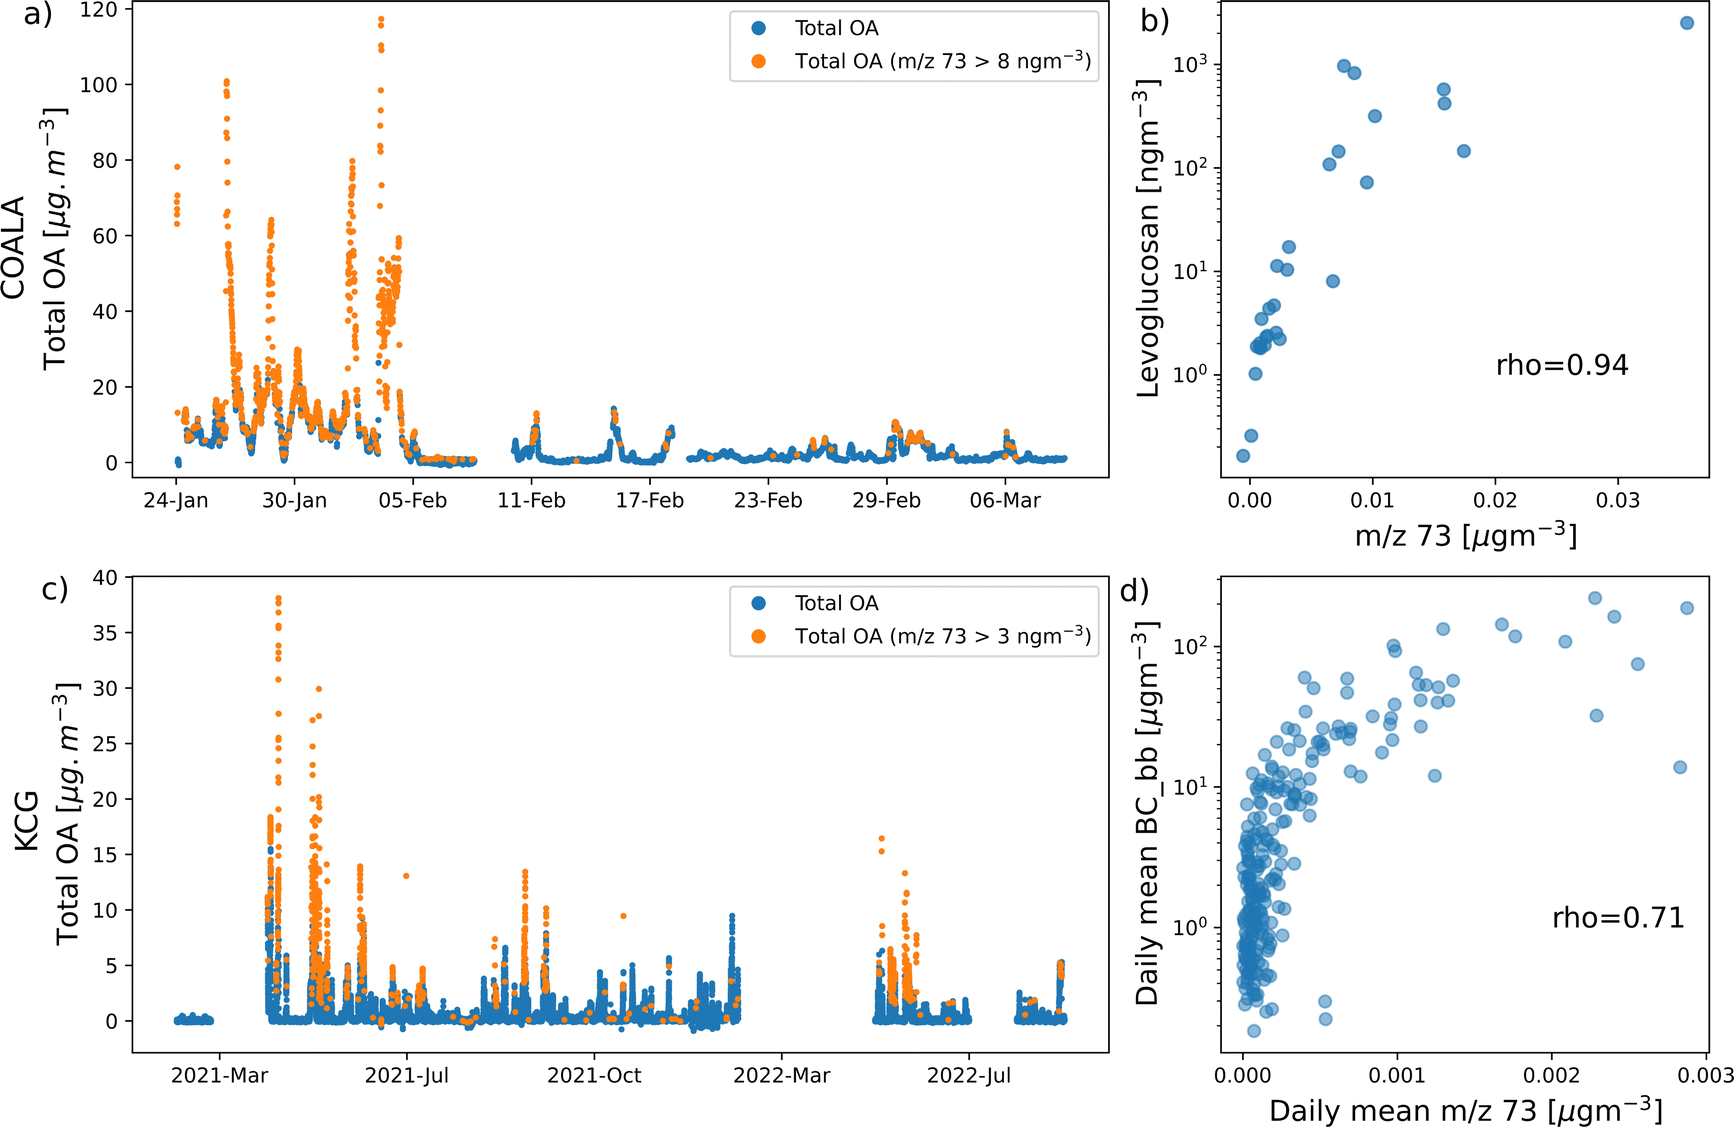 | ||
| Fig. 3 Left column: timeseries of total OA concentration throughout the sampling periods at COALA (a) and KCG (c), with points in which m/z 73 concentration exceeds the biomass burning threshold at their respective locations. Right column: correlation plot of integrated m/z 73 concentrations and filter levoglucosan collected over periods of between 22 and 50 hours in COALA (b) and daily mean concentration of BC_bb at KCG (d). | ||
Then, in Section 3.2, data from both COALA and KCG are used as inputs into PMF, where the resulting factors (particularly those that contain m/z 60) are analysed to identify whether they originate from sea salt or biomass burning. PMF is able to resolve different sources of species by identifying different ratios between them and other species, as well as total concentration. Plotting concentrations of m/z 60 against total OA shows multiple branches of m/z 60, implying different sources of the ion. The ratio between m/z 60 and total OA in each factor can be superimposed on the m/z 60 vs. total OA correlation plot as a linear slope, and an effective PMF solution should produce factors that replicate as many different branches of m/z 60 vs. total OA as possible. Such correlation plots can be found in Fig. 4a for COALA and Fig. 5a for KCG. Additionally, timeseries for each factor containing substantial f60 were correlated with radon and biomass burning marker species (levoglucosan at COALA and BC_bb at KCG) to help distinguish their sources, which can be found in Fig. 4b and 5b, respectively.
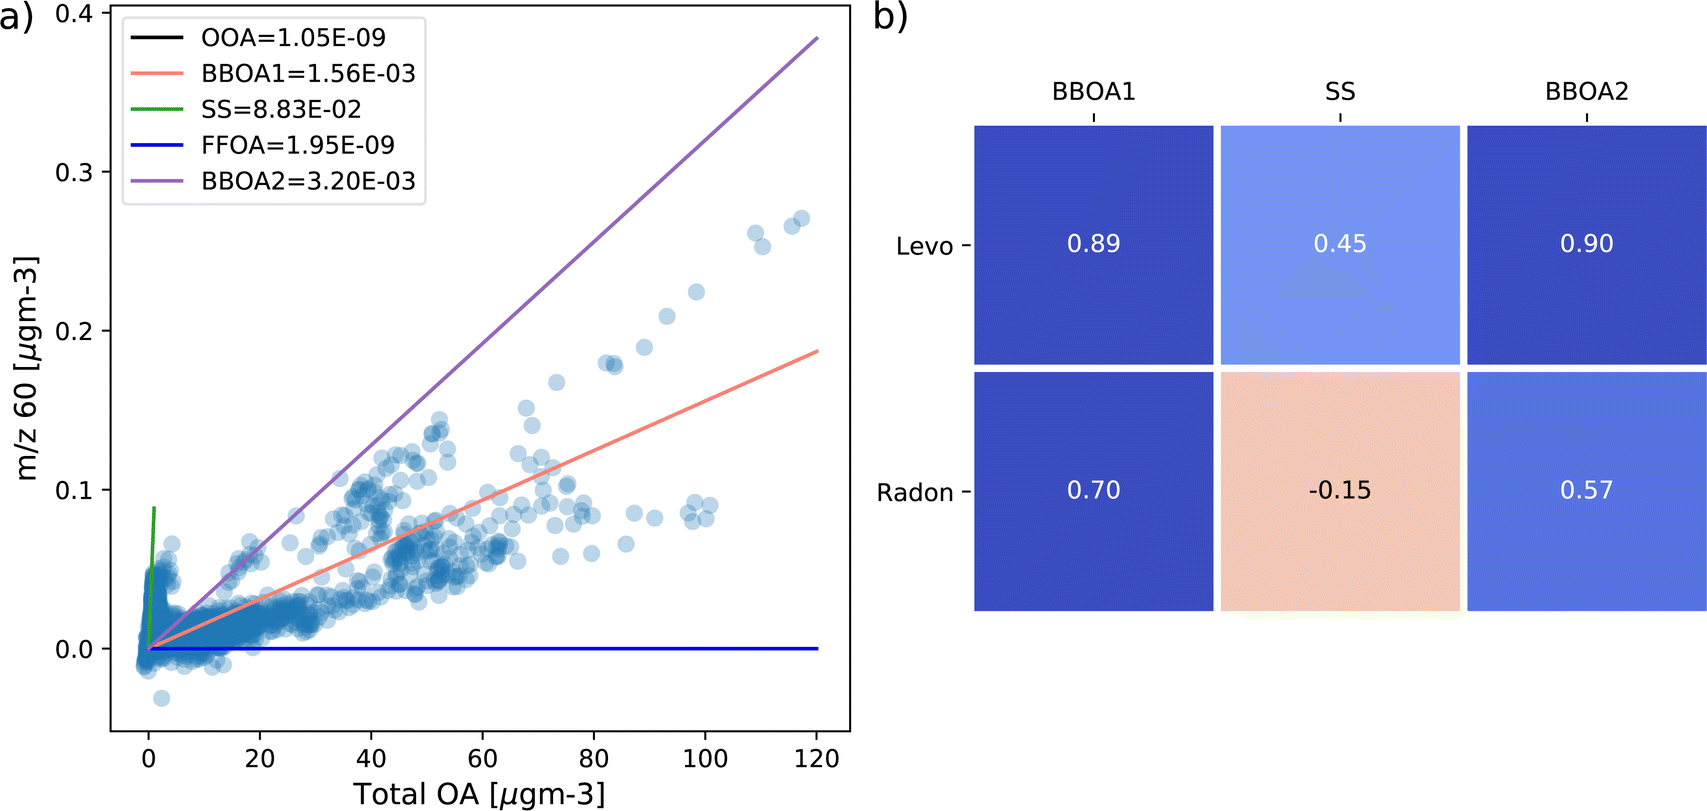 | ||
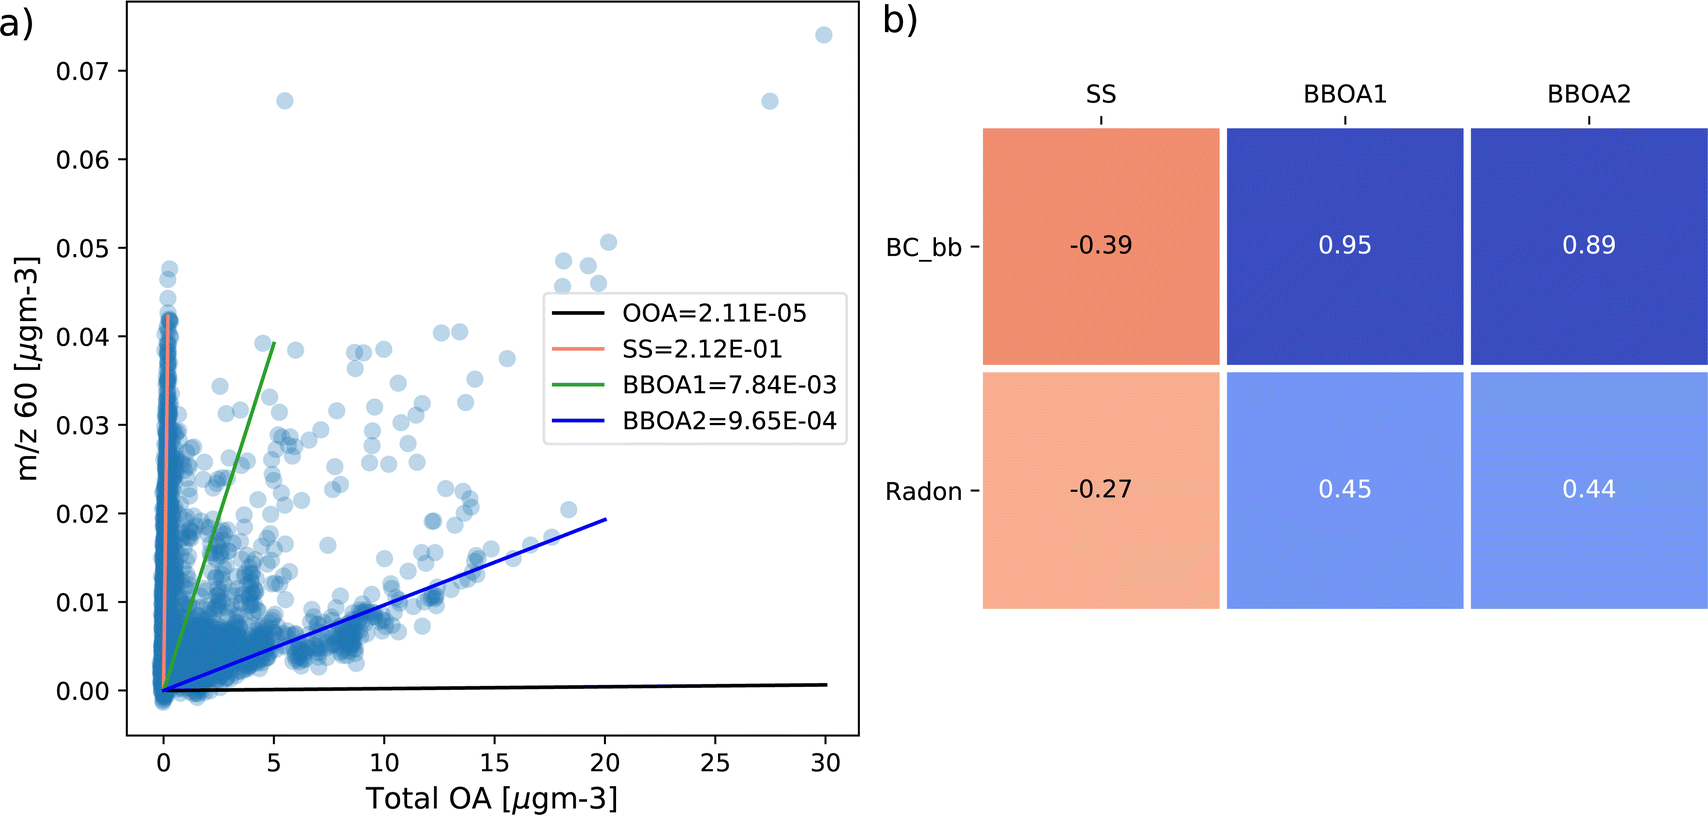
| Fig. 4 (a) Concentrations of m/z 60 against concentrations of total OA at COALA, superimposed with lines that use f60 of each factor from the COALA 5-factor PMF solution as their gradient. Values of f60 for each factor are quoted in the legend; (b) Spearman's ρ coefficients between the concentrations of PMF factors from the COALA 5-factor solution that contain m/z 60 (BBOA1, sea salt, and BBOA2) with levoglucosan (top) and radon (bottom). | ||
 | ||
| Fig. 5 (a) Concentrations of m/z 60 against concentrations of total OA at KCG from May 2021, superimposed with lines that use f60 of each factor from the KCG May 2021 4-factor PMF solution as their gradient. Values of f60 for each factor are quoted in the legend.; (b) Spearman's ρ coefficients between the concentrations of PMF factors from the KCG May 2021 4-factor solution that contain m/z 60 (sea salt, BBOA1, and BBOA2) with levoglucosan (top) and radon (bottom). | ||
3.1 m/z 60 vs. m/z 73
At both COALA and KCG, the correlation plot of concentrations at m/z 60 and m/z 73 observed in Fig. 2a and d, respectively, show two branches of points: one that illustrates a strongly positive linear relationship between m/z 60 and m/z 73 concentrations and another where the correlation between the two marker ions appear to be weaker, with elevated concentration of m/z 60 occurring at low concentrations of m/z 73. The two branches can be distinguished by being on either side of a threshold concentration of m/z 73, which is 8 ng m−3 at COALA and 3 ng m−3 at KCG. While the detection limit for m/z 73 for this study was determined to be 4.2 ng m−3 and therefore slightly higher than the threshold concentration at KCG, it should be noted that many of the m/z 60 concentrations associated with lower m/z 73 concentration well-exceeded the m/z 60 detection limit of 3.4 ng m−3.The linear regression lines between m/z 60 and m/z 73 above the threshold concentrations at both locations show strong positive linear correlations (r = 0.97 at COALA and r = 0.77 at KCG). This indicates that the branch of points below the m/z 73 threshold concentrations represent periods where m/z 60 is predominantly sea salt-60, whereas the branch above the m/z 73 threshold concentrations represents the periods where m/z 60 is mainly biomass burning-60.
Shading that represents m/z 44 concentrations (a marker for the carboxyl groups oxygenated organic compounds) in Fig. 2b and e show that points above the m/z 73 threshold concentrations are associated with high levels of organic particles, while points below the thresholds are related to m/z 44 concentrations that approach zero. This is reflected by the mean m/z 44 concentration of 6.5 μg m−3 at COALA and 2.3 μg m−3 at KCG, whereas the mean m/z 44 concentrations are 0.66 μg m−3 at COALA and 0.13 μg m−3 at KCG. At both locations, the mean concentration of m/z 44 above and below the m/z 73 threshold were compared using an independent t-test and were significantly different (p < 0.001).
A similar pattern can be observed with radon concentrations, illustrated in Fig. 2c and f. The mean radon concentration points above the m/z 73 thresholds are higher than that of points below the thresholds (mean radon concentrations of 2.0 × 10³ mBqm−3 at COALA and 1.5 × 10³ mBqm−3 at KCG above the thresholds, compared to 1.4 × 10³ mBqm−3 at COALA and 6.5 × 10² at KCG below the thresholds). Note that because radon was measured at time-resolutions of 30 minutes at COALA and 60 minutes at KCG, the concentrations of m/z 60 and m/z 73 in Fig. 2c and f were also integrated accordingly. At both locations, the mean concentration of radon above and below the m/z 73 threshold were compared using an independent t-test and were significantly different (p < 0.001).
Fig. 3a and c show that at both COALA and KCG, points where m/z 73 concentration exceeded the thresholds coincided with periods of high concentrations of total OA, the primary contributor to which is likely biomass burning events. This is corroborated by Fig. 3b and d, which illustrate that m/z 73 is strongly positively correlated with biomass burning marker species, such as levoglucosan in COALA (Spearman's ρ = 0.94) and BC_bb in KCG (ρ = 0.71).
It should be noted that because the filter samples of levoglucosan in COALA were collected over periods of between 22 and 50 hours, the concentration of m/z 73 were integrated over each sample's collection period. BC_bb m/z 73 concentrations were also averaged over 24 hours in the KCG correlation.
While it might be reasonable to expect a linear relationship between a biomass burning marker ion and levoglucosan/BC_bb, the relationship between m/z 73 and levoglucosan/BC_bb does not have to be linear to be indicative of a positive correlation. In addition, when conducting a linear regression between m/z 73 and the BBOA marker species, there is nothing in the residuals that suggests that m/z 73 is not positively correlated with either species.
3.2 PMF
At COALA, the five-factor solution produced factors representing oxygenated OA, sea salt aerosols, a likely fossil fuels OA, and two factors representing BBOA (Fig. S5†). Of these five, the sea salt and two BBOA factors contained substantial f60. The COALA-sea salt factor (represented by the green line in Fig. 4a) has an f60 of 8.83 × 10⁻² and is the highest value across the five factors. When superimposed on the m/z 60 vs. total OA correlation plot, the line with COALA-sea salt's slope corresponds to the branch of m/z 60 with the lowest total OA concentration, likely the subset of m/z 60 that originated from sea salt. In this factor's profile (Fig. S5†), the ratio between f60 and f58 is 0.311, which matches the isotopic ratio of 37Cl to 35Cl in NaCl.48 The sea salt factor also contains 63% of m/z 58 and 68% of m/z 60, while containing less than 5% of m/z 73 (Fig. S5†). Moreover, it is the only factor in this PMF solution containing m/z 60 that is negatively correlated with radon (Spearman's ρ = −0.15, Fig. 4b).The two factors representing COALA-BBOA1 (pink) and COALA-BBOA2 (purple) respectively have f60 values of 1.56 × 10⁻³ and 3.20 × 10⁻³, both of which approximate separate branches of m/z 60 vs. total OA (Fig. 4a). Of the factors that contain m/z 60, Fig. 4b shows they are both more strongly positively correlated with levoglucosan concentrations measured at COALA compared to COALA-sea salt (ρ = 0.89 for COALA-BBOA1 and 0.90 for COALA-BBOA2, compared to 0.45 for COALA-sea salt). Cumulatively, the COALA BBOA factors contain almost 75% of m/z 73 and over 30% of m/z 60, as well as negligible m/z 58 (Fig. S5†). In addition, both COALA-BBOA1 and COALA-BBOA2 contain a prominent peak at m/z 55 (Fig. S5†), which are similar to the peak at m/z 55 in the levoglucosan standards in Fig. S1† and Hu et al.20
Similarly, at KCG, the four-factor solution from May 2021 data produced an oxygenated OA factor, a sea salt factor, and two factors representing BBOA (Fig. S6†), where the sea salt and BBOA factors contained f60 that was notable. Like the sea salt factor identified in COALA, KCG-sea salt (the pink line in Fig. 5a) also has the highest f60 among the four factors at 2.12 × 10⁻¹ that corresponds with high m/z 60 concentrations and low total OA. KCG-sea salt contains over 90% of m/z 58 and m/z 60 (Fig. S6†), both higher proportions than COALA-sea salt. There is negligible m/z 73 in KCG-Sea Salt. The ratio between its f60 and f58 (seen in Fig. S6†) of 0.305 also resembles chlorine's isotopic ratio. As with COALA, this factor is also the only one to be negatively correlated with radon (ρ = −0.27, Fig. 5b).
The other factors that correspond with branches of m/z 60 are KCG-BBOA1 (green) and KCG-BBOA2 (blue), have respective f60 values of 7.84 × 10⁻³ and 9.65 × 10⁻⁴ (Fig. 5a). KCG-BBOA1 and KCG-BBOA2 are also shown to be positively correlated with BC_bb (ρ = 0.95 and 0.89 respectively), as opposed to KCG-sea salt which showed a negative correlation with BC_bb (ρ = −0.39), illustrated in Fig. 5b. Together, both KCG-BBOA factors contain over 60% of m/z 73 and nearly 9% of m/z 60, as well as just under 3% of m/z 73. In addition, KCG-BBOA1 and KCG-BBOA2 also have an outstanding peak at m/z 55 (Fig. S6†), much like those found in the levoglucosan standards mass spectra in Fig. S1† and Hu et al.20.
Lastly, shading the correlation plot between m/z 60 and m/z 73 with the percentage of sea salt factor concentration in total OA shows that the proportion of the sea salt factors are significantly higher in points below the m/z 73 threshold concentrations compared to above at both sites (Fig. 6). At COALA, the mean percentage of sea salt was 8.90% below the threshold and 1.19% above (p < 0.001); while at KCG, the mean % of sea salt was 39.60% below the threshold and 0.64% above (p < 0.001).
 | ||
| Fig. 6 Concentrations of m/z 60 and m/z 73 shaded by the percentage of total OA concentration from each location's sea salt factor at COALA (a) and KCG in May 2021 (b). p-Values quoted are the result of independent t-tests comparing mean percentages of sea salt concentration above and below m/z 73 threshold concentration at each site. | ||
4. Discussion
Unlike most studies that have deployed the CV-AMS or CV-ACSM to study BBOA, this study was conducted in locations that are expected to receive a measurable loading of sea salt aerosols due to their proximity to coastlines. Consequently, measurements taken at KCG and COALA exhibited concentrations of Na37Cl+ at m/z 60 that (a) were not detected in measurements from other studies in inland locations and (b) are on the same order of magnitude as measurements of C2H4O2+ at the same molecular mass without tuning the instruments so that sea salt can be detected.This was verified by the finding that points where the concentration of m/z 60 was not correlated to that of m/z 73 were also associated with lower radon and m/z 44 concentrations at both study locations, as well as PMF being able to produce a factor containing m/z 60 that was more strongly correlated with sea salt markers rather than those of biomass burning. To date, this phenomenon has not been previously reported from studies employing the CV-AMS or CV-ACSM. The fact that, when using the CV-ToF-ACSM which operates at unit mass resolution, these markers of sea salt and BBOA have the same molecular mass means that studies that use the CV-ACSM in coastal locations during biomass burning events need to consider this additional source of m/z 60 and distinguish the two sources.
This study also shows that beyond a site-specific threshold concentration of m/z 73, there is a strong correlation between m/z 73 and m/z 60 that represents the presence of BBOA. Verification that this strongly correlated relationship between m/z 60 and m/z 73 in fact represents BBOA can be found in the positive correlations between m/z 73 and levoglucosan in COALA and BC_bb in KCG.
The differences in concentrations of m/z 60 from the two sources were representative of the difference in environments of the two study locations, where COALA experienced much greater biomass burning-60 being situated immediately adjacent to severe bushfires, while KCG exhibited higher sea salt-60 concentration being located directly on the coast (average of 9.47 ng m−3, compared to 8.14 ng m−3 at COALA, shown in Fig. 2). The presence of sea salt in a location like COALA is still likely, as shown in measurements of particles in nearby Sydney.49
As a consequence of there being greater biomass burning activity close to the instrument in COALA, the threshold concentration of m/z 73 at which a biomass burning event can be confidently identified is higher than that found at KCG. This is possibly due to periods where sea salt particles are transported at the same time as biomass burning events, a phenomenon that occurred more frequently in the clear portion of the COALA-2020 campaign.
Periods within the COALA-2020 campaign can also be distinguished by differences in amount of biomass burning activity, which are reflected in CV-ToF-ACSM, levoglucosan, and radon measurements. Fig. S2† shows that during the early parts of the campaign (before 4 February) were characterised by extremely high temperatures, while Fig. S3† shows that this period observed the highest concentrations of total OA and levoglucosan. Several days of heavy rain followed, after which temperatures largely cooled, accompanied by reductions in total OA and levoglucosan.
Fig. S4† then illustrates that a large proportion of points that correspond to high sea salt-60 concentration in COALA occurred during this cooler, clearer period, coinciding with points where radon concentration are typically low (Fig. 2c). At KCG, radon is less effective at distinguishing between dominant periods for sea salt-60 and biomass burning-60 due to (a) less biomass burning activity and (b) air with relatively high radon concentration typically still has detectable concentrations of sea salt due to the location being directly on the coast, as well as being on an island.
While PMF solutions at both COALA and KCG resolved a factor representing sea salt aerosols, both solutions also each produced two factors that contained m/z 60 that were well-correlated with biomass burning marker species. It is still possible for these two factors to represent BBOA, but their distinctions may lie in the other ions present in the factors' spectra, e.g., COALA-BBOA2 possessing higher f44 than COALA-BBOA1 (Fig. S5†), which could mean that COALA-BBOA2 is associated with BBOA that is more aged/oxidized. Moreover, while prominent peaks in the factors that are well-correlated with biomass burning marker species like m/z 55, m/z 57, m/z 41, and m/z 43 are present in the mass spectra of biomass burning factors in Xu et al.,50 Zheng et al.,51 Joo et al.,52 and Lei et al.;53 those peaks are also present in the factors representing OA from cooking and fossil fuel combustion. A more detailed analysis and source apportionment of each factor's contents is a subject for further study.
Another topic that warrants further study is using the PMF factors' mass spectra to identify marker ions for BBOA that are more suitable to measurements using the capture vaporizer than m/z 60 given its associated potential interferences. Spectra from levoglucosan standards (Fig. S1†) as well as PMF factors (Fig. S5 and S6†) all have m/z 55 as prominent peaks, in addition to proposed alternative ions from Hu et al.20 such as m/z 26, m/z 56, and m/z 80 can be evaluated.
This study successfully identified the presence of m/z 60 concentrations from sea salt by both investigating its relationship with m/z 73, which identified the two sources of m/z 60 that possessed highly different properties, and analysing the diverging characteristics of PMF factors that contained m/z 60. While PMF was able to decompose both datasets into several distinct particle sources, the contrast between the chemical characteristics of m/z 60 on either side of the m/z 73 threshold concentrations at both sites helped to find that the factor containing the most m/z 60 at both sites was of marine origin.
5. Conclusions
The development of the capture vaporizer has reduced uncertainties in measurements using the AMS and ACSM, but studies investigating its effects have also shown that instruments using the capture vaporizer exhibit different fragmentation patterns in organic molecular species compared to those that use the standard vaporizer, while also being more likely to detect refractory particles such as sea salt. Despite this change in fragmentation to BBOA marker levoglucosan, studies that use the CV-AMS and CV-ACSM to measure BBOA found that the marker ions m/z 60 and m/z 73 used in instruments with the standard vaporizer were still applicable in those with the capture vaporizer.This study shows the difference in measurements between previous studies that were overwhelmingly conducted in inland locations (100 km from the coast or more) to those collected from coastal locations (maximum 25 km inland) during the COALA-2020 campaign in Cataract, New South Wales and Kennaook-Cape Grim, Tasmania. In the coastal locations, non-negligible concentrations of m/z 60 were observed using the CV-ToF-ACSM that resulted from the detection of Na37Cl+ from sea salt, which the CV-ToF-ACSM can more easily detect with the capture vaporizer.
Measurements in these locations also detected periods where m/z 60 and m/z 73 displayed strong positive correlations, which represent periods where m/z 60 originated from the ion C2H4O2+ from biomass burning events. These biomass burning events were verified by the strong positive correlations with biomass burning markers in collocated measurements (levoglucosan in COALA and biomass burning black carbon in KCG). These findings were further corroborated by PMF analysis that produced multiple factors containing m/z 60, where one was well-correlated with sea salt markers while others were more strongly associated with biomass burning markers. As such, when using a CV-ACSM that measures at unit mass resolution in coastal locations to observe BBOA, it is important to consider the effect of sea salt measurements that interfere at m/z 60 that can be identified through a combination of setting thresholds of m/z 73 concentration, verification using other instrumental data, and conducting PMF analysis of the CV-AMS/ACSM measurements.
6. Future work
As mentioned in Section 4, the PMF analyses conducted in this study can be expanded upon by further examining the chemical nature of the PMF factors produced, including characterizing the types of BBOA associated with factors that contain m/z 60. Another method of separating the sea salt influence from organics measurements that is worth investigating further is adjusting the fragmentation table and utilizing known ratios between sea salt marker ions. Also, other prominent ions in the BBOA factors' spectra can be assessed for their suitability as marker ions in measurements made using a capture vaporizer, building on work described in Hu et al.20. Finally, the mechanisms that lead to capture vaporizer-AMS and ACSMs being able to measure sea salt and potentially other refractory particles is also a subject that warrants further study, both environmental (e.g., how far inland can sea salt be detected by capture vaporizer-AMS and ACSMs) and instrumental (e.g., what proportion of sea salt particles in the PM1 fraction is measured by capture vaporizer-AMS and ACSMs).Author contributions
Conceptualisation: AS; data curation: AS, MK, CPW, JS, CM, QD, MM, SO, SA, BK, KK, RH, ED, JW, JH, FR, KE, AG, AW, RS, PR; formal Analysis: AS, JS, CM; investigation: AS, MK, CPW, JS, CM, QD, MM, SO, SA, BK, KK, RH, ED, JW, JH, FR, KE, AG, AW, RS, PR; project administration: CPW; supervision: MK, RS, PR; visualisation: AS, MK, CPW, KE; writing (original draft): AS; writing (review & editing): AS, MK, CPW, MM, BK, JW, JH, KE, AW, RS, PR.Conflicts of interest
There are no conflicts to declare.Acknowledgements
Ruichen Zhou supported the determination of the response factor of levoglucosan for GC-MS analysis. Doug Worsnop provided helpful advice. This work was funded by the University of Melbourne's Melbourne Research Scholarship and CSIRO's Research + Top-Up Scholarship.References
- J. Haywood, in Atmospheric Aerosols and Their Role in Climate Change, Elsevier, 2016, pp. 449–463 Search PubMed.
- P. Forster, T. Storelvmo, K. Armour, W. Collins, J.-L. Dufresne, D. Frame, D. J. Lunt, T. Mauritsen, M. D. Palmer, M. Watanabe, M. Wild and H. Zhang, in The Earth's Energy Budget, Climate Feedbacks and Climate Sensitivity, ed. V. Masson-Delmotte, P. Zhai, A. Pirani, S. L. Connors, C. Péan, S. Berger, N. Caud, Y. Chen, L. Goldfarb, M. I. Gomis, M. Huang, K. Leitzell, E. Lonnoy, J. B. R. Matthews, T. K. Maycock, T. Waterfield, O. Yelekçi, R. Yu and B. Zhou, Cambridge University Press, 2021, pp. 923–1054 Search PubMed.
- M. Canagaratna, J. Jayne, J. Jimenez, J. Allan, M. Alfarra, Q. Zhang, T. Onasch, F. Drewnick, H. Coe, A. Middlebrook, A. Delia, L. Williams, A. Trimborn, M. Northway, P. DeCarlo, C. Kolb, P. Davidovits and D. Worsnop, Mass Spectrom. Rev., 2007, 26, 185–222 CrossRef CAS PubMed.
- N. L. Ng, S. C. Herndon, A. Trimborn, M. R. Canagaratna, P. L. Croteau, T. B. Onasch, D. Sueper, D. R. Worsnop, Q. Zhang, Y. L. Sun and J. T. Jayne, Aerosol Sci. Technol., 2011, 45, 780–794, DOI:10.1080/02786826.2011.560211.
- R. Fröhlich, M. J. Cubison, J. G. Slowik, N. Bukowiecki, A. S. Prévôt, U. Baltensperger, J. Schneider, J. R. Kimmel, M. Gonin, U. Rohner, D. R. Worsnop and J. T. Jayne, Atmos. Meas Tech., 2013, 6, 3225–3241 CrossRef.
- L. Hildebrandt, G. J. Engelhart, C. Mohr, E. Kostenidou, V. A. Lanz, A. Bougiatioti, P. F. DeCarlo, A. S. H. Prevot, U. Baltensperger, N. Mihalopoulos, N. M. Donahue and S. N. Pandis, Atmos. Chem. Phys., 2010, 10, 4167–4186 CrossRef CAS.
- Q. Zhu, L.-Y. He, X.-F. Huang, L.-M. Cao, Z.-H. Gong, C. Wang, X. Zhuang and M. Hu, Atmos. Chem. Phys., 2016, 16, 10283–10297 CrossRef CAS.
- A. L. Robinson, N. M. Donahue, M. K. Shrivastava, E. A. Weitkamp, A. M. Sage, A. P. Grieshop, T. E. Lane, J. R. Pierce and S. N. Pandis, Science, 2007, 315, 1259–1262 CrossRef CAS PubMed.
- C. Mohr, P. F. DeCarlo, M. F. Heringa, R. Chirico, J. G. Slowik, R. Richter, C. Reche, A. Alastuey, X. Querol, R. Seco, J. Peñuelas, J. L. Jiménez, M. Crippa, R. Zimmermann, U. Baltensperger and A. S. H. Prévôt, Atmos. Chem. Phys., 2012, 12, 1649–1665 CrossRef CAS.
- A. P. Grieshop, J. M. Logue, N. M. Donahue and A. L. Robinson, Atmos. Chem. Phys., 2009, 9, 1263–1277 CrossRef CAS.
- C. Y. Lim, D. H. Hagan, M. M. Coggon, A. R. Koss, K. Sekimoto, J. D. Gouw, C. Warneke, C. D. Cappa and J. H. Kroll, Atmos. Chem. Phys., 2019, 19, 12797–12809 CrossRef CAS.
- L. Zhou, T. Liu, D. Yao, H. Guo, C. Cheng and C. K. Chan, Sci. Total Environ., 2021, 794, 148638 CrossRef CAS PubMed.
- W. Zhu, S. Guo, Z. Zhang, H. Wang, Y. Yu, Z. Chen, R. Shen, R. Tan, K. Song, K. Liu, R. Tang, Y. Liu, S. Lou, Y. Li, W. Zhang, Z. Zhang, S. Shuai, H. Xu, S. Li, Y. Chen, M. Hu, F. Canonaco and A. S. Prévôt, Atmos. Chem. Phys., 2021, 21, 15065–15079 CrossRef CAS.
- Y. Cheng, C. J. Hu, Y. B. Gai, X. J. Gu, W. X. Zhao, W. Huang and W. J. Zhang, Chin. J. Chem. Phys., 2013, 26, 484 CrossRef CAS.
- M. F. Link, T. B. Nguyen, K. Bates, J. F. Müller and D. K. Farmer, ACS Earth Space Chem., 2020, 4, 730–740 CrossRef CAS.
- R. Bahreini, B. Ervens, A. M. Middlebrook, C. Warneke, J. A. D. Gouw, P. F. DeCarlo, J. L. Jimenez, C. A. Brock, J. A. Neuman, T. B. Ryerson, H. Stark, E. Atlas, J. Brioude, A. Fried, J. S. Holloway, J. Peischl, D. Richter, J. Walega, P. Weibring, A. G. Wollny and F. C. Fehsenfeid, J. Geophys. Res. Atmos., 2009, 114, 1–16 CrossRef.
- B. M. Matthew, A. M. Middlebrook and T. B. Onasch, Aerosol Sci. Technol., 2008, 42, 884–898 CrossRef CAS.
- J. T. Jayne and D. R. Worsnop, Particle capture device, US Pat. 9267869 B2,Ref. 18: Please provide the patent type. 2016.
- W. Hu, P. Campuzano-Jost, D. A. Day, P. Croteau, M. R. Canagaratna, J. T. Jayne, D. R. Worsnop and J. L. Jimenez, Aerosol Sci. Technol., 2017, 51, 735–754 CrossRef CAS.
- W. Hu, D. A. Day, P. Campuzano-Jost, B. A. Nault, T. Park, T. Lee, P. Croteau, M. R. Canagaratna, J. T. Jayne, D. R. Worsnop and J. L. Jimenez, Aerosol Sci. Technol., 2018, 52, 725–739 CrossRef CAS.
- C. Mynard, E. Dunne, R. Humphries, A. Patti, M. Keywood and J. Harnwell, 2023, in preparation.
- S. S. Petters, E. R. Kjærgaard, F. Hasager, A. Massling, M. Glasius and M. Bilde, Phys. Chem. Chem. Phys., 2023, 32430–32442 RSC.
- J. Schneider, S. Weimer, F. Drewnick, S. Borrmann, G. Helas, P. Gwaze, O. Schmid, M. Andreae and U. Kirchner, Int. J. Mass Spectrom., 2006, 258, 37–49 CrossRef CAS.
- M. R. Alfarra, A. S. H. Prevot, S. Szidat, J. Sandradewi, S. Weimer, V. A. Lanz, D. Schreiber, M. Mohr and U. Baltensperger, Environ. Sci. Technol., 2007, 41, 5770–5777 CrossRef CAS PubMed.
- Y. Kuang, Y. He, W. Xu, P. Zhao, Y. Cheng, G. Zhao, J. Tao, N. Ma, H. Su, Y. Zhang, J. Sun, P. Cheng, W. Yang, S. Zhang, C. Wu, Y. Sun and C. Zhao, Atmos. Chem. Phys., 2020, 20, 865–880 CrossRef CAS.
- U. Sofowote, R. Healy, Y. Su, J. Debosz, M. Noble, A. Munoz, C.-H. Jeong, J. Wang, N. Hilker, G. Evans, J. Brook, G. Lu and P. Hopke, Sci. Total Environ., 2021, 761, 143225 CrossRef CAS PubMed.
- V. Lalchandani, D. Srivastava, J. Dave, S. Mishra, N. Tripathi, A. K. Shukla, R. Sahu, N. M. Thamban, S. Gaddamidi, K. Dixit, D. Ganguly, S. Tiwari, A. K. Srivastava, L. Sahu, N. Rastogi, P. Gargava and S. N. Tripathi, J. Geophys. Res. Atmos., 2022, 127, e2021JD035232 CrossRef CAS.
- J. Ovadnevaite, D. Ceburnis, M. Canagaratna, H. Berresheim, J. Bialek, G. Martucci, D. R. Worsnop and C. O’Dowd, J. Geophys. Res. Atmos., 2012, 117, D16201 CrossRef.
- E. Freney, K. Sellegri, A. Nicosia, L. R. Williams, M. Rinaldi, J. T. Trueblood, A. S. H. Prévôt, M. Thyssen, G. Grégori, N. Haëntjens, J. Dinasquet, I. Obernosterer, F. V. Wambeke, A. Engel, B. Zäncker, K. Desboeufs, E. Asmi, H. Timonen and C. Guieu, Atmos. Chem. Phys., 2021, 21, 10625–10641 CrossRef CAS.
- C. Lin, D. Ceburnis, R.-J. Huang, W. Xu, T. Spohn, D. Martin, P. Buckley, J. Wenger, S. Hellebust, M. Rinaldi, M. C. Facchini, C. O'Dowd and J. Ovadnevaite, Atmos. Chem. Phys., 2019, 19, 14091–14106 CrossRef CAS.
- NSW Department of Planning and Environment, NSW State Vegetation Type Map, 2023, https://datasets.seed.nsw.gov.au/dataset/nsw-state-vegetation-type-map.
- S. M. Davey and A. Sarre, Aust. For., 2020, 83, 47–51 CrossRef.
- State Government of NSW and NSW Department of Climate Change, Energy, the Environment and Water 2022, NSW State Vegetation Type Map, accessed from The Sharing and Enabling Environmental Data Portal, https://datasets.seed.nsw.gov.au/dataset/95437fbd-2ef7-44df-8579-d7a64402d42d Search PubMed.
- J. B. Simmons, C. Paton-Walsh, A. P. Mouat, J. Kaiser, R. S. Humphries, M. Keywood, D. W. T. Griffith, A. Sutresna, T. Naylor and J. Ramirez-Gamboa, Air Qual., Atmos. Health, 2022, 15, 2067–2089 CrossRef CAS.
- Department of Natural Resources and Environment Tasmania, TASVEG – the Digital Vegetation Map of Tasmania, 2018, https://nre.tas.gov.au/conservation/development-planning-conservation-assessment/planning-tools/monitoring-and-mapping-tasmanias-vegetation-(tasveg)/tasveg-the-digital-vegetation-map-of-tasmania Search PubMed.
- A. D. Griffiths, A. G. Williams, S. D. Chambers, T. A. Naylor, J. B. Simmons, J. Ramirez-Gamboa, A. Webb, Q. P. Dang, A. Carter and C. Paton-Walsh, Radon-222 Measurements at Cataract Scout Park, Australia, Taken during the COALA-2020 Campaign, 2021, doi: DOI:10.1594/PANGAEA.928372.
- S. Chambers, A. Williams, W. Zahorowski, A. Griffiths and J. Crawford, Tellus B, 2011, 63, 843–859 CrossRef CAS.
- S. Whittlestone and W. Zahorowski, J. Geophys. Res. Atmos., 1998, 103, 16743–16751 CrossRef CAS.
- A. Williams and S. Chambers, in A History of Radon Measurements at Cape Grim, ed. N. Derek, P. Krummel and S. Cleland, BoM and CSIRO, 2021, pp. 9–26 Search PubMed.
- P. Fu, K. Kawamura, K. Okuzawa, S. G. Aggarwal, G. Wang, Y. Kanaya and Z. Wang, J. Geophys. Res. Atmos., 2008, 113, D19107 Search PubMed.
- P. Fu and K. Kawamura, Geochem. J., 2011, 45, 297–308 CrossRef CAS.
- P. Fu, K. Kawamura and K. Miura, J. Geophys. Res., 2011, 116, D13302 CrossRef.
- J. Sandradewi, A. S. Prévôt, S. Szidat, N. Perron, M. R. Alfarra, V. A. Lanz, E. Weingartner and U. R. Baltensperger, Environ. Sci. Technol., 2008, 42, 3316–3323 CrossRef CAS PubMed.
- P. Paatero and U. Tapper, Environmetrics, 1994, 5, 111–126 CrossRef.
- I. M. Ulbrich, M. R. Canagaratna, Q. Zhang, D. R. Worsnop and J. L. Jimenez, Atmos. Chem. Phys., 2009, 9, 2891–2918 CrossRef CAS.
- P. Paatero and P. K. Hopke, Anal. Chim. Acta, 2003, 490, 277–289 CrossRef CAS.
- A. C. Aiken, P. F. Decarlo, J. H. Kroll, D. R. Worsnop, J. A. Huffman, K. S. Docherty, I. M. Ulbrich, C. Mohr, J. R. Kimmel, D. Sueper, Y. Sun, Q. Zhang, A. Trimborn, M. Northway, P. J. Ziemann, M. R. Canagaratna, T. B. Onasch, M. R. Alfarra, A. S. Prevot, J. Dommen, J. Duplissy, A. Metzger, U. Baltensperger and J. L. Jimenez, Environ. Sci. Technol., 2008, 42, 4478–4485 CrossRef CAS PubMed.
- T. Prohaska, J. Irrgeher, J. Benefield, J. K. Böhlke, L. A. Chesson, T. B. Coplen, T. Ding, P. J. H. Dunn, M. Gröning, N. E. Holden, H. A. J. Meijer, H. Moossen, A. Possolo, Y. Takahashi, J. Vogl, T. Walczyk, J. Wang, M. E. Wieser, S. Yoneda, X.-K. Zhu and J. Meija, Pure Appl. Chem., 2022, 94, 573–600 CrossRef CAS.
- M. Cope, M. Keywood, K. Emmerson, I. Galbally, K. Boast, S. Chambers, M. Cheng, S. Crumeyrolle, E. Dunne, R. Fedele, R. Gillett, A. Griffiths, J. Harnwell, J. Katzfey, D. Hess, S. Lawson, B. Milijevic, S. Molloy, J. Powell, F. Reisen, Z. Ristovski, P. Selleck, J. Ward, C. Zhang and J. Zeng, Sydney Particle Study: Stage II, 2014, https://www.environment.nsw.gov.au/-/media/OEH/Corporate-Site/Documents/Air/sydney-particle-study-2010-13.pdf Search PubMed.
- W. Xu, Y. He, Y. Qiu, C. Chen, C. Xie, L. Lei, Z. Li, J. Sun, J. Li, P. Fu, Z. Wang, D. R. Worsnop and Y. Sun, Atmos. Meas. Tech., 2020, 13, 3205–3219 CrossRef.
- Y. Zheng, X. Cheng, K. Liao, Y. Li, Y. J. Li, R. J. Huang, W. Hu, Y. Liu, T. Zhu, S. Chen, L. Zeng, D. R. Worsnop and Q. Chen, Atmos. Meas. Tech., 2020, 13, 2457–2472 CrossRef CAS.
- T. Joo, Y. Chen, W. Xu, P. Croteau, M. R. Canagaratna, D. Gao, H. Guo, G. Saavedra, S. S. Kim, Y. Sun, R. Weber, J. Jayne and N. L. Ng, ACS Earth Space Chem., 2021, 5, 2565–2576 CrossRef CAS.
- L. Lei, Y. Sun, B. Ouyang, Y. Qiu, C. Xie, G. Tang, W. Zhou, Y. He, Q. Wang, X. Cheng, P. Fu and Z. Wang, Environ. Sci. Technol., 2021, 55, 4542–4552 CrossRef CAS PubMed.
Footnote |
| † Electronic supplementary information (ESI) available. See DOI: https://doi.org/10.1039/d3ea00171g |
| This journal is © The Royal Society of Chemistry 2024 |