
 Open Access Article
 This Open Access Article is licensed under a Creative Commons Attribution-Non Commercial 3.0 Unported Licence
Ferrihydrite coating reduces microplastic induced soil water repellency†
Andreas
Cramer‡
 *a,
Johanna
Schmidtmann‡
*b,
Pascal
Benard
a,
Anders
Kaestner
c,
Matthias
Engelhardt
d,
Stefan
Peiffer
b and
Andrea
Carminati
a
*a,
Johanna
Schmidtmann‡
*b,
Pascal
Benard
a,
Anders
Kaestner
c,
Matthias
Engelhardt
d,
Stefan
Peiffer
b and
Andrea
Carminati
a
aDepartment of Environmental Systems Science, ETH Zürich, Physics of Soil and Terrestrial Ecosystems, Zürich, Switzerland. E-mail: andreas.cramer@usys.ethz.ch
bDepartment of Hydrology, University of Bayreuth, Bayreuth Center for Ecology and Environmental Research (BayCEER), Bayreuth, Germany. E-mail: j.schmidtmann@uni-bayreuth.de
cLaboratory for Neutron Scattering and Imaging, Paul Scherrer Institute, Villigen, Switzerland
dDepartment of Physical Chemistry II, University of Bayreuth, Bayreuth, Germany
First published on 10th May 2023
Abstract
Addition of microplastics (MP) to soil has the potential to increase soil water repellency. However, coating of MP with soil abundant substances e.g., iron compounds, can reduce this effect. Here, we tested if pre-coating or in situ coating of MP with ferrihydrite (Fh) reduces soil water repellency. We applied hotspots of pristine and coated MP (20–75 μm, PS and PET) to sand and imaged capillary rise via neutron radiography. Capillary rise experiments in wetting–drying cycles were conducted using water and Fh suspension. Pristine MP hotspots were not wettable. Capillary rise of water into coated MP hotspots differed in wettability depending on polymer type. While coated PS was still non-wettable, water imbibed into the coated PET hotspot. Capillary rise of Fh suspensions in wetting and drying cycles also showed varying results depending on polymer type. MP hotspots were still non-wettable and local water content increased only marginally. Our results indicate that Fh coating of MP changes MP surface wettability depending on polymer type and therefore counteracts the hydrophobic properties of pristine MP. However, MP coating is likely to be slowed down by the initial hydrophobicity of pristine MP. Dynamics of MP coating and increasing wettability are key factors for biotic and abiotic degradation processes.
Environmental significanceThe contamination of soil with microplastics (MP) is ubiquitous and occurs locally by deposition of larger plastic fragments with hotspots of high MP content leading to a loss of soil wettability. Consequently, locally reduced soil water content and air entrapment may occur, affecting soil functions such as capillary water flow as well as MP degradation. Here, we demonstrated that, depending on polymer type, coating of MP with iron (oxy)hydroxides reduces hydrophobicity of MP and allows for capillary infiltration of water. However, the initial low wettability of MP is likely to slow down the coating of MP. We conclude that the interaction of MP with surface-active environmental particles is important for the fate of MP and its impact on soil wettability. |
1. Introduction
Terrestrial ecosystems are confronted with ever increasing amounts of microplastic (MP) particles of different origin, type, shape, size, and state of degradation.1 The extent of MP contamination depends on anthropogenic activity levels.2 In floodplains in Swiss nature reserves, concentrations up to 593 particles per kg of MP are reported.3 Zhou et al. (2018) estimated 1.3–14![[thin space (1/6-em)]](https://www.rsc.org/images/entities/char_2009.gif) 713 particles per kg in a coastal soil,4 Vollertsen & Hansen (2017) reported 53000–528000 particles per kg in agricultural soils5 and in industrial soils 0.3–67.5 g kg−1 of MP were reported.6 However, also in remote locations like Antarctica, MP has been found in soils.7 The global plastic production of 2021 is estimated to 367 Mt.8 The total accumulated plastic waste generation is estimated to reach over 25000 Mt by the year 2050 with maximum half of it being either correctly discarded, incinerated or recycled.9 Polyethylene terephthalate (PET), one of the main polymers used for packaging materials, constitutes a big part of plastic litter.1,8,10,11 Soil analysis for polymers mainly revealed groups of polyethylene (PE), polypropylene (PP), polyamide (PA) and polystyrene (PS).1,2
713 particles per kg in a coastal soil,4 Vollertsen & Hansen (2017) reported 53000–528000 particles per kg in agricultural soils5 and in industrial soils 0.3–67.5 g kg−1 of MP were reported.6 However, also in remote locations like Antarctica, MP has been found in soils.7 The global plastic production of 2021 is estimated to 367 Mt.8 The total accumulated plastic waste generation is estimated to reach over 25000 Mt by the year 2050 with maximum half of it being either correctly discarded, incinerated or recycled.9 Polyethylene terephthalate (PET), one of the main polymers used for packaging materials, constitutes a big part of plastic litter.1,8,10,11 Soil analysis for polymers mainly revealed groups of polyethylene (PE), polypropylene (PP), polyamide (PA) and polystyrene (PS).1,2
Hitherto, most studies are focusing on the effect of MP on biological impacts while investigations on soil properties and functions are scarce. Since MP particles are typically hydrophobic, once they are deposited at the soil surface or incorporated into the bulk soil, they are likely to locally increase soil water repellency.12 Previous experiments showed that pristine MP increases soil water repellency with the effect of inhibiting capillary rise.12 Water bypasses areas of high MP contents, leading to locally reduced soil water contents by increasing tortuosity and entrapping air.12 These observations imply that MP in soil is not easily wetted by soil water. Due to the importance of water on soil biotic and abiotic processes, this is expected to impact transport and fate of MP.
In the environment, MP particles may undergo various processes changing their surface properties e.g., weathering by UV-light, hydrolysis, microbial activity and interactions with environmental particles and substances.13–17 Once incorporated into soil, MP is exposed to a variety of abundant soil and soil water constituents being able to alter MP surfaces18 and potentially increase their wettability. Such binding agents include inorganic substances such as minerals, metal hydroxides or organic matter.18–20 Recent studies demonstrated the formation of a surface coating and heteroaggregation of PS particles with ferrihydrite (a ferric iron (oxy)hydroxide) in the aqueous phase.21 Depending on the pH value, the surface properties of the MP were controlled by the ferric particles.21 Such iron compounds are not only highly abundant components in aquatic systems but also in soil and soil water (up to 20% (w/w)).22 MP can get in contact with ferrihydrite (Fh) suspension in unsaturated sand, a situation comparable to and commonly found at the capillary fringe, where anoxic Fe(II) bearing groundwater may come in contact with oxygen with subsequent formation of Fe(II) to Fh.23 Thus, they are posing important coating agents of MP surfaces in terrestrial environments. First studies showed that MP particles and iron oxides interact in porous media and the relative smaller particles adsorbed onto the surface of the larger ones.24 The resulting changes in surface properties influence the (co)transport of MP particles.24 However, studies on the interactions between MP and soil components and the resulting changes of MP surface properties are scarce as most studies focus on the interactions of MP and environmental particles in aquatic systems.21,25,26
Here, we tested if Fh coating influences the wettability of MP in soil. To this end, we investigated whether hotspots of pristine and coated MP (20–75 μm, PS and PET) embedded in a porous medium consisting of quartz sand will show differences in wettability during capillary rise (Fig. 1). Such regions of high MP content in soil are relevant since contamination usually occurs locally by deposition of larger plastic fragments, for example, by mulch film residues and their subsequent incorporation into the soil followed by fragmentation.27–29 The resulting wettability of MP hotspots was visualized and quantified by means of water saturation using neutron imaging and by determination of static contact angles (CA) by use of the sessile drop method (SDM). Neutron imaging is non-destructive to the soil structure and highly sensitive to hydrous material rendering this method optimal for imaging water in porous media.30–32 The common process of extracting and determining MP in soil, e.g., density separation, is labor intensive and destructive to the soil structure. Neutron imaging allows to determine MP particle properties in situ without destroying the soil structure. Furthermore, hydrogen atoms are abundant in polymers allowing neutron imaging to distinguish PET and PS from dry soil material.12,33 Differing material neutron attenuation coefficients can be used to quantify sample constituents in space and time.32
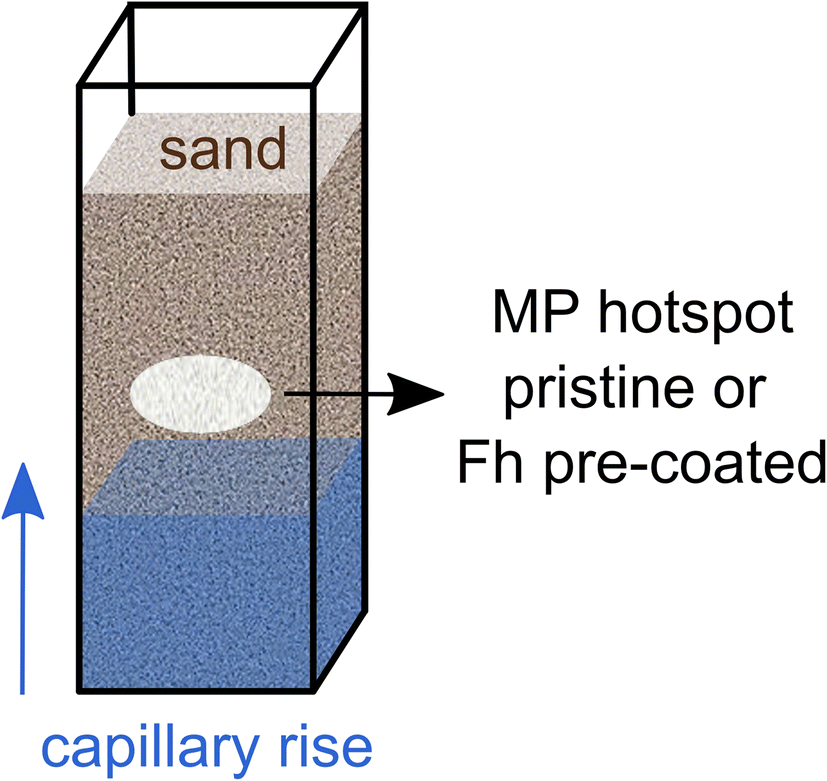 | ||
| Fig. 1 Schematic setup of a sample container filled with sand and MP hotspot. | ||
We hypothesize that (i) the coating of MP particles with Fh increases their wettability; and (ii) the addition of Fh to water leads to a partial coating of pristine MP particles during capillary rise and hence increases the wettability of MP.
2. Experimental
2.1 Investigated media
We applied MP hotspots to porous media in varying combinations to estimate the effect of pristine MP and coated MP on soil wettability, respectively. As polymers we used PET and PS provided by Veolia Deutschland GmbH. It has been milled by a centrifugal mill (ZM200, Retsch GmbH) and sieved into a 20–75 μm fraction. Particle size analysis (Microtrac, Retsch GmbH) revealed irregularly shaped particles, ranging from near spherical to fibrous, resembling an environmentally relevant mixture of MP shapes. Size distributions and shapes are reported in the ESI (Fig. S1†).As model soil particles, quartz sand (Raneem, Sand-Schulz GmbH, Berlin) in the size range of 700–1200 μm was used. To exclude effects of organic matter on wettability, the sand was treated with hydrogen peroxide (30%) at 95 °C for 8 h and subsequently washed with deionized water. Additionally, magnetic particles were removed to not obstruct the signals from neutron imaging.
2.2 Characterization of MP
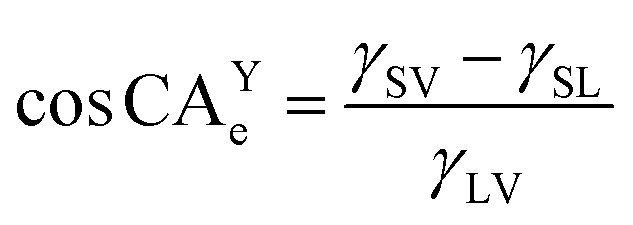
Each droplet geometry was analyzed with an elliptic shape recognition algorithm and measured at the three-phase contact line of liquid, solid and vapor 500 ms after the droplets detached from the syringe (software: Krüss Advance, Krüss GmbH). CA are the result of the combination of surface tensions of the aforementioned three phases according to eqn (1),36,37 where CAYe is the equilibrium contact angle, γ is surface tension at the respective interfaces between solid (S), liquid (L) and vapor (V):
 | (1) |
Statistical analysis was conducted using the software MATLAB (R2021a). A parametric one-way ANOVA test was applied to the CA data of the MP to disclose a potential significant difference and the post hoc test of Bonferroni was employed to identify significant differences between the variants (p < 0.001). The letters A, B and C indicate significant differences.
Scanning Electron Microscopy (SEM) was conducted to confirm the coating of MP with Fh. The dried material was mounted onto a standard sample holder and coated with a thin layer of platinum (Cressington 208 HR sputter coater). SEM images were recorded with a Zeiss ULTRA PLUS (Carl Zeiss Microscopy GmbH, Germany). To calculate the amount of Fe adsorbed to the MP surface, the specific surface area of PS and PET was determined by the Brunauer–Emmett–Teller (BET) method. This method measures the surface area by a multi-point surface N2-adsorption isotherm at a temperature of 77 K (NOVA 2000e, Quantachrome Instruments).
Furthermore, the amount of iron adsorbed to the MP surfaces was determined. Approximately 0.03 g of coated MP were added to 5 mL 1 M HCl. The mixture was placed on an overhead shaker for 24 h to dissolve all ferric particles from the MP surface and afterwards filtered through 10 μm. The iron concentration of the filtrate was determined spectrophotometrically (DR 3800 VIS, Hach) at 512 nm using acetate buffer solution and 1,10-phenanthroline. Prior to the measurement, all ferric iron was reduced to ferrous iron by adding ascorbic acid to the sample. Triplicate samples were prepared.
2.3 Neutron imaging
Time-series neutron radiography of capillary rise into aluminum containers (inner dimensions: 6 × 16 × 60 mm) filled with sand and MP was conducted in wetting–drying cycles at the NEUTRA beamline at the Paul Scherrer Institute in Villigen, Switzerland.39 The containers were pre-filled half with sand before MP was added via a funnel with subsequent addition of the other half sand (Fig. 1). The applied MP hotspots were pristine or coated with Fh. The mass of the MP hotspots was 0.02 g and range in size from height of ca. 1.5–2.5 mm and width of ca. 5.0–7.0 mm covering the whole depth of the sample container (6 mm). Capillary rise was imaged for a duration of 150 s to eventually estimate the water saturation of the capillary fringe. Differences in water saturation allow conclusions about the wettability of MP hotspots. An open container with in and out flow and a permeable bridge as stand for the sample containers was providing a constant water table for capillary rise. The respective liquid was delivered by a peristaltic pump at constant flow rate. Imbibition of different liquids was recorded for ten and six replicates of different MP polymer types (Table 1) with an acquisition time of 2 s and a pixel size of 53 μm. Three different liquids for capillary rise were used: (i) deionized water with 10 mM NaCl (water), (ii) 10 mg per L Fh suspension with 10 mM NaCl (Fh10) and (iii) 100 mg per L Fh suspension with 10 mM NaCl (Fh100). We conducted one wetting–drying cycle with water and two cycles with Fh10 and Fh100. Before the second wetting, the samples were dried at room temperature until constant weight.| MP | Liquid | Repetitions |
|---|---|---|
| Pristine PET | Water, Fh10, Fh100 | 10 |
| Coated PET | Water | 6 |
| Pristine PS | Water, Fh10, Fh100 | 10 |
| Coated PS | Water | 6 |
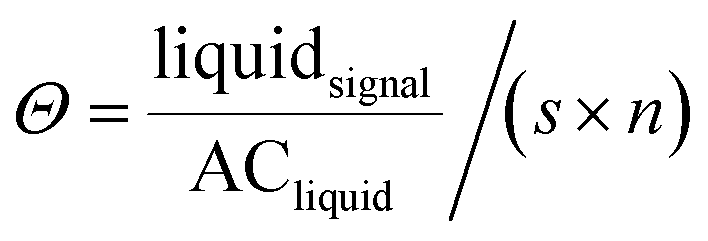
Differing material neutron attenuation coefficients can be used to quantify the distribution of sample constituents.32 The attenuation coefficients for water and Fh suspensions were derived from step-wedge samples with defined thickness filled with the respective liquid. The coefficients were used to calculate water saturation based on porosity and dimensions of the sample.40 According to eqn (2), where, in each pixel of the images, Θ is the saturation of the respective liquid, liquidsignal is the gray value signal after subtracting the dry soil signal, ACliquid is the respective attenuation coefficient of a liquid, s is the thickness of the sample material in direction of the neutron beam and n is the porosity of the sample material.40
 | (2) |
The gray value data of the images were normalized to the open beam signal, spot cleaned, and noise reduced.31,41 Subtracting gray values of the dry sample references from their wetted counterparts provides the signal of imbibed water.40 The analyzed subsection of sample was set to 21 (width) × 35 (height) pixel resulting in a region of interest (ROI) of merely the MP hotspot of 0.11 mm (width) and 0.2 mm (height). Statistical analysis was conducted using the software MATLAB (R2021a). The non-parametric Kruskal–Wallis test was applied to the water saturation data to disclose a potential significant difference and the post hoc test of Bonferroni was employed to identify significant differences between the treatments (p < 0.001). The letters A, B and C indicate significant differences where the combination of two letters shows similarity between those groups.
3. Results and discussion
3.1 Characterization of pristine and coated MP particles
Contact angles are a measure of polarity and hence allow conclusion about the wettability of particles.34,35 Typically, CA < 90° are regarded to allow for good wettability, while >90° can be considered hydrophobic.34,35 In our study, all particles exceed this threshold (Table 2). The analyzed MP surfaces partly indicate significant differences between pristine and coated MP as well as in polymer type (Fig. 2a, Tables 2 and S1†). The lower initial static CA of pristine PET (123.81°) compared to PS (143.71°) is significantly different and indicates a higher surface polarity of pristine PET42 and therefore, a higher wettability.| MP type | Mean contact angle (°), n = 11 | Significance contact angle | μmol Fe per m2 MP, n = 3 | Zeta potential (mV) (pH 5.7 ± 0.1), n = 4 |
|---|---|---|---|---|
| Pristine PS | 143.71 ± 3.29 | A | — | −32.7 ± 0.5 |
| Pristine PET | 123.81 ± 3.87 | B | — | −28.1 ± 0.1 |
| Coated PS | 127.06 ± 3.74 | B | 20.3 | — |
| Coated PET | 101.67 ± 4.37 | C | 87.4 | — |
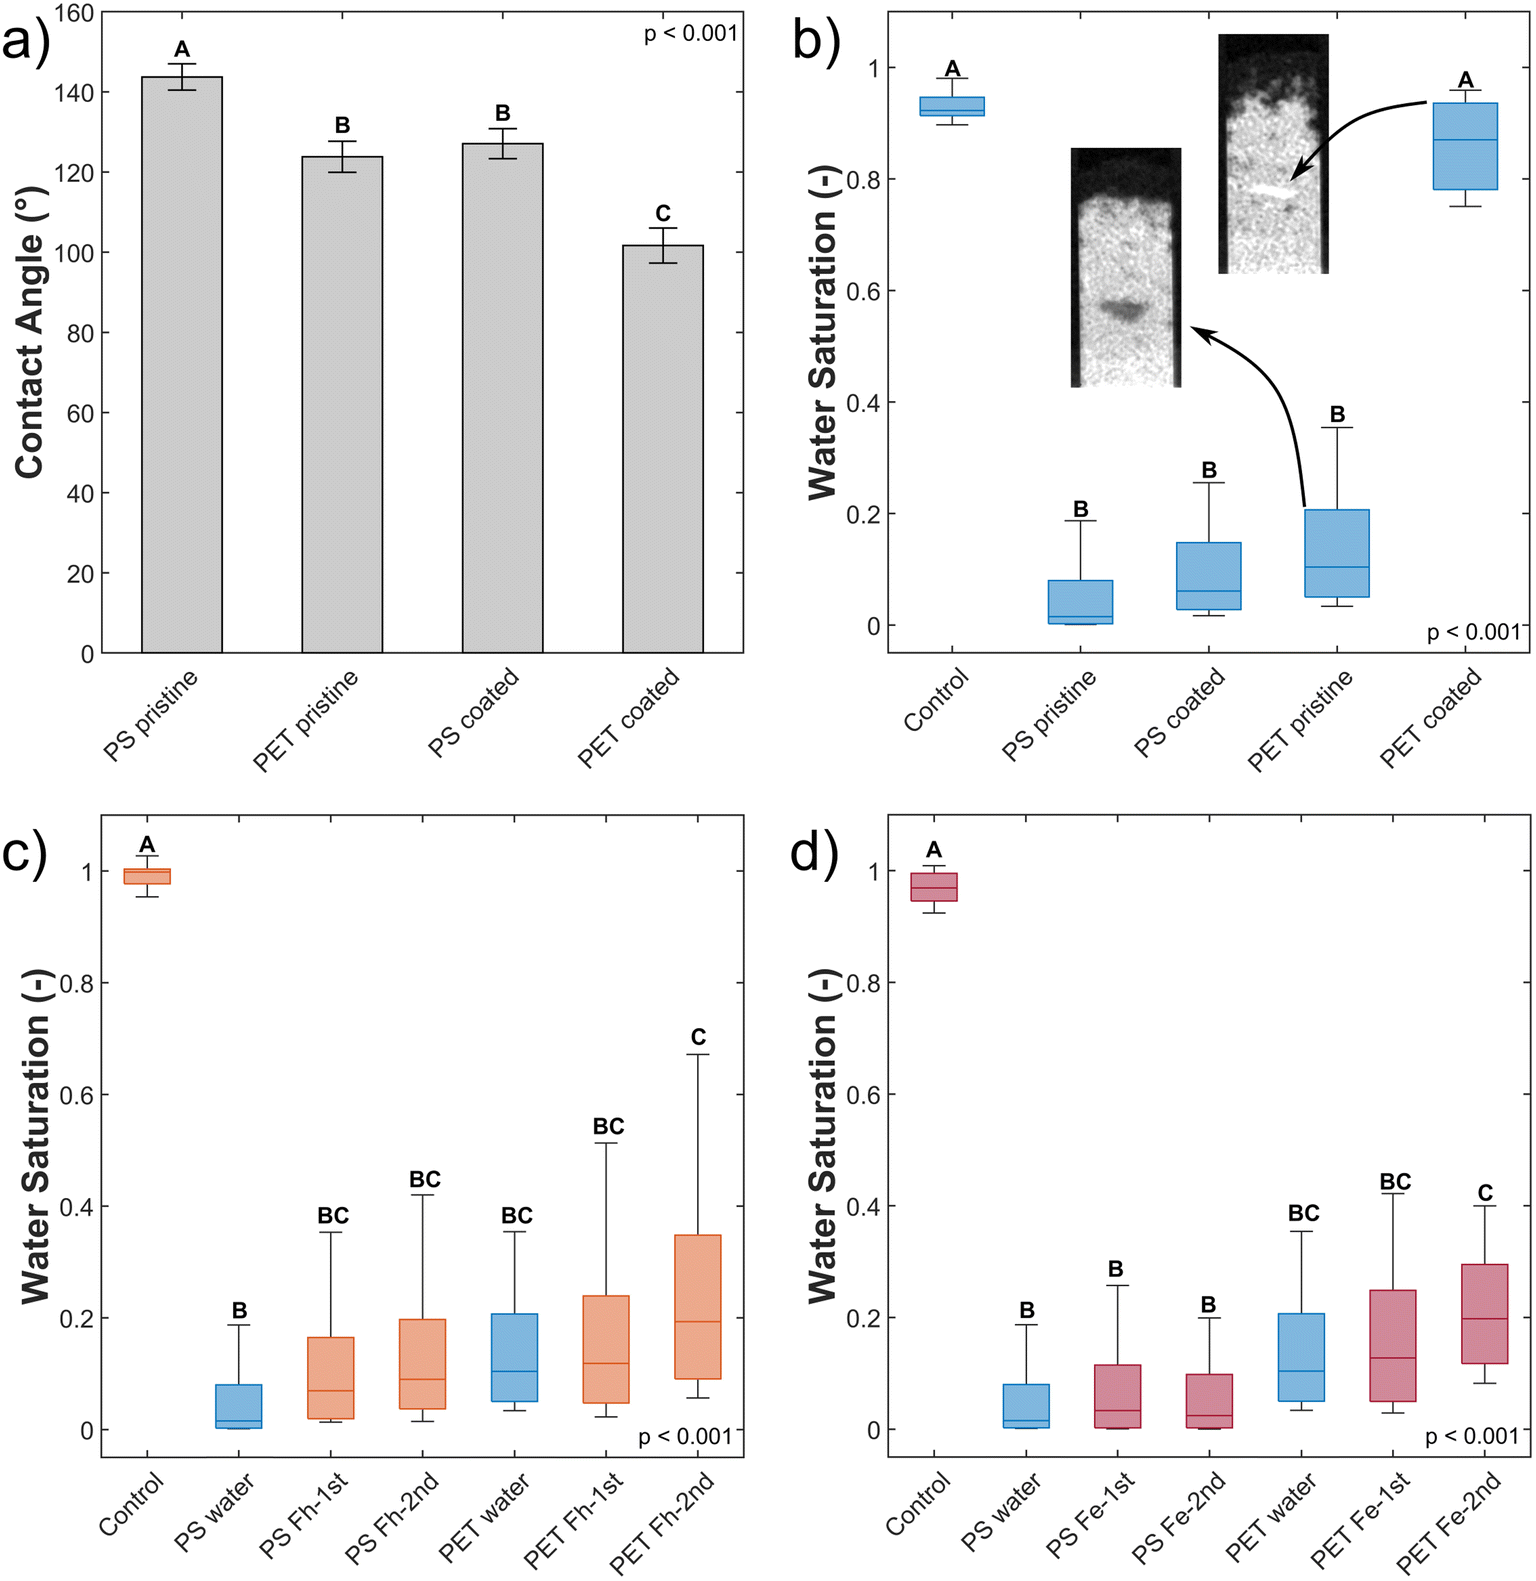 | ||
| Fig. 2 (a) Contact angle of pristine and coated PS and PET. (b) Water saturation of MP hotspots after capillary rise with water. One wetting cycle for control samples without MP hotspot (n = 10), pristine (n = 10) and coated MP variants (n = 6) are shown. For PET, neutron images after capillary rise are shown. (c) Water saturation of MP hotspots after capillary rise with Fh10 (orange). One wetting cycle for control without MP (n = 6) and two wetting–drying cycles for pristine PS and PET variants (n = 6) are shown. For comparison, the results of the wetting of pristine PS and PET with water (blue) are shown. (d) Water saturation of MP hotspots after capillary rise with Fh100 (red). One wetting cycle for control samples (n = 10) and two wetting cycles for pristine PS and pristine PET variants are shown (n = 10). For comparison, the results of the wetting of pristine PS and PET with water (blue) are shown. The letters A, B and C in each graph indicate significant differences whereas the combination of two letters (e.g., AB) shows similarity between those groups. | ||
Coated PET has an average static CA of 101.67° and is significantly different from the other variants. Coating of PS (127.06°) resulted in static CA merely in the range of pristine PET (123.81°) indicating no significant difference between them and no wettability for both polymers. The coating of both polymer types with Fh significantly decreased the contact angle indicating a change in polarity. Nychka & Gentleman (2010) mention that a moderate CA, besides other important surface properties, facilitates microbial colonization.43 They differentiate between cell-substrate adhesion, where high wettability (CA = 24°) is favorable and cell–cell cohesion where hydrophobicity (CA = 84°) is of importance. Neither of those CA are observed in our experiment and thus, the used substrates were highly water repellent. Of all MP materials, coated PET showed the most favorable wettability for colonization exhibiting an CA of 101.67°.
In line with CA measurements, the coating of PET with Fh was more effective compared to PS. On the PET surface, 87.4 μmol Fe adsorbed per m2 surface area of MP. Hence, surface coverage with Fh is more than four times higher compared to PS with 20.31 μmol Fe per m2 surface area MP (Tables 2 and S2†). This is confirmed by SEM images showing a denser coating of the PET surface with small Fh particles compared to PS (Fig. S2†). The zeta potentials of PS and PET are negative in the analyzed pH range between 4 and 10 and become more negative with increasing pH value. The pH value of the Fh suspension used in the experiments was approximately 5.7. At this pH value, the zeta potential values of both polymer types were similar (Fig. S3† and Table 2) and thus cannot be the reason for the different adsorption behavior of Fh. Therefore, we assume that the presence of polar functional groups of the PET structure enhances the adsorption of Fh compared to PS. This is consistent with previous studies that investigated the adsorption of heavy metals or ciprofloxacin on MP.44–46 They observed that the adsorption capacity of MP particles increased with increasing UV-weathering. The UV-treatment increased the number of functional groups on the surface of MP particles and therefore provided more adsorption sites.18 For PET, the polymer backbone contains such functional groups even without weathering and therefore provides more adsorption sites for Fh compared to PS.
3.2 Neutron imaging
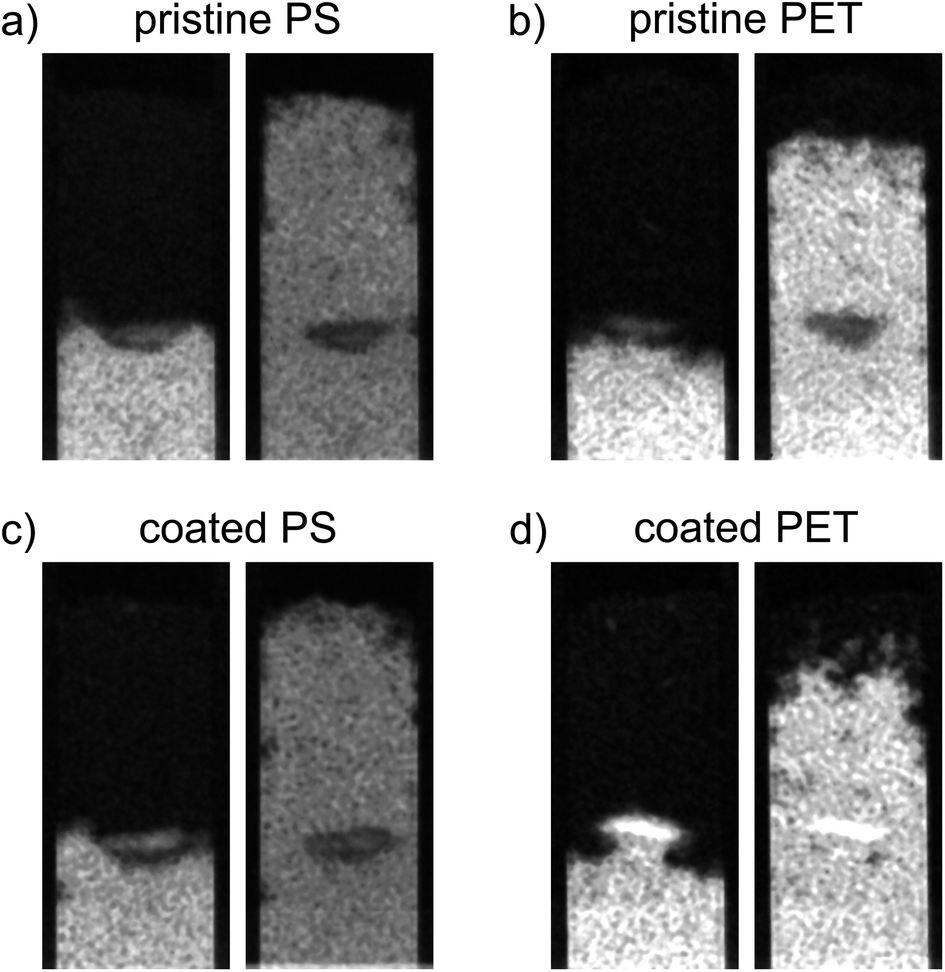 | ||
| Fig. 3 Neutron images during and at the end of capillary rise of water. The hotspots consist of (a) pristine PS, (b) pristine PET, (c) Fh-coated PS, and (d) Fh-coated PET. For each set, the left image is taken at a time step at which the rising water reaches the hotspot. For coated PET, water flow into the hotspot is observed whereas for the other variants, the water bypasses the hotspot. The right image of each set is taken at the end of capillary rise (150 s). | ||
Coated PET hotspots show a different behavior compared to pristine PET hotspots. The coated PET hotspots are wettable and water flow into the hotspot was observed (Fig. 3). Furthermore, water was even attracted by the hotspot, accelerating towards it and being further distributed from there (Fig. 3). We attribute this observation to a smaller pore geometry of the wettable, coated PET particles resulting in enhanced capillary forces compared to the sand. In the absence of coating, the smaller pore geometry of MP did not affect water flow due to high static CA. The observations are confirmed by water saturation values of the coated PET hotspots comparable to the control but with a broader distribution of values (Fig. 2b).
Other than in the case of PET, only a slight difference in water saturation between pristine and coated PS particles exists. Even though the water saturation of coated PS increased slightly, the wettability of the hotspot did not change, and the hotspot is still considered non-wettable.
The increase in wettability of coated PET compared to coated PS can be explained by the effectiveness of the Fh coating. The amount of Fh adsorbed onto the PET surface was approximately four times higher compared to PS (Table 2). Therefore, we assume that the higher degree of coating of PET enables the formation of capillary water menisci in the pore space facilitating capillary rise. The wettability of hotspots of coated PET appear to contradict the results from static CA measurements with a CA of coated PET above 90° indicating non-polarity (see Section 3.1). Such discrepancy emerges from the methodological differences. Static CA measurements are derived from a quasi-two-dimensional system while capillary rise adheres to effective, dynamic CA of water in a three-dimensional pore space. Hence, the static CA derived allow to compare particles and treatments but cannot fully explain the dynamic process of capillary rise into a three-dimensional volume. In case of this study, the solid material consists of irregularly shaped sand grains and MP. The shape of the resultant liquid meniscus, and therefore the CA, is subject to forces based on the geometry of the pore space. In samples mixed with MP, dynamic CA are typically lower compared to static CA.12 Instead of water not being able to spread beyond low wettability of MP during static CA measurements on a quasi-two-dimensional packing, water, during imbibition into a three-dimensional volume, has the possibility of bypassing into more favorable flow paths for imbibition and enclosing non-wettable locations.12 Furthermore, forces like inertia of the imbibing liquid can also lead to overcome locations of low wettability. This would explain that the water saturation of coated PET is close to the one of the control but with a wider distribution of values (Fig. 2b).
Slight, but not significant, increases in water saturation relative to uncoated PS and PET were observed upon imbibition of Fh suspensions independent of concentration (Fig. 2c and d). A second wetting cycle did not lead to a change in wettability of the hotspots. Though, increased water saturation with a broader distribution of values show that Fh coating occurred locally during capillary rise. The explanation is that Fh suspensions have limited contact to the MP hotspots due to MP hydrophobicity. The suspensions bypassed the hotspots and only MP particles at the boundaries had contact with the imbibing Fh suspensions. It means that for coating and reducing the wettability of MP, Fh needs first to wet MP, which is a process that is hindered and slowed down by the initial hydrophobicity of MP. An increased number of wetting and drying cycles would likely allow the Fh suspensions to propagate deeper into the hotspots. The fact that larger increases of water saturation were only observed with PET is in line with differences in pre-coating of pristine MP, where PET coating was more profound than PS due to the presence of more functional groups in the PET polymer backbone.
4. Conclusion
We showed that naturally occurring coating agents like ferric (oxy)hydroxide increase the wettability of MP in porous media. This is of importance since MP has been shown to limit capillary flow in soils leading to air entrapments and reduced local water contents.12Depending on polymer type, capillary driven imbibition of water into MP hotspots was facilitated by Fh pre-coating. While coated PS was still non-wettable, coated PET was wettable. We infer, a coating of particles, sufficiently high to render them wettable, depends on the presence of functional groups on the MP surface. Polymers with more functional groups in the polymer backbone like PET can be coated more efficiently compared to less functionalized polymers like PS.
In contrast to Fh pre-coating of MP, in situ coating of pristine MP hotspots with Fh suspension did not establish an effective coating regardless of Fh concentrations. The exposed MP hotspots were still non-wettable. Yet, a slight but not significant increase in water saturation and a wider distribution of values was visible. We summarize, that pristine MP, due to its hydrophobic properties, had limited contact to the imbibing Fh suspensions and only MP particles at the hotspot boundaries were exposed to Fh. We speculate, that adsorption of Fh onto MP in soils is a slow process, which requires multiple wetting–drying cycles in order to effectively alter the surfaces of MP in soil and render it wettable.
Translated into a natural process, our capillary rise experiment with wetting–drying cycles mimics fluctuating moisture conditions in the vadose zone. Over time, this process happens numerous times and therefore might allow MP in soil to get in contact with the soil suspension. However, the initial hydrophobicity of MP delays this process. The time frame necessary to overcome MP's inherent hydrophobicity is unclear and strongly depends on polymer type.
Understanding the coating and wetting kinetics of MP is a key factor to predict MP degradation, as the presence of water accelerates biotic and abiotic degradation processes.
Author contributions
The experimental work was performed by A. Cramer and J. Schmidtmann. The manuscript was written by A. Cramer and J. Schmidtmann with contributions of all authors. A. Cramer and J. Schmidtmann contributed equally. All authors have given approval to the final version of the manuscript.Conflicts of interest
There are no conflicts to declare.Acknowledgements
This study was funded by the Deutsche Forschungsgemeinschaft (DFG, German Research Foundation) – Project Number 391977956 – SFB 1357. We kindly acknowledge subproject Z01 for providing microplastic particles. This work is based on experiments performed at the Swiss spallation neutron source SINQ, Paul Scherrer Institute, Villigen, Switzerland. The authors would like to thank Jutta Eckert for her support in chemical analysis, Martina Heider for taking SEM images at the Bavarian Polymer Institute (BPI) and Michael Thelen for measuring the BET surface area.References
- R. W. Chia, J. Y. Lee, H. Kim and J. Jang, Microplastic pollution in soil and groundwater: a review, Environ. Chem. Lett., 2021, 19, 4211–4224 CrossRef CAS.
- B. Xu, F. Liu, Z. Cryder, D. Huang, Z. Lu, Y. He, H. Wang, Z. Lu, P. C. Brookes, C. Tang, J. Gan and J. Xu, Microplastics in the soil environment: Occurrence, risks, interactions and fate–A review, Crit. Rev. Environ. Sci. Technol., 2020, 50, 2175–2222 CrossRef CAS.
- M. Scheurer and M. Bigalke, Microplastics in Swiss Floodplain Soils, Environ. Sci. Technol., 2018, 52, 3591–3598 CrossRef CAS PubMed.
- Q. Zhou, H. Zhang, C. Fu, Y. Zhou, Z. Dai, Y. Li, C. Tu and Y. Luo, The distribution and morphology of microplastics in coastal soils adjacent to the Bohai Sea and the Yellow Sea, Geoderma, 2018, 322, 201–208 CrossRef CAS.
- J. Vollertsen and A. A. Hansen, Microplastic in Danish Wastewater: Sources, Occurrences and Fate, The Danish Environmental Protection Agency, 2017 Search PubMed.
- S. Fuller and A. Gautam, A Procedure for Measuring Microplastics using Pressurized Fluid Extraction, Environ. Sci. Technol., 2016, 50, 5774–5780 CrossRef CAS PubMed.
- A. Kelly, D. Lannuzel, T. Rodemann, K. M. Meiners and H. J. Auman, Microplastic contamination in east Antarctic sea ice, Mar. Pollut. Bull., 2020, 154, 111130 CrossRef CAS PubMed.
- Plastics Europe, Plastics – the Facts 2021: An analysis of European plastics production, demand and waste data, https://plasticseurope.org/wp-content/uploads/2021/12/AF-Plastics-the-facts-<?pdb_no 2021?>2021<?pdb END?>_250122.pdf Search PubMed.
- R. Geyer, J. R. Jambeck and K. L. Law, Production, use, and fate of all plastics ever made, Sci. Adv., 2017, 3, 25–29 Search PubMed.
- M. Padervand, E. Lichtfouse, D. Robert and C. Wang, Removal of microplastics from the environment. A review, Environ. Chem. Lett., 2020, 18, 807–828 CrossRef CAS.
- H. Ritchie and M. Roser, Plastic Pollution, Our World in Data, published online at https://OurWorldInData.org, retrieved from: https://ourworldindata.org/plastic-pollution Search PubMed.
- A. Cramer, P. Benard, M. Zarebanadkouki, A. Kaestner and A. Carminati, Microplastic induces soil water repellency and limits capillary flow, Vadose Zone J., 2022, 1–11 Search PubMed.
- O. S. Alimi, J. Farner Budarz, L. M. Hernandez and N. Tufenkji, Microplastics and Nanoplastics in Aquatic Environments: Aggregation, Deposition, and Enhanced Contaminant Transport, Environ. Sci. Technol., 2018, 52, 1704–1724 CrossRef CAS PubMed.
- A. L. Andrady, Microplastics in the marine environment, Mar. Pollut. Bull., 2011, 62, 1596–1605 CrossRef CAS PubMed.
- N. Meides, T. Menzel, B. Poetzschner, M. G. J. Löder, U. Mansfeld, P. Strohriegl, V. Altstaedt and J. Senker, Reconstructing the environmental degradation of polystyrene by accelerated weathering, Environ. Sci. Technol., 2021, 55, 7930–7938 CrossRef CAS PubMed.
- T. Menzel, N. Meides, A. Mauel, U. Mansfeld, W. Kretschmer, M. Kuhn, E. M. Herzig, V. Altstädt, P. Strohriegl, J. Senker and H. Ruckdäschel, Degradation of low-density polyethylene to nanoplastic particles by accelerated weathering, Sci. Total Environ., 2022, 826, 154035 CrossRef CAS PubMed.
- A. A. Shah, F. Hasan, A. Hameed and S. Ahmed, Biological degradation of plastics: A comprehensive review, Biotechnol. Adv., 2008, 26, 246–265 CrossRef CAS PubMed.
- Z. Ren, X. Gui, X. Xu, L. Zhao, H. Qiu and X. Cao, Microplastics in the soil-groundwater environment: Aging, migration, and co-transport of contaminants – A critical review, J. Hazard. Mater., 2021, 419, 126455 CrossRef CAS PubMed.
- T. Lu, B. S. Gilfedder, H. Peng, S. Peiffer, G. Papastavrou, K. Ottermann and S. Frei, Relevance of Iron Oxyhydroxide and Pore Water Chemistry on the Mobility of Nanoplastic Particles in Water-Saturated Porous Media Environments, Water, Air, Soil Pollut., 2021, 232, 168 CrossRef CAS.
- X. Yan, X. Yang, Z. Tang, J. Fu, F. Chen, Y. Zhao, L. Ruan and Y. Yang, Downward transport of naturally-aged light microplastics in natural loamy sand and the implication to the dissemination of antibiotic resistance genes, Environ. Pollut., 2020, 262, 114270 CrossRef CAS PubMed.
- J. Schmidtmann, H. Elagami, B. S. Gilfedder, J. H. Fleckenstein, G. Papastavrou, U. Mansfeld and S. Peiffer, Heteroaggregation of PS microplastic with ferrihydrite leads to rapid removal of microplastic particles from the water column, Environ. Sci.: Processes Impacts, 2022, 1782–1789 RSC.
- W. Amelung, H.-P. Blume, H. Fleige, R. Horn, E. Kandeler, I. Kögel-Knabner, R. Kretzschmar, K. Stahr and B.-M. Wilke, Lehrbuch der Bodenkunde, SpringerVerlag GmbH, 2018 Search PubMed.
- S. Peiffer, A. Kappler, S. B. Haderlein, C. Schmidt, J. M. Byrne, S. Kleindienst, C. Vogt, H. H. Richnow, M. Obst, L. T. Angenent, C. Bryce, C. McCammon and B. Planer-Friedrich, A biogeochemical–hydrological framework for the role of redox-active compounds in aquatic systems, Nat. Geosci., 2021, 14, 264–272 CrossRef CAS.
- M. Li, L. He, M. Zhang, X. Liu, M. Tong and H. Kim, Cotransport and Deposition of Iron Oxides with Different-Sized Plastic Particles in Saturated Quartz Sand, Environ. Sci. Technol., 2019, 53, 3547–3557 CrossRef CAS PubMed.
- O. Oriekhova and S. Stoll, Heteroaggregation of nanoplastic particles in the presence of inorganic colloids and natural organic matter, Environ. Sci.: Nano, 2018, 5, 792–799 RSC.
- T. T. T. Vu, P. H. Nguyen, T. V. Pham, P. Q. Do, T. T. Dao, A. D. Nguyen, L. Nguyen-Thanh, V. M. Dinh and M. N. Nguyen, Comparative effects of crystalline, poorly crystalline and freshly formed iron oxides on the colloidal properties of polystyrene microplastics, Environ. Pollut., 2022, 306, 119474 CrossRef CAS PubMed.
- D. K. A. Barnes, F. Galgani, R. C. Thompson and M. Barlaz, Accumulation and fragmentation of plastic debris in global environments, Philos. Trans. R. Soc., B, 2009, 364, 1985–1998 CrossRef CAS PubMed.
- M. Bläsing and W. Amelung, Plastics in soil: Analytical methods and possible sources, Sci. Total Environ., 2018, 612, 422–435 CrossRef PubMed.
- Y. K. Song, S. H. Hong, M. Jang, G. M. Han, S. W. Jung and W. J. Shim, Combined Effects of UV Exposure Duration and Mechanical Abrasion on Microplastic Fragmentation by Polymer Type, Environ. Sci. Technol., 2017, 51, 4368–4376 CrossRef CAS PubMed.
- R. Hassanein, E. Lehmann and P. Vontobel, Methods of scattering corrections for quantitative neutron radiography, Nucl. Instrum. Methods Phys. Res., Sect. A, 2005, 542, 353–360 CrossRef CAS.
- A. P. Kaestner and M. Schulz, Processing Neutron Imaging Data - Quo Vadis?, Phys. Procedia, 2015, 69, 336–342 CrossRef CAS.
- H. Pleinert and E. Lehmann, Determination of hydrogenous distributions by neutron transmission analysis, Phys. B, 1997, 234–236, 1030–1032 CrossRef CAS.
- C. Tötzke, S. E. Oswald, A. Hilger and N. Kardjilov, Non-invasive detection and localization of microplastic particles in a sandy sediment by complementary neutron and X-ray tomography, J. Soils Sediments, 2021, 21, 1476–1487 CrossRef.
- J. Bachmann, R. Horton, R. R. van der Ploeg and S. Woche, Modified sessile drop method for assessing initial soil-water contact angle of sandy soil, Soil Sci. Soc. Am. J., 2000, 64, 564–567 CrossRef CAS.
- J. Bachmann, S. K. Woche, M. O. Goebel, M. B. Kirkham and R. Horton, Extended methodology for determining wetting properties of porous media, Water Resour. Res., 2003, 39, 1–14 CrossRef.
- T. Young, Philos, Trans. R. Soc. Lon don, 1805, 95, 65–97 Search PubMed.
- J. Bachmann and GU. McHale, Eur., J. Soil Sci., 2009, 60, 420–430 CrossRef CAS.
- R. M. Cornell and U. Schwertmann, The Iron Oxides: Structure, Properties, Reactions, Occurrences and Uses, John Wiley & Sons, 2003 Search PubMed.
- E. H. Lehmann, P. Vontobel and L. Wiezel, Properties of the radiography facility NEUTRA at SINQ and its potential for use as European reference facility, Nondestr. Test. Eval., 2001, 16, 191–202 CrossRef.
- A. Carminati, A. Kaestner, R. Hassanein, O. Ippisch, P. Vontobel and H. Flühler, Infiltration through series of soil aggregates: Neutron radiography and modeling, Adv. Water Resour., 2007, 30, 1168–1178 CrossRef.
- P. Boillat, C. Carminati, F. Schmid, C. Grünzweig, J. Hovind, A. Kaestner, D. Mannes, M. Morgano, M. Siegwart, P. Trtik, P. Vontobel and E. H. Lehmann, Chasing quantitative biases in neutron imaging with scintillator-camera detectors: a practical method with black body grids, Opt. Express, 2018, 26, 15769 CrossRef CAS PubMed.
- N. Giovambattista, P. G. Debenedetti and P. J. Rossky, Effect of surface polarity on water contact angle and interfacial hydration structure, J. Phys. Chem. B, 2007, 111, 9581–9587 CrossRef CAS PubMed.
- J. A. Nychka and M. M. Gentleman, Implications of wettability in biological materials science, JOM, 2010, 62, 39–48 CrossRef CAS.
- Y. Wang, X. Wang, Y. Li, J. Li, Y. Liu, S. Xia and J. Zhao, Effects of exposure of polyethylene microplastics to air, water and soil on their adsorption behaviors for copper and tetracycline, Chem. Eng. J., 2021, 404, 126412 CrossRef CAS.
- Q. Wang, Y. Zhang, X. Wangjin, Y. Wang, G. Meng and Y. Chen, The adsorption behavior of metals in aqueous solution by microplastics effected by UV radiation, J. Environ. Sci., 2020, 87, 272–280 CrossRef CAS PubMed.
- P. Liu, L. Qian, H. Wang, X. Zhan, K. Lu, C. Gu and S. Gao, New Insights into the Aging Behavior of Microplastics Accelerated by Advanced Oxidation Processes, Environ. Sci. Technol., 2019, 53, 3579–3588 CrossRef CAS PubMed.
Footnotes |
| † Electronic supplementary information (ESI) available: MP size distribution, SEM images of coated MP particles, zeta potential curve of pristine MP particles, neutron images during capillary rise, results of contact angle measurements, BET surface area analysis of pristine MP particles and mean water saturation values of all samples. See DOI: https://doi.org/10.1039/d3em00077j |
| ‡ These authors contributed equally. |
| This journal is © The Royal Society of Chemistry 2023 |