 Open Access Article
Creative Commons Attribution 3.0 Unported Licence
Adsorption and migration of alkali metals (Li, Na, and K) on pristine and defective graphene surfaces†
Emilia
Olsson
 ab,
Guoliang
Chai
 c,
Martin
Dove
b and
Qiong
Cai
 *a
*a
aDepartment of Chemical and Process Engineering, University of Surrey, Guildford, GU2 7XH, UK. E-mail: q.cai@surrey.ac.uk
bSchool of Physics and Astronomy, Queen Mary University London, London, E1 4NS, UK
cState Key Laboratory of Structural Chemistry, Fujian Institute of Research on the Structure of Matter, Chinese Academy of Sciences, Fuzhou City, Fujian Province 350002, China
First published on 7th March 2019
Abstract
In this paper, a computational study of Li, Na, and K adsorption and migration on pristine and defective graphene surfaces is conducted to gain insight into the metal storage and mobility in carbon-based anodes for alkali metal batteries. Atomic level studies of the metal adsorption and migration on the graphene surface can help address the challenges faced in the development of novel alkali metal battery technologies, as these systems act as convenient proxies of the crystalline carbon surface in carbon-based materials including graphite, hard carbons and graphene. The adsorption of Li and K ions on the pristine graphene surface is shown to be more energetically favourable than Na adsorption. A collection of defects expected to be found in carbonaceous materials are investigated in terms of metal storage and mobility, with N- and O-containing defects found to be the dominant defects on these carbon surfaces. Metal adsorption and migration at the defect sites show that defect sites tend to act as metal trapping sites, and metal diffusion around the defects is hindered when compared to the pristine surface. We identify a defect where two C sites are substituted with O and one C site with N as the dominant surface defect, and find that this defect is detrimental to metal migration and hence the battery cycling performance.
1. Introduction
Currently, rechargeable lithium-ion batteries (LIBs) are dominating the energy storage market, as these batteries have high energy density and high cycling reliability.1–5 In recent years, the growing demand for energy storage arising from the proliferation of electric vehicles, portable devices (such as smartphones and laptops), and large-scale grid based energy storage has put pressure on the global Li demand.5–8 With the current LIB production consuming 20% of the yearly Li supply, studies predict that the Li reserves may run out by 2025.4,7,9 This has accelerated the search for alternative battery technologies,5–7 and has led to attention being focused onto sodium (Na) and potassium (K), the metals directly below Li in the alkali metal group. These two metals share chemical properties with Li, are more abundant, making them at a quick glance perfect replacements for Li.10 However, studies on Na-ion batteries (NIBs) have shown that the transition from Li to Na is not straightforward, with the traditional LIB anode material, graphite, not being directly suitable for NIBs.11 In LIBs, Li readily intercalates into graphite, forming the high metal concentrated graphite, LiC6. K intercalated graphite has been found to have a concentration limit of KC8.5 The Na storage capacity of graphite, however, is much smaller due to the thermodynamic instability of Na–graphite intercalation compounds.5,12The inability to directly apply the standard LIB anode to NIBs turned the attention to another carbon-based material, hard carbons. Hard carbons have been used as anode materials in LIBs, NIBs, and K-ion batteries (KIBs).12–17 Hard carbon is an amorphous material and consists of randomly oriented sp2 hybridized carbon layers (as opposed to graphite, which consists of fully ordered carbon layers, i.e. graphene) commonly referred to as graphitic regions. The graphitic regions are crosslinked through sp3 hybridized carbons, giving a rigid structure that does not crystallize to graphite at high temperatures.3 Hard carbons are commonly synthesized through solid-phase pyrolysis from organic polymers, resulting in oxygen, hydrogen, and nitrogen defects being prevalent in these materials,3,18–20 as well as vacancy defects.21,22 Nitrogen doping of mesoporous hard carbons has been suggested to increase the wettability of the carbon surface to electrolyte solutions, improving the battery performance,19 and increasing the K ion storage capacity.23 It is generally believed that Na ions are accommodated on hard carbon surfaces through surface adsorption on defect sites.24 The presence of defects is thought to partly contribute to the sloping region of the NIB charge/discharge voltage profile.21,25 Similar observations have been found when employing hard carbons as anodes in LIBs, and Li storage is believed to be assisted by Li capture at heteroatom defect sites.26 Nevertheless, there has been little understanding of which particular defects contribute to such behaviour. KIBs are less well studied than both LIBs and NIBs. Hard carbon anodes have been found to have better rate-capability and cycling performance12 than the graphite anode for KIBs. Furthermore, comparative studies have found that K diffusion in hard carbon anodes is faster than Na diffusion in the same material. The atomistic mechanisms resulting in this behaviour are not fully understood, although it is believed that the metal–surface interaction plays a role.12
Apart from graphite and hard carbons, single defective graphene sheets have also been studied as anode materials for LIBs, NIBs, and KIBs.27–30 Graphene originally gained attention as an anode material due to its low weight, inertness, and low cost, in addition to its highly tuneable structure as a result of doping and defect formation.2,5 Doping with heteroatoms such as N, B, and S has been found to be beneficial for metal storage on graphene.2,30,31 The studies on vacancies so far have mainly focused on carbon vacancies, with the conclusion that carbon vacancies have a trapping effect of Na, hence being detrimental to Na transport.32
Alongside the experimental studies, computational studies have been used to gain a fundamental understanding of the effects of the atomic structures on Li, Na, and K storage in carbon materials. Previous computational studies have focused on graphite and graphene models with a single carbon vacancy (VC), multiple carbon vacancies, passivated carbon vacancies, and Stone–Wales defects as models for disordered carbons for NIBs.33–39 Single and double carbon vacancy defects have been shown computationally to enhance Na ion intercalation.39,40 Heteroatom doping of graphene, including N, B, S, and P, has also been studied.8,34,36,41–44 N doping has shown to improve Na diffusion in bilayer graphene.8,45 S and P doping could change the electronic character of carbon sheets, whereas B incorporation has shown to lead to a better thermal stability.8,34 Based on these studies, hard carbon materials with nitrogen doping and carbon vacancies have been shown to be beneficial for NIB anodes, although combinations of substitutional and vacancy defects are more scarce.46
A comprehensive study of alkali metals including Li, Na, and K adsorption and migration on graphene, with and without defects, is of importance to understand the storage mechanisms in carbon-based materials (including graphite, hard carbons, and graphene) for alkali metal batteries, and thus to help address the challenges faced by the emerging technologies such as NIBs and KIBs. In this paper, we investigate heteroatom defects based on N, H, and O, and their combinations with carbon vacancies, based on defects previously stipulated experimentally.2,18–24,26,35,46 These defects, to the best of our knowledge, have not previously been studied computationally, apart for the single carbon vacancy, and nitrogen substitutional defects, which are included for comparison. The impacts of these defects on Li, Na, and K adsorption and migration are then evaluated, providing insight into the benefits or harmfulness of the defects present in the LIB, NIB, and KIB anodes. Furthermore, we include oxygen-containing defects, which have been shown experimentally to be important, as the presence of oxygen on the hard carbon surface is thought to promote metal ion incorporation and migration.3
This paper is organized as follows. Computational details are set out in section 2. In section 3, metal adsorption and migration on pristine graphene (representing the crystalline carbon surface) are first presented as the reference for the calculated behaviours on the defective graphene. This is followed by a characterization of the defective graphene in terms of defect formation energies, and electronic structures are presented, before Li, Na, and K are introduced to the surface. Li, Na, and K on the defective surfaces are then evaluated in terms of metal adsorption energies at the defect sites, and metal trapping is calculated in terms of metal–defect association energies and metal migration barriers.
2. Computational details
In this paper, all calculations were conducted using density functional theory (DFT) as implemented in the Vienna Ab initio Simulation Package (VASP, version 5.3.5),47–50 utilizing the projector-augmented wave method (PAW) to describe the ion–electron interaction.51 The plane wave cut-off and k-space integrals were chosen so that the total energy was converged to 1 meV per atom. Based on these convergence tests, the kinetic energy cut-offs for all systems were set to 800 eV, with a 9 × 9 × 1 Γ-centred Monkhorst–Pack grid to sample the Brillouin zone for all calculations except the density of states, where the k-point grid was increased to 12 × 12 × 1.52 The generalized gradient approximation (GGA) with Perdew–Burke–Ernzerhof (PBE)53,54 functionals was used to express the interacting electron exchange-correlation energy, with an electronic convergence criterion of 10−5 eV and an ionic convergence criterion of 10−3 eV Å−1. Due to the possible magnetism of defective graphene, and metals, all spin-polarized calculations were performed.38 Bader AIM (Atoms in Molecules) charges55 were calculated using the Henkelman algorithm.56Due to the large polarizability of the graphene and metal,57 it is important to include dispersion corrections to accurately estimate the metal adsorption strength and migration.58–60 The presence of weak van der Waals forces in between graphene sheets and metal and graphene sheets has been accounted for by different functionals and dispersion corrections. It is widely accepted that in order to simulate these systems, care has to be taken when choosing the DFT functional and dispersion correction, and the chosen dispersion correction, or not including one, will have a direct effect on the calculations. This selection is commonly made based on the graphene interlayer binding energy, lattice parameters, and reproducibility of the electronic structure. There are a number of dispersion correction methods implemented in VASP to account for the van der Waals interactions, and after an exhaustive testing of potential correction schemes based on cell optimisations of graphene, AA and AB stacked graphite bulks, the DFT-D3 method with Becke–Johnson damping by Grimme and co-workers was selected as this setup gave the best agreement with the experimental lattice parameters, C–C bond lengths, and interlayer binding energies (ESI Table S1†).61 Previous studies have also verified the suitability of this method.57,62
The supercell used for the pristine graphene surface calculations, after metal adsorption, and carbon vacancy defect formation energy convergence, in this work is the 4 × 4 supercell, a cell size that has also previously been successfully used for metal adsorption on graphene in the literature.60,63 For the defective surface study, the 8 × 8 supercell was employed, allowing the geometric relaxation of large defects to be described within the supercell. Cell optimizations were performed to fully relax the pristine graphene sheets in terms of lattice parameters and ion positions, whereby the lattice parameters are kept fixed in the geometry optimizations for the defective, and metal adsorption studies. To eliminate interactions between periodic images in the z-direction, a dipole correction has been applied for all calculations, and a converged vacuum gap of 15 Å was added. Finally, migration energy barrier calculations were conducted using the climbing image nudged elastic band method (CI-NEB), which is implemented in VASP. Paths were constructed using the VASP Transition State Tools, with different numbers of images (reaction coordinates) to achieve convergence.64 The migration energy barrier is calculated as the maximum energy difference between the initial and final states on the migration paths.65,66
3. Results and discussion
3.1. Metal adsorption and migration on graphene
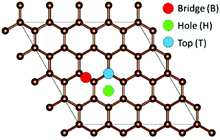
To model the adsorption of Li, Na, and K on the graphene, three inequivalent metal adsorption sites are considered (Fig. 1). The metal adatom can either adsorb on a bridge site (B) above a C–C bond (denoted as the “Bridge” site in Fig. 1), on top (T) of a carbon site (denoted as the “Top” site in Fig. 1), or in the middle of a C6-unit (denoted as the “Hole” site in Fig. 1), abbreviated H. For each metal adsorption site, a geometry optimization was performed in accordance with the parameters highlighted in the methodology. The distance between the adatom and graphene surface is then defined as the difference in the average z position of the surface layer C atoms, and the z coordinate of the metal adatom. For the systems including defects, the distortions are calculated as the differences from the pristine surface C–C distances and the C–Ĉ–C angles.| Eads = EA-graphene − xμA − Egraphene | (1) |
Here, EA-graphene is the total energy of A adsorbed on the carbon surface, Egraphene is the total energy of the pristine carbon surface, x is the number of adatoms, and μA is the chemical potential of an isolated metal atom A in a vacuum (vacuum reference state).67,70 Hence, μA can be expressed as
| μA = EA in a vacuum | (2) |
E A in a vacuum is the total energy of an isolated A atom simulated in a 12 Å × 12 Å × 12 Å cubic box. Following this convention, a negative adsorption energy indicates a stable configuration, whereas a positive adsorption energy indicates that the metal atom will preferably be in its atomic state, and adsorption on graphene is unfavoured. The calculated Li adsorption energies are in line with those previously reported by Okamoto 2016,36 and are presented in Table 1 together with the Na and K adsorption energies, respectively.
| Site | d A–C (Å) | E ionads (eV) | C–C (Å) | C–Ĉ–C (°) | |
|---|---|---|---|---|---|
| Li | Bridge (B) | 1.90 | −0.94 | 1.42–1.43 | 119.7–120.3 |
| Hole (H) | 1.68 | −1.22 | 1.42–1.43 | 119.7–120.4 | |
| Top (T) | 1.88 | −0.93 | 1.42–1.43 | 119.8–120.1 | |
| Na | Bridge (B) | 2.44 | −0.52 | 1.42–1.43 | 119.8–120.2 |
| Hole (H) | 2.18 | −0.62 | 1.42–1.43 | 119.8–120.2 | |
| Top (T) | 2.40 | −0.53 | 1.42–1.43 | 119.8–120.3 | |
| K | Bridge (B) | 2.66 | −0.98 | 1.42–1.43 | 119.8–120.1 |
| Hole (H) | 2.57 | −1.05 | 1.42–1.43 | 119.8–120.2 | |
| Top (T) | 2.68 | −0.98 | 1.42–1.43 | 119.8–120.1 | |
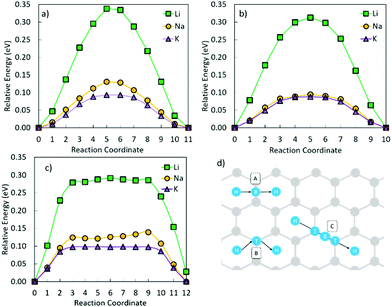
From Table 1, it is clear that for each alkali metal, the most favourable adsorption site, i.e. the site with the most negative adsorption energy, is the H site, with the B site and T site being energetically mostly equally favourable. Similarly, dA–C is the shortest at the H site, with the distance being larger for B and T sites. The H site is the highest coordination bonding site, with the metal atom being six-coordinated to carbon. The metal–carbon coordination for the B site is two, and for the T site it is one. dA–C is determined by the difference in electrostatic attraction between the adatom and the surface. The charge density (ρ) on graphene is the lowest (Fig. S1 in the ESI†) at H, compared to B and T, which means that the adatom can be accommodated closer to the surface. This also reduces electrostatic energy and repulsion, hence resulting in higher adsorption energies and shorter dA–C. Further to the discussion of the dA–C, the height of dA–C follows the metal positions in the periodic table. Similarly, the change in the surface structure with added adatoms is the largest for Li, and the smallest for K. This change, however, is small, and no change in hybridization of the carbon atoms is observed, with the sp2 character being retained upon metal adsorption.
On comparing the adsorption energies at the most favourable site (i.e. H site) for the three metals, it can be seen that Li does more readily adsorb on this surface than Na and K. Interestingly though, the adsorption strength in terms of adsorption energy follows the trend Li > K > Na, with the adsorption energy of Li and K being much stronger than that of Na. This is in line with previous experimental studies, which show that Na does not intercalate into graphite due to the weak bonding between Na and the graphene layers, making graphite an unsuitable anode material for NIBs.3,12 However, both KIB and LIB can use graphite as anode materials due to the strong adsorption of Li and K on graphene layers.3,12,71 To gain insight into why the adsorption energy strength does not follow the order of the metals in the periodic table, we examined the electronic structure of the metal adsorption on graphene, which is discussed as follows.
To study the electronic structure of the metal adsorbed graphene, the projected density of states (PDOS) is calculated for all adatoms on their most stable adsorption site (H) on graphene to examine the electronic structure response to metal adsorption. The resulting plots are presented in the ESI in Fig. S2.† From the PDOS, it is seen that for graphene (Fig. S2-d†) the characteristic Dirac cone is visible. Upon metal adsorption, this V-shaped feature is then shifted further down the valence band when Li, Na, and K are included (Fig. S2a–c†). Apart from the shift of the pristine carbon states further down the valence band and the higher occupancy of carbon states, the C PDOS remains largely unchanged with the addition of adatoms. For the metal carbon systems (Fig. S2a–c†), the metal p-states lie in the valence band, and are occupied, whereas the metal s-states are unoccupied in the conduction band, with a metal dependent charge transfer observed. Reversely, if the metal s-bands had been positioned in the valence band, charge would have been donated by the carbon surface to the metal, and the metal ion would remain in its metal state. Inspecting the separation of metal valence s-states (Li 2s, Na 3s, and K 4s) from the valence band maximum (E − EF = 0 eV), it is seen that the Li 2s states lie at 1.11 eV, the Na 3s states at 0.26 eV, and the K 4s states at 0.57 eV, respectively. This trend in metal s-states and Fermi level separation follows the same order as the adsorption energy (Li > K > Na), and further demonstrates that Na is less readily adsorbed on graphene than Li and K as it more easily reverts to its atomic state. Relationships between the ionisation potential and dA–C have also previously been prescribed to account for the higher adsorption energy of K, in relation to Na.72 The ionisation potential of Li is 5.39 eV, Na 5.14 eV, and K 4.34 eV. Hence, it is seen that there is a drop of 0.8 eV between Na and K, which is much larger than the difference in the ionisation potential between Na and Li (0.25 eV). The change in dA–C does not show as big a difference between the metal, with Li being 0.50 Å closer to the graphene surface than Na, and Na being 0.39 Å closer than K. Hence, the stronger adsorption energy seen for K, as opposed to Na, is expected to be further due to its lower ionisation potential. Na adsorption on graphene does hence have a weaker adsorption energy due to the higher ionisation potential of Na and its relatively large dA–C (in relation to Li, which has a similar ionisation potential to Na), which follows the trend observed for the energy difference between the metal s-states and Fermi level discussed above.
| H–B–H | H–T–H | H–T–B–T–H | |
|---|---|---|---|
| Li | 0.34 | 0.31 | 0.29 |
| Na | 0.13 | 0.10 | 0.14 |
| K | 0.09 | 0.09 | 0.10 |
The above results provide an understanding of the behaviour of Li, Na, and K on non-defective crystalline carbon surfaces in carbon anodes. In practice, carbon materials often contain defects that have non-negligible effects on the behaviour of alkali metals and thus the performance of alkali metal batteries. This is investigated in the following section.
3.2 Defective graphene
Nitrogen-, oxygen-, and hydrogen-containing defects, as well as vacancies are prevalent in hard carbon and graphene materials.3,18–23,25 Here, a selection of nine different defects including these species, and carbon vacancies, are studied to establish the effect on metal adsorption and migration from defective carbon surface layers in hard carbons and graphene. A schematic overview of all the considered defects is included in Fig. 3. Firstly, we discuss the impact of the defects on the surface in terms of bond distortions and carbon angle distributions, electronic structures, and defect formation energies. Secondly, the approach developed in section 3.1 for metal adatoms is applied to the defective systems to study metal adsorption and migration.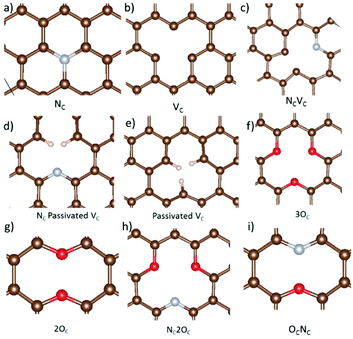 | ||
| Fig. 3 Optimized defect geometries of the (a) nitrogen substituted carbon site (NC), (b) carbon vacancy (VC), (c) combination of a carbon vacancy and nitrogen substituted carbon site (NCVC), (d) VC with two hydrogens passivating the carbons around the vacancy site and one carbon substituted for nitrogen (NCVC-pass), (e) passivated carbon vacancy (VC-pass), (f) three oxygen substituted at carbon sites (3OC), (g) two oxygen substituted carbon sites (2OC), (h) three carbon sites substituted with two oxygen, and one nitrogen, respectively (NC2OC), and (i) one oxygen, and one nitrogen substituted carbon defect (OCNC). Structures were visualized with VESTA.82 | ||
| Edefectf(j) = Edefective + ∑njμj − Egraphene | (3) |
Here, Edefective is the total energy of the graphene sheet with the defect, Egraphene is the total energy of the graphene sheet, nj is the number of defect species either added or removed in relation to pristine graphite, and μj is the chemical potential of N, O, C, and H, respectively, where μC is calculated as the total energy per carbon atom in pristine graphene and μO, μN, and μH are calculated from their respective gas phases, under the assumption that the system is in equilibrium with the gas phase on the surface, and that we are operating under gas rich conditions.76 Hence, μj = 1/2Ej2(j = O, N, H), where Ej2 is the total electronic energy of a diatomic gas molecule J2 in a vacuum. Calculated Edefectf are collected in Table 3.
| Defect | NC | VC | NCVC | NCVC-pass | VC-pass | 3OC | 2OC | NC2OC | OCNC |
|---|---|---|---|---|---|---|---|---|---|
| E defectf | 0.78 | 7.65 | 5.52 | 11.69 | 2.77 | 8.22 | 0.12 | −0.09 | 2.16 |
The experimental defect formation energy for a carbon vacancy (VC) on graphene has been reported to be 7.0 ± 0.5 eV,77 which is in good agreement with our calculations for VC. Nitrogen has an atomic radius very close to that of carbon, and hence does not form a great energetic challenge for substitution (NC). Previous theoretical studies of N-based defects have calculated ENCf as 0.32 eV (ref. 78) and 0.97 eV.79 The latter study includes dispersion corrections, but uses PW91 exchange–correlation functionals, as compared to PBE in this study. Combination of a VC and an NC (NCVC) results in a lower formation energy. Furthermore, the passivated version of this defect (NCVC-pass) would under equilibrium conditions, from an energetic point of view, be unlikely to be present in carbon sheets due to the more than 6 eV increase in defect formation energy upon hydrogen addition to the carbon vacancy. In line with the experimental studies, oxygen-containing defects (NC2OC, 2OC, OCNC) have low formation energies, which explain their prevalence in carbonaceous materials.
The electronic structure of all defective surfaces is presented in Fig. S3 in the ESI.† Nitrogen doped graphene has been used in LIB anodes to increase the electrochemical performance and to increase Li mobility.23 NC (Fig. S3a†) on graphene is here shown to alter the electronic structure of graphene by shifting the Fermi level of the non-defective carbon surface further down the valence band, with both C and N states being occupied at the valence band maximum (VBM). Similar behaviour is observed for the rest of the defects as well, implying that the electronic conductivity as compared to pristine graphene is increased by the inclusion of defects. This could explain the increase seen in the electrochemical performance of nitrogen-decorated graphene sheets.
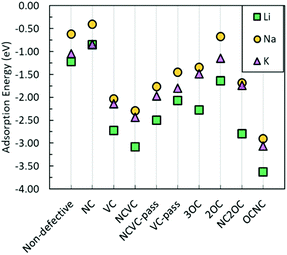
Hence, it could be suggested that the breaking of the six-membered carbon rings is favourable for metal adsorption. The defects that have the most advantageous impact on metal adsorption, in terms of the most negative adsorption energies, from an energetic perspective are NC2OC, OCNC, and NCVC, suggesting from a computational point of view that oxygen-containing defects are important for not only Na incorporation, but also Li and K incorporation. However, the strong adsorption of these metals at defect sites could have detrimental effects on subsequent metal diffusion.
| Eass = Epairf − ∑Eisolated defectsf | (4) |
| Li | Na | K | |
|---|---|---|---|
| NC | 2.98 | 2.25 | 1.22 |
| VC | 1.12 | 0.62 | −0.07 |
| NCVC | 0.76 | 0.36 | −0.36 |
| NCVC-pass | 1.34 | 0.89 | 0.10 |
| VC-pass | 1.77 | 1.20 | 0.27 |
| 3OC | 1.56 | 1.31 | 0.59 |
| 2O2 | 3.05 | 1.98 | 0.99 |
| NC2OC | 1.05 | 0.97 | 0.33 |
| OCNC | 1.55 | 1.57 | 0.49 |
E pairf is the formation energy of the metal and defects in the same system, and Eisolated defectsf is the formation energy of the individual defects infinitely away from each other. A negative association energy is referred to as a binding energy, and indicates that the metal is preferably bonded to a defect site. In other terms, a negative Eass implies that the defect–metal cluster is more energetically stable (i.e. forming a stable bond) than having the defect and metal away from each other on the surface.
Examining Table 4, it is noted that neither Li nor Na is bonded to any of the defects, with positive association energies. The high association energy of the metals and the NC defect could also serve to explain why the NC defect does not lead to stronger metal adsorption energy in comparison with the metal adsorption on the pristine graphene. For K, it is seen from Table 4 that only K–NCVC and K–VC have negative association energies. The small binding energies for K–VC and K–NCVC would be expected to be easily overcome at high temperatures. For K interaction with other defects investigated in this paper, positive association energies are seen, indicating no bonding of K with these defects.
Combining the gained knowledge of binding/association energies and adsorption energies, it can be deduced that graphene defects can be advantageous for batteries as they are attractive adsorption sites for metal ions but do not strongly bind to prohibit the mobility of ions. However, in terms of metal diffusion, apart from the association energy, the metal migration activation energy must also be considered. This is discussed in the next section. Metal diffusion is also dependent on metal migration barriers, which are discussed in the next section.
 | (5) |
Fig. 5 shows that the metal migration from the most stable adsorption site for the OCNC defect (bridge site over the N–O bond) to the hole site on either side of the heteroatoms is highly energetically expensive for all three metals. Li and K show a different behaviour from Na, which can also be seen from the difference in the metal adsorption energy at the different sites. The calculated Na adsorption energies show a much more distinct difference in Na adsorption on site 1 to sites 2 and 3, than Li and K. Hence, Na diffusion is much more hindered by the OCNC defect than Li and K diffusion. Na has previously been suggested to strongly bond/be attracted to oxygen-containing defects, which is supported by the behaviour observed here. Li and K diffusion over the OCNC defect does have high migration barriers, and will hence be slower than that on pristine graphene, but the difference in the adsorption energy between the different adsorption sites is not as severe as for Na. Comparing pathway 1–2 (over the oxygen site), and 1–3 (over the nitrogen site), it is clear that the oxygen site hinders the metal migration more than the nitrogen, and that the Li and K migration is expected to follow pathway 1–3 in devices.
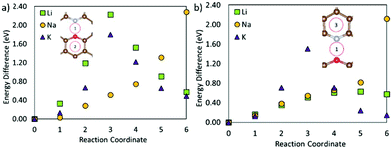 | ||
| Fig. 5 Metal migration paths on the graphene sheet with an OCNC defect following (a) path 1–2 and (b) path 1–3. | ||
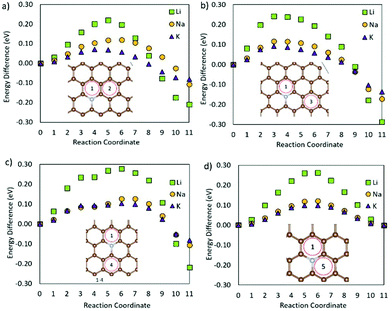
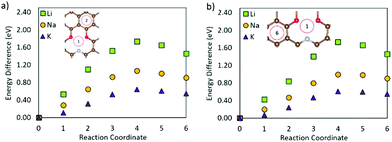
Fig. 6 shows the metal ion migration across and away from the NC defect via different migration paths. It is seen that the metal migration barriers remain very close to those of the metals on pristine graphene (Table 2); Li ion migration has the highest migration barrier, whilst K ion migration shows the lowest migration barrier. The Li ion migration barrier over a C–C bond (Fig. 6a and b) is 0.12 eV lower than the corresponding process on the pristine surface. Li migration over a C–N bond (Fig. 6c and d) has higher energy barriers, but is still lower than those on pristine graphene. The K ion migration away from the NC defect has similar energy barriers to those observed for K ion migration on pristine graphene, and only the migration paths over the C–N bond (Fig. 6c and d) have migration barriers of the same value as on the pristine surface. Similarly, the Na ion migration on graphene with an NC defect is not hindered by the presence of N. Hence, it can be concluded that the presence of NC defects on the crystalline carbon surface planes is beneficial for metal diffusion in these battery materials.
From Fig. 7 it is seen that swapping the nitrogen in the OCNC defect for a second oxygen atom (2OC) changes the migration behaviour of Li. Li is very strongly bonded to site 1, and is here seen to be trapped at the same site. Similarly, K migration from the middle of the defect to a neighbouring hole site has a high migration barrier of 0.40 eV, but a lower end site energy than shown by Li. Na migration on the other hand has an advantage over Li and K for this defect, with its migration barrier only being slightly increased as compared to the pristine carbon. This difference in metal migration behaviour is again attributed to the different sites’ metal adsorption energies, with Na having similar adsorption behaviour on sites along the migration path. Hence, this 2Oc defect, which is very likely to be present in carbonaceous materials, will be beneficial for NIBs in terms of Na surface adsorption, and non-detrimental to Na diffusion; whereas for LIBs and KIBs, this 2Oc defect can harm the Li and K diffusion, at the same time increasing the metal adsorption on the surface.
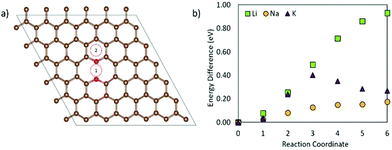 | ||
| Fig. 7 (a) End (2) and starting (1) positions for the metal migration on graphene with a 2OC defect, and (b) the migration path. | ||
Fig. 8 shows the metal migration on the carbon surface containing an NC2OC defect. This defect has very high calculated migration barriers and high concentrations on the carbon surfaces (from defect formation energies). Comparing the individual migration barriers, all metal ions have strongly hindered migration as compared to the pristine carbon surface. Li ion migration is increased by ∼1.3 eV, which would suggest that the presence of this defect in graphene layers in LIB anodes is highly degrading to Li diffusion and LIB cyclability. Na ion migration shows less energetic hindrance than Li ion migration, but has much increased migration barriers compared to Na migration on pristine carbon. Comparably, K ion migration shows lower energy barriers, but these are still markedly higher than those on NC2OC-free surfaces. As opposed to Na ion migration on graphene with an NC2OC defect, K and Li ion migrations do not show a clear dominant surface migration path, whereas Na ion is expected to migrate over the defect neighbouring carbon-sites, and not the oxygen-sites. Finally, the calculated migration barriers show that although NC2OC is beneficial for metal adsorption and storage capacity, and hence contributes to the sloping region in the discharge I–V curve of NIBs,21,24 the metals would be trapped at this defect site. Hence, the presence of the NC2OC defect would be a detrimental factor for metal diffusion leading to a poor anode cycling performance.
To conclude, the metal diffusion on graphene is very likely to be hindered, not by defect–metal binding, but by very strong adsorption energies and high metal migration barriers. Carbon vacancy containing defects markedly increase metal migration barriers, but these barriers can be lowered by passivating the carbons surrounding the vacancy. It is also worth noting that the trapping behaviour of the defects seems to be non-metal specific, with a metal trapping defect leading to higher migration barriers for all metals. The barriers to Li diffusion though, are for all defects higher than those for Na, and K, leading to the expectation that these defects will have a more damaging impact on LIBs. The results regarding the less probable defects are summarised below.
The presence of the NCVC defect (ESI Fig. S13†) on the surface could be detrimental to LIBs and NIBs if the metals encounter this defect, as the energy barriers for Li and Na migration over this defect are higher than that for K migration. For KIBs on the other hand, the lower energy migration paths available for this defect should be dominating over the higher energy ones, and K trapping in terms of metal migration should hence be limited. The presence of an NCVC-pass defect on graphene lowers Eb as compared to NCVC (ESI Fig. S14†). However, Eb compared to pristine graphene is still higher for all metals, and the centre of the defect acts as a metal ion trapping site. The diffusion of metals adsorbed on a VC site (ESI Fig. S15†) is slower than that on the pristine graphene, and an increase of migration activation barriers of ∼0.4 eV is observed for all metal ions. Passivation of the carbon vacancy (VC-pass, ESI Fig. S16†), lowers the metal migration barriers as compared to VC, offering a similar situation to the NCVC and the passivated NCVC defects. Hence, it can be concluded that passivating the surface carbon vacancies in anode materials could reduce the trapping effect of vacancies and increase metal mobility to values close to those at the pristine surface. Finally, the 3OC defect shows higher Eb than that on the pristine surface for all metals (ESI Fig. S17†), but the barrier for Li migration on graphene with a 3OC defect is 0.7 eV higher than that for Na or K migration. From a practical point of view, these high migration barriers should not be detrimental to the anode performance, as the concentration of these defects is expected to be very low.
4. Conclusions
We have conducted a study using dispersion corrected density functional theory calculations on the adsorption and migration behaviour of alkali metals (Li, Na, and K) on pristine and defective graphene surfaces, to understand the role of carbon-based materials in alkali metal battery storage. These computational systems serve as models for surface metal adsorption in carbonaceous anodes for LIBs, NIBs, and KIBs. We showed that Li and K ions have more favourable adsorption energies than Na on pristine graphene, and that this could be directly coupled to the metal s-level position in the conduction band. Secondly, the migration energy barriers for metal migration over three paths were calculated, showing that all three paths are possible, with both Na and K having similar migration behaviour.A number of defects were introduced to the carbon sheet; the likelihood of forming the investigated defects was postulated through the calculations of the defect formation energy. It was found that the formation of nitrogen and oxygen substitutional defects is energetically favourable. The identification of NC2OC as a very probable defect is in line with previous experimental reports on the high concentration of oxygen-containing defects in alkali metal carbonaceous anodes. Metal adsorption in the vicinity of an oxygen-, nitrogen-, hydrogen-, and vacancy-containing defect site is more energetically favourable than metal adsorption on pristine graphene. Hence, the presence of these defects could enhance the performance of carbon-based anode materials. We then investigated how these defects would influence metal diffusion, through the calculation of association energies and migration energy barriers. The association energies did not show any metal–defect bonding that would hinder metal diffusion. The calculated migration energy barriers, however, were higher than for the pristine surface in most cases. The NC2OC defect is energetically favourable, and therefore very likely to be present in these systems, but has been shown to lead to strong adsorption (trapping) of metal ions and high migration barriers which could result in a worse cycling performance.
Conflicts of interest
There are no conflicts to declare.Acknowledgements
EO and QC would like to acknowledge the financial support from the EPSRC (Engineering and Physical Sciences Council) under grant numbers EP/M027066/1 and EP/R021554/1. GC would like to acknowledge the financial support from the National Natural Science Foundation of China under the grant number 21703248. We acknowledge the use of Athena at HPC Midlands+, which was funded by the EPSRC under grant EP/P020232/1, in this research, and the Eureka HPC cluster at the University of Surrey.Notes and references
- B. Scrosati, Electrochim. Acta, 2000, 45, 2461–2466 CrossRef CAS.
- M. S. Balogun, Y. Luo, W. Qiu, P. Liu and Y. Tong, Carbon, 2016, 98, 162–178 CrossRef CAS.
- E. Irisarri, A. Ponrouch and M. R. Palacin, J. Electrochem. Soc., 2015, 162, A2476–A2482 CrossRef CAS.
- M. Á. Muñoz-Márquez, D. Saurel, J. L. Gómez-Cámer, M. Casas-Cabanas, E. Castillo-Martínez and T. Rojo, Adv. Energy Mater., 2017, 7, 1–31 Search PubMed.
- J. C. Pramudita, D. Sehrawat, D. Goonetilleke and N. Sharma, Adv. Energy Mater., 2017, 1602911, 1–21 Search PubMed.
- H. Kim, J. C. Kim, M. Bianchini, D. H. Seo, J. Rodriguez-Garcia and G. Ceder, Adv. Energy Mater., 2018, 8, 1–19 Search PubMed.
- M. D. Slater, D. Kim, E. Lee and C. S. Johnson, Adv. Funct. Mater., 2013, 23, 947–958 CrossRef CAS.
- Y. Qiao, M. Ma, Y. Liu, S. Li, Z. Lu, H. Yue, H. Dong, Z. Cao, Y. Yin and S. Yang, J. Mater. Chem. A, 2016, 4, 15565–15574 RSC.
- J. Y. Park, S. J. Kim, J. H. Chang, H. K. Seo, J. Y. Lee and J. M. Yuk, Nat. Commun., 2016, 9, 922 CrossRef PubMed.
- Crystallography Reviews, CRC handbook of chemistry and physics, ed. D. R. Lide, 89th edn., 2008 Search PubMed.
- P. Bai, Y. He, P. Xiong, X. Zhao, K. Xu and Y. Xu, Energy Storage Mater., 2018, 13, 274–282 CrossRef.
- Z. Jian, Z. Xing, C. Bommier, Z. Li and X. Ji, Adv. Energy Mater., 2016, 6, 1–5 Search PubMed.
- M. Chen, W. Wang, X. Liang, S. Gong, J. Liu, Q. Wang, S. Guo and H. Yang, Adv. Energy Mater., 2018, 8, 1800171 CrossRef.
- S. Komaba, W. Murata, T. Ishikawa, N. Yabuuchi, T. Ozeki, T. Nakayama, A. Ogata, K. Gotoh and K. Fujiwara, Adv. Funct. Mater., 2011, 21, 3859–3867 CrossRef CAS.
- D. A. Stevens and J. R. Dahn, J. Electrochem. Soc., 2001, 148, A803 CrossRef CAS.
- Y. Li, R. A. Adams, A. Arora, V. G. Pol, A. M. Levine, R. J. Lee, K. Akato, A. K. Naskar and M. P. Paranthaman, J. Electrochem. Soc., 2017, 164, A1234–A1238 CrossRef CAS.
- C. Chen, Z. Wang, B. Zhang, L. Miao, J. Cai, L. Peng, Y. Huang, J. Jiang, Y. Huang, L. Zhang and J. Xie, Energy Storage Mater., 2017, 8, 161–168 CrossRef.
- P. Lu, Y. Sun, H. Xiang, X. Liang and Y. Yu, Adv. Energy Mater., 2018, 8, 1–8 CrossRef CAS.
- Y. Zhai, Y. Dou, D. Zhao, P. F. Fulvio, R. T. Mayes and S. Dai, Adv. Mater., 2011, 23, 4828–4850 CrossRef CAS PubMed.
- A. Hashimoto, K. Suenaga, A. Gloter, K. Urita and S. Iijima, Nature, 2004, 430, 870–873 CrossRef CAS PubMed.
- K. Chayambuka, G. Mulder, D. L. Danilov and P. H. L. Notten, Adv. Energy Mater., 2018, 1800079, 1800079 CrossRef.
- J. Kotakoski, A. V. Krasheninnikov, U. Kaiser and J. C. Meyer, Phys. Rev. Lett., 2011, 106, 1–4 CrossRef PubMed.
- Z. Ju, P. Li, G. Ma, Z. Xing, Q. Zhuang and Y. Qian, Energy Storage Mater., 2018, 11, 38–46 CrossRef.
- N. Zhang, Q. Liu, W. Chen, M. Wan, X. Li, L. Wang, L. Xue and W. Zhang, J. Power Sources, 2018, 378, 331–337 CrossRef CAS.
- P. Bai, Y. He, X. Zou, X. Zhao, P. Xiong and Y. Xu, Adv. Energy Mater., 2018, 1703217, 1–9 Search PubMed.
- H. Zheng, Q. Qu, L. Zhang, G. Liu and V. S. Battaglia, RSC Adv., 2012, 2, 4904–4912 RSC.
- P. Lian, X. Zhu, S. Liang, Z. Li, W. Yang and H. Wang, Electrochim. Acta, 2010, 55, 3909–3914 CrossRef CAS.
- J. Hassoun, F. Bonaccorso, M. Agostini, M. Angelucci, G. Betti, R. Cingolani, M. Gemmi, C. Mariani, S. Panero, V. Pellegrini and B. Scrosati, Nano Lett., 2014, 14, 4901–4906 CrossRef CAS PubMed.
- P. Guo, H. Song and X. Chen, Electrochem. Commun., 2009, 11, 1320–1324 CrossRef CAS.
- K. Share, A. P. Cohn, R. Carter, B. Rogers and C. L. Pint, ACS Nano, 2016, 10, 9738–9744 CrossRef CAS PubMed.
- A. Leela, M. Reddy, A. Srivastava, S. R. Gowda, H. Gullapalli, M. Dubey and P. M. Ajayan, ACS Nano, 2010, 4, 6337–6342 CrossRef PubMed.
- O. I. Malyi, K. Sopiha, V. V. Kulish, T. L. Tan, S. Manzhos and C. Persson, Appl. Surf. Sci., 2015, 333, 235–243 CrossRef CAS.
- A. H. Farokh Niaei, T. Hussain, M. Hankel and D. J. Searles, Carbon, 2018, 136, 73–84 CrossRef CAS.
- R. Faccio, L. Fernández-Werner, H. Pardo, C. Goyenola, O. N. Ventura and A. W. Mombrú, J. Phys. Chem. C, 2010, 114, 18961–18971 CrossRef CAS.
- F. B. C. Machado, A. J. A. Aquino and H. Lischka, Phys. Chem. Chem. Phys., 2015, 17, 12778–12785 RSC.
- Y. Okamoto, J. Phys. Chem. C, 2016, 120, 14009–14014 CrossRef CAS.
- T. Umeda, J. Ishoya, T. Ohshima, N. Morishita, H. Itoh and A. Gali, Phys. Rev. B: Condens. Matter Mater. Phys., 2007, 75, 1–6 CrossRef.
- Y. Ma, P. O. Lehtinen, A. S. Foster and R. M. Nieminen, New J. Phys., 2004, 6, 1–15 CrossRef.
- P. Tsai, S.-C. Chung, S. Lin and A. Yamada, J. Mater. Chem. A, 2015, 3, 9763–9768 RSC.
- A. H. Farokh Niaei, T. Hussain, M. Hankel and D. J. Searles, Carbon, 2018, 136, 73–84 CrossRef CAS.
- D. Das, S. Kim, K. R. Lee and A. K. Singh, Phys. Chem. Chem. Phys., 2013, 15, 15128–15134 RSC.
- L. H. Yao, M. S. Cao, H. J. Yang, X. J. Liu, X. Y. Fang and J. Yuan, Comput. Mater. Sci., 2014, 85, 179–185 CrossRef CAS.
- W. Wan and H. Wang, Materials, 2015, 8, 6163–6178 CrossRef CAS PubMed.
- H. Shen, D. Rao, X. Xi, Y. Liu and X. Shen, RSC Adv., 2015, 5, 17042–17048 RSC.
- L. H. Yao, M. S. Cao, H. J. Yang, X. J. Liu, X. Y. Fang and J. Yuan, Comput. Mater. Sci., 2014, 85, 179–185 CrossRef CAS.
- M. Jin, L. C. Yu, W. M. Shi, J. G. Deng and Y. N. Zhang, Sci. Rep., 2016, 6, 1–7 CrossRef.
- G. Kresse and J. Hafner, Phys. Rev. B: Condens. Matter Mater. Phys., 1993, 47, 558 CrossRef CAS.
- G. Kresse and J. Hafner, Phys. Rev. B: Condens. Matter Mater. Phys., 1994, 49, 14251 CrossRef CAS.
- G. Kresse and J. Furthmüller, Comput. Mater. Sci., 1996, 6, 15–50 CrossRef CAS.
- G. Kresse and J. Furthmüller, Phys. Rev. B: Condens. Matter Mater. Phys., 1996, 54, 11169–11186 CrossRef CAS.
- P. E. Blöchl, Phys. Rev. B: Condens. Matter Mater. Phys., 1994, 50, 17953 CrossRef.
- H. J. Monkhorst and J. D. Pack, Phys. Rev. B: Solid State, 1976, 13, 5188–5192 CrossRef.
- J. Perdew, K. Burke and M. Ernzerhof, Phys. Rev. Lett., 1996, 77, 3865–3868 CrossRef CAS PubMed.
- J. Perdew, K. Burke and M. Ernzerhof, Phys. Rev. Lett., 1997, 78, 1396 CrossRef CAS.
- R. F. W. Bader, Atoms in Molecules: A Quantum Theory, Oxford University Press, Oxford, 1990 Search PubMed.
- G. Henkelman, A. Arnaldsson and H. Jónsson, Comput. Mater. Sci., 2006, 36, 354–360 CrossRef.
- X. Fan, W. T. Zheng and J. L. Kuo, ACS Appl. Mater. Interfaces, 2012, 4, 2432–2438 CrossRef CAS PubMed.
- X. Fan, W. T. Zheng, J. L. Kuo and D. J. Singh, ACS Appl. Mater. Interfaces, 2013, 5, 7793–7797 CrossRef CAS PubMed.
- M. Amft, S. Lebègue, O. Eriksson and N. V. Skorodumova, J. Phys.: Condens. Matter, 2011, 23, 395001 CrossRef.
- S. Lee, M. Lee, H. Choi, D. S. Yoo and Y. C. Chung, Int. J. Hydrogen Energy, 2013, 38, 4611–4617 CrossRef CAS.
- S. Grimme, S. Ehrlich and L. Goerigk, J. Comput. Chem., 2011, 32, 1456 CrossRef CAS PubMed.
- S. Thinius, M. M. Islam, P. Heitjans and T. Bredow, J. Phys. Chem. C, 2014, 118, 2273–2280 CrossRef CAS.
- K. T. Chan, J. B. Neaton and M. L. Cohen, Phys. Rev. B: Condens. Matter Mater. Phys., 2008, 77, 1–12 Search PubMed.
- G. Henkelman, VTST Tools, http://theory.cm.utexas.edu/vtsttools/, (accessed 24 August 2018).
- G. Henkelman, B. P. Uberuaga and H. Jónsson, J. Chem. Phys., 2000, 113, 9901 CrossRef CAS.
- G. Henkelman and H. Jónsson, J. Chem. Phys., 2000, 113, 9978 CrossRef CAS.
- K. Nakada and A. Ishii, Solid State Commun., 2011, 151, 13–16 CrossRef CAS.
- Z. Xu, X. Lv, J. Chen, L. Jiang, Y. Lai and J. Li, Carbon, 2016, 107, 885–894 CrossRef CAS.
- S. Yang, S. Li, S. Tang, W. Dong, W. Sun, D. Shen and M. Wang, Theor. Chem. Acc., 2016, 135, 1–11 Search PubMed.
- L. H. Yao, W. Q. Cao and M. S. Cao, Curr. Appl. Phys., 2016, 16, 574–580 CrossRef.
- A. Eftekhari, Z. Jian and X. Ji, ACS Appl. Mater. Interfaces, 2017, 9, 4404–4419 CrossRef CAS PubMed.
- K. Rytkönen, J. Akola and M. Manninen, Phys. Rev. B: Condens. Matter Mater. Phys., 2007, 75, 1–9 CrossRef.
- H. Raebiger, S. Lany and A. Zunger, Phys. Rev. B: Condens. Matter Mater. Phys., 2007, 76, 045209 CrossRef.
- F. Oba, M. Choi, A. Togo and I. Tanaka, Sci. Technol. Adv. Mater., 2011, 12, 034302 CrossRef PubMed.
- S. Zhang and J. Northrup, Phys. Rev. Lett., 1991, 67, 2339–2342 CrossRef CAS PubMed.
- E. Olsson, X. Aparicio-Anglès and N. H. de Leeuw, J. Chem. Phys., 2016, 145, 014703 CrossRef PubMed.
- P. A. Thrower and R. M. Mayer, Phys. Status Solidi, 1978, 47, 11–37 CrossRef CAS.
- Y. Fujimoto and S. Saito, Phys. Rev. B: Condens. Matter Mater. Phys., 2011, 84, 1–7 CrossRef.
- Y.-X. Yu, Phys. Chem. Chem. Phys., 2013, 15, 16819 RSC.
- J. Zheng, Z. Ren, P. Guo, L. Fang and J. Fan, Appl. Surf. Sci., 2011, 258, 1651–1655 CrossRef CAS.
- C. G. Van De Walle and A. Janotti, Phys. Status Solidi B, 2011, 248, 19–27 CrossRef CAS.
- K. Momma and F. Izumi, J. Appl. Crystallogr., 2011, 1272–1276 CrossRef CAS.
Footnote |
| † Electronic supplementary information (ESI) available. See DOI: 10.1039/c8nr10383f |
| This journal is © The Royal Society of Chemistry 2019 |

