 Open Access Article
A sensitive electrochemical sensor based on ZIF-8–acetylene black–chitosan nanocomposites for rutin detection†
Ya-feng Jinab,
Chuang-ye Geb,
Xiao-bo Libc,
Miao Zhangb,
Guang-ri Xu *b and
Dong-hao Li*a
aKey Laboratory of Natural Resources of the Changbai Mountain and Functional Molecular (Yanbian University), Ministry of Education, Park Road 977, Yanji City, Jilin Province 133002, China. E-mail: dhli6510@126.com
bDepartment of Chemistry and Chemical Engineering, Henan Institute of Science and Technology, Xinxiang 453003, China. E-mail: xugr70@163.com; Tel: +86-0373-3693027
cState Key Laboratory of Luminescent Materials and Devices, South China University of Technology, Guangzhou 510641, P. R. China
First published on 21st September 2018
Abstract
Herein, we fabricated a sensitive rutin electrochemical sensor via modifying glassy carbon electrode (GCE) with zeolitic imidazolate framework-8 (ZIF-8) and acetylene black (AB) in the presence of chitosan (CS). The electrochemical activity and experimental parameters of the ZIF-8-AB-CS/GCE sensor were investigated by cyclic voltammetry (CV) and electrochemical impedance spectroscopy (EIS). Under the optimal conditions, the sensor presented a reasonable linear response in the range of 0.1–10 μM with a limit of detection (LOD) as low as 0.004 μM (S/N = 3). The sensor possessed good reproducibility and high stability, and was successfully applied to detect rutin tablet samples with satisfactory results, which was attributed to the synergistic effect between ZIF-8 and AB. Meanwhile, the sensor displayed a potential application for detection of other analytes in real samples. Furthermore, a probable interaction mechanism was proposed to account for the interaction between rutin and the nanocomposite electrode, which was not discussed in previous reports.
1 Introduction
Rutin, also called vitamin P, is a common polyphenolic flavonoid which exists in some sources of vegetal origin, such as fruits, seeds, roots, flowers, tea, wine etc.1 It has been widely applied in the health care system due to its prominent biological activity and pharmacological activity. Generally, rutin is used as an antioxidant and a nutrient enhancer in the human diet, and also as an inhibitor in some disease treatments, for example, as an anti-tumor, anti-hypertensive, anti-bacterial, anti-viral and anti-inflammatory agent. In particular, it can effectively adjust the penetrability of capillaries and stabilize blood platelets.1,2 As a result, it is necessary to establish a sensitive, accurate and facile method for rutin detection in the field of clinical treatment, food nutrition research and pharmaceutical development.Till now, various analytical approaches have been established for rutin analysis, such as high performance liquid chromatography,3 capillary electrophoresis,4 sequential injection analysis,5 chemiluminescence6 and electrochemical analysis. However, most of them are time-consuming, expensive apparatus and complex operation are necessary as well. In contrast, electrochemical analysis possesses the merits of high sensitivity, low cost, and simple operation. Moreover, the hydroxyl groups in rutin are electro-active make it suitable to detect rutin by electrochemical technique. At present, diverse kinds of materials are employed to modify the electrode for the detection of rutin, including organic polymer,7 ionic liquid,8 metal and metal oxide nanoparticles9,10 carbon nanomaterials11–13 and their nanocomposites.14–17 Among them, carbon nanomaterials have attracted tremendous attention due to their features such as good conductivity, high surface area and excellent chemical stability. Du et al.11 developed grapheme nanosheets coated GCE to detect rutin with a LOD of 0.021 μM. Zeng et al.12 prepared a single-walled carbon nanotubes modified gold electrode for rutin sensing and obtained a LOD of 0.01 μM. Song et al.13 utilized AB nanoparticles in the present of dihexadecyl hydrogen phosphate (DHP) to modify GCE, and the LOD for rutin was 10 μg L−1. AB is one kind of carbon black materials with porous structure and has many promising properties such as excellent conductivity, high surface area and strong adsorption capacity. Generally, it serves as conductive agent in the field of energy storage and electrochemical sensors. To date, AB has been successfully applied for the development of modified electrodes to detect diverse species such as methimazole, oxytetracycline and bisphenol A.18–20
Metal–organic frameworks (MOFs) are a new class of porous polymers, consisting of metal clusters and organic linkers, have been widely used in diverse fields, such as gas storage, heterogeneous catalysis, bioimaging, drug delivery, sample pretreatment and so on.21–24 As a typical MOFs, ZIF-8 can be easily synthesized at room temperature with high specific surface area, good chemical stability. Nevertheless, the low conductivity of ZIF-8 confines its application in the field of electrochemical sensor. Up to now, there are rare reports on electroanalysis of rutin based on MOFs to modified electrode. And the mechanism of electrochemical determination of rutin at the nanomaterial modified interface of electrode and electrolyte has not been discussed.
In this work, ZIF-8 nanocrystals were synthesized by solvothermal reaction firstly. A homogeneous dispersion was then prepared by mixing AB in CS aqueous solution. Finally, the above mentioned dispersion was drop-casted on the surface of GCE and dried for the further using. The sensor displays high sensitivity, good stability and reproducibility towards the oxidation and reduction of rutin. The excellent electrochemical performance of the sensor could be attributed to the synergistic effect between ZIF-8 and AB.
2 Experimental
2.1 Reagents
Zinc acetate dihydrate, 2-methylimidazole and chitosan were purchased from Shanghai Aladdin Biochemical Technology Co. Ltd, China. Rutin were purchased from Acros Organics (Shanghai, China). The stock standard solution was 1.0 mM rutin dissolved in anhydrous alcohol stored at 4 °C refrigerator, followed by diluted with 0.1 M phosphate buffer (pH 3) as required. Acetylene black was purchased from Shanghai chemical regent Co. Ltd, China. All the chemicals and regents are analytical grade and used without purification. All aqueous solutions were prepared with deionized water and all experiments were carried out at room temperature.2.2 Instruments
All the electrochemical experiments were performed on a CHI 900 electrochemical workstation (Shanghai CH Instrument, China). A conventional three-electrode system with a glassy carbon electrode (GCE, diameter: 3.0 mm) as the work electrode, an Ag/AgCl electrode as reference electrode, and a platinum wire as a counter electrode. The scanning electron microscope (SEM) images were obtained in Merlin compact (ZEISS, Germany). X-ray diffraction (XRD) was determined using DX-2700B X-ray diffractometer (Shanghai Precision Instrument and Instrument Co. Ltd.).2.3 Synthesis of ZIF-8
ZIF-8 nanoparticles were synthesized referred to the literature.25 Firstly, zinc acetate (0.33 g) and 2-methylimidazole (0.985 g) were dissolved in 90 mL ethanol respectively. 2-Methylimidazole solution was then adding into zinc acetate solution with vigorous stirring. And the reaction was kept for 24 h at room temperature. Finally, the obtained white solution was centrifuged and washed with ethanol for three times, dried in vacuum at 60 °C overnight.2.4 Fabrication of ZIF-8-AB-CS/GCE
The preparation process of ZIF-8-AB-CS/GCE was as follows. First of all, the GCE was polished with 0.05 μm Al2O3 paste and cleaned in ethanol and water by sonication, then dried at room temperature. Subsequently, 0.02 M acetic acid solution containing 1 mg mL−1 CS was prepared. And 2 mg ZIF-8/AB was added into 2 mL CS solution, followed by ultrasonic treatment for homogeneous dispersion. At last, 5 μL dispersion was dropped onto the surface of GCE with a syringe and dried under infrared lamp. The procedure of other materials modified GCE was carried out according to the statement above.3 Results and discussion
3.1 Characterization of ZIF-8, AB and ZIF-8-AB
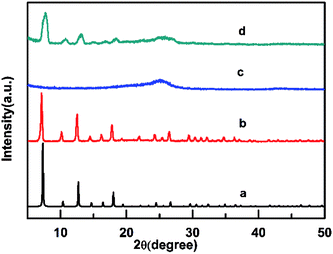
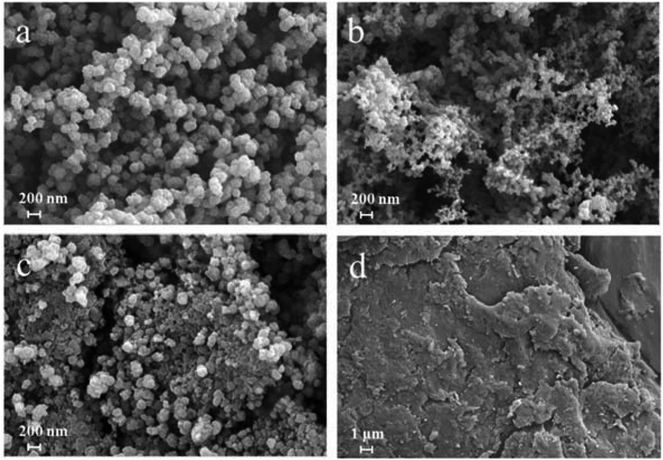
The XRD patterns of simulated ZIF-8, as-synthesized ZIF-8, AB and AB-ZIF-8 nanoparticles are shown in Fig. 1 respectively. The as-synthesized ZIF-8 exhibits obvious characteristic diffraction peak at 2θ values of 7.5°, 12.5° and 18°. And the crystal structure of as-synthesized ZIF-8 matches with the previous reported very well,25 which demonstrates that we synthesized ZIF-8 successfully. AB displays their broad characteristic diffraction peak at 25.5°. ZIF-8-AB composition displayed strong diffraction peak at 2θ values of 7.5°, 12.5°, 18° and 25.5°. Which is in accordance with ZIF-8 and AB. What's more, the peaks becomes somewhat wider. This may be due to the AB particles covers the crystal structure of ZIF-8 partly.To investigate the morphology structure of different modifiers, we examined four kinds of sensors via scanning electronic microscope. Fig. 2(a) shows the synthesized ZIF-8 is a typical rhombic dodecahedron with clear shape. This is quite in accordance with the previous report.26 In addition, the size of ZIF-8 synthesized in our work is about 200 nm. The globular nanoparticles of AB is shown in Fig. 2(b), and the average diameter is about 30 nm. Fig. 2(c) shows the morphology for the composites of ZIF-8 and AB, we find that both ZIF-8 and AB are uniformly attached onto the surface of CS. The size of CS nanoplates are relatively bigger compared with ZIF-8 or AB, and the morphology of CS is shown in Fig. 2(d) with a smooth surface.
3.2 Electrochemical behaviors of modified electrodes
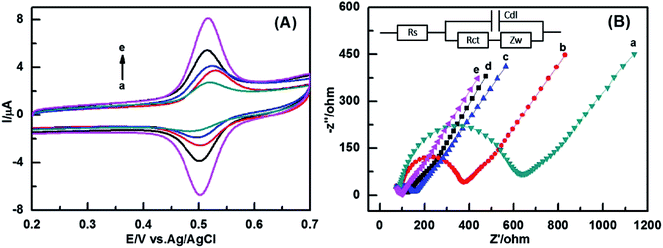
The electrochemical behaviors of five different kinds of electrodes were studied by cyclic voltammetry (CV) in 50 μM rutin in the present of 0.1 M phosphate buffer solution (pH 3), as shown in Fig. 3(A). The oxidation peak potential (Epa) and reduction peak potential (Epc) are at 0.516 V and 0.503 V, respectively. The peak potential separation (ΔEp) of the ZIF-8-AB-CS/GCE is 13 mV, while the ΔEp values of the bare GCE, ZIF-8/GC, CS/GCE, and AB-CS/GCE are 26 mV, 40 mV, 24 mV, 15 mV respectively. The rate constant of electron transfer k0 increases with the decrease of ΔEp value for ferricyanide.27 Thus, the order of k0 value of the five different electrodes was as follows: ZIF-8-AB-CS/GCE > AB-CS/GCE > CS/GCE > bare GCE > ZIF-8/GCE. Moreover, ZIF-8-AB-CS/GCE exhibits the highest redox peak current, and its oxidation peak current is about 2.5 times higher than that of bare GCE. There is a fast electron transfer rate at the interface between the ZIF-8-AB-CS/GCE surface and rutin, all these phenomena may attribute to the sensor has an ultrahigh surface and an excellent conductivity.The electronic transfer kinetics of the five electrodes were also investigated via EIS measurement in 5 mM [Fe(CN)6]3−/4− solution with 0.1 M KCl as supporting electrolyte. The semicircle diameter values at higher frequencies stands for the electronic transfer resistance (Rct), and the linear part shows diffusion process at lower frequencies.28 The equivalent circuit as shown in inset of Fig. 3(B). Rs stands for uncompensated solution resistance, Rct denoted charge transfer resistance arises from the electron transfer process, Cdl means double layer capacitance which formed by free movement of ions, Warburg impedance of Zw, generated by the mass transport process controlled by diffusion, was used to fit the impedance data.29 By fitting the data using the equivalent circuit, we found that the Rct value at the ZIF-8/GCE (640 ohm) is the largest, Rct value at the ZIF-8-AB-CS/GCE (50 ohm) is the smallest. The order of Rct value of the five different electrodes is as follows: ZIF-8-AB-CS/GCE < AB-CS/GCE < CS/GCE < bare GCE < ZIF-8/GCE. It indicates that ZIF-8/GCE has a pretty poor conductivity that causes a low electron transfer rate at the ZIF-8/GCE. On the contrary, ZIF-8-AB-CS/GCE presents a quite fast electron transfer rate in [Fe(CN)6]3−/4− solution, which is also in accordance with the CV results.
3.3 Optimization of conditions
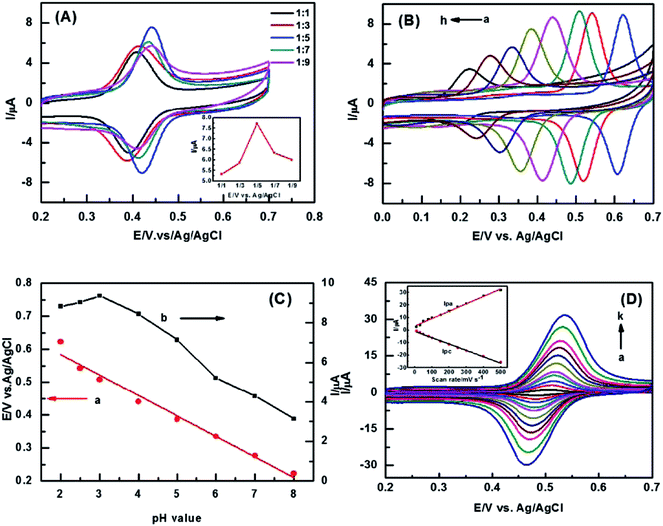
The effect of different mass ratio between ZIF-8 and AB on rutin redox reaction was investigated by CV. Fig. 4(A) shows the peak current gradually increases with the AB amount grows in the beginning. When the mass ratio is 1![[thin space (1/6-em)]](https://www.rsc.org/images/entities/char_2009.gif) :
:![[thin space (1/6-em)]](https://www.rsc.org/images/entities/char_2009.gif) 5, the highest peak current is achieved. Afterwards, the peak current decreases while the AB amount increases continuously. The conductivity of the composite becomes better and better with the amount of AB increases, thus the rate of redox reaction proceeds fast at this time. However, the peak current decreases when the mass ratio is over 1
5, the highest peak current is achieved. Afterwards, the peak current decreases while the AB amount increases continuously. The conductivity of the composite becomes better and better with the amount of AB increases, thus the rate of redox reaction proceeds fast at this time. However, the peak current decreases when the mass ratio is over 1![[thin space (1/6-em)]](https://www.rsc.org/images/entities/char_2009.gif) :
:![[thin space (1/6-em)]](https://www.rsc.org/images/entities/char_2009.gif) 5, the reasons may be attributed to three aspects: on one hand, the aggregation of AB nanoparticles hinders electron transfer. On the other hand, the surface of ZIF-8 is covered by AB nanoparticles which may cause the loss of its catalytic activity. In addition, the penetration of solution will become difficult with the thickness of the surrounding AB increase. The synergistic effect mainly reflects in how to balance of the conductivity and the catalytic activity of composites. The electrode prepared at 1
5, the reasons may be attributed to three aspects: on one hand, the aggregation of AB nanoparticles hinders electron transfer. On the other hand, the surface of ZIF-8 is covered by AB nanoparticles which may cause the loss of its catalytic activity. In addition, the penetration of solution will become difficult with the thickness of the surrounding AB increase. The synergistic effect mainly reflects in how to balance of the conductivity and the catalytic activity of composites. The electrode prepared at 1![[thin space (1/6-em)]](https://www.rsc.org/images/entities/char_2009.gif) :
:![[thin space (1/6-em)]](https://www.rsc.org/images/entities/char_2009.gif) 5 is selected for the rest of experiments.
5 is selected for the rest of experiments.
The effect of pH on rutin detection at the sensor is shown in Fig. 4(B). It is noted that the redox peak current increases with pH value increases from 2 to 3. Subsequently, the redox peak currents shrink gradually when pH value is higher than 3. This can be explained by the varying of the amount of protons participating in the electrochemical redox of rutin in different pH conditions. In strong acid solution, there are so many of protons which is beneficial for the redox of ruin. The redox reaction becomes more difficult due to the continuously decreasing of the protons with the increasing of pH. The Fig. 4(C) displays that all of the redox peaks shift negatively as increasing of pH value. Moreover, the oxidation peak potential is liner response to pH value. The liner regression equation is as follows: Epa (V) = −0.0623pH + 0.7087 (R2 = 0.9786). The slope of the equation is 62 mV, which is close to the Nernst equation theoretical value of 59 mV, indicates that there are equal number of protons and electrons during the rutin redox reaction at the sensor.30 In addition, the oxidation peak potential shifts more positively when pH value of 2. This may because the CS film becomes unstable partly in too much acidic environment, leading to a peeling-off of the ZIF-8-AB-CS composite. Considering the sensitivity of sensor, pH 3 was chosen for detection rutin in next experiment.
The effect of scan rate on rutin redox at the modified sensor was studied by CV in the range of 10 mV s−1 to 500 mV s−1. Fig. 4(D) shows the redox peak current increases linearly with increasing scan rate. This implies that the redox of rutin is a quasi-reversible reaction.30 Both oxidation peak current and reduction peak current are linear response to scan rate with the equations respectively: Ipa (μA) = 0.0590v (mV s−1) + 3.1831 (R2 = 0.9922), Ipc (μA) = −0.0508v (mV s−1) − 0.9873 (R2 = 0.9971). In other words, the redox peak current is in proportion to scan rate. Hence, it demonstrates that the behavior of rutin at the ZIF-8-AB-CS/GCE is an adsorption-controlled process. On the basis of the equation of Ipa = n2F2vAΓ*/4RT = nFQv/4RT,30 the number of electron transfer n is about 2. Therefore, it manifests there are two protons and two electrons involved in the electrochemical redox reaction of rutin.
3.4 Possible interaction mechanism of rutin and ZIF-8-AB-CS/GCE
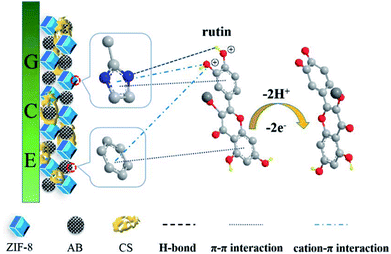
Scheme 1 shows the probable detection mechanism of rutin at the ZIF-8-AB-CS/GCE sensor. First of all, the π–π stacking interactions between the phenyl structures of rutin and the aromatic imidazole rings of ZIF-8, as well as the hexagonal carbonaceous rings of AB may contribute to the oxidation of rutin partially.31 Secondly, the pK1 of rutin is about 7, thus rutin will become positively charged in the acidic environment.32 The positively charged rutin could interact with ZIF-8 and AB easily via the cation–π interaction. Additionally, the hydrogen bonding interaction between Zn–N sites of ZIF-8 and the –OH groups of rutin also has the effect on the detection of rutin.24 What's more, the conjugated aromatic rings in the molecular structure of rutin could also facilitate the electron transportation from rutin to the modified GCE.7 Hence, the significant sensitivity enhancement for rutin detection could be assigned to the combined effect of all these interactions.3.5 Quantitative determination of rutin
Under the optimal conditions, the determination of different concentrations of rutin at the ZIF-8-AB-CS/GCE sensor was examined by DPV. Fig. 5 shows that the peak current increases as the concentration of rutin increases. And the peak current presents linear relationship with rutin in the range of 0.1 μM to 10 μM. The linear equation can be expressed as: Ipa (μA) = 0.4569C (μM) − 0.1575 (R2 = 0.9969) with the LOD of 0.004 μM (S/N = 3). And the limit of quantitate (LOQ) is 0.013 μM (S/N = 10). Compared with the results from other analysis methods, the sensor exhibits a higher sensitivity than many other electrodes for rutin detection. The specific parameters are shown in Table 1.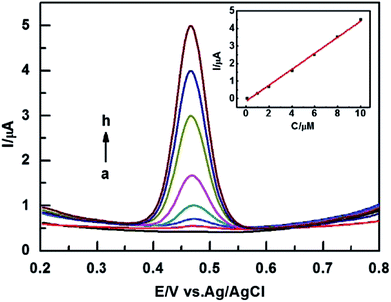 | ||
| Fig. 5 DPVs of ZIF-8-AB-CS/GCE in 0.1 M PBS containing different concentration (from (a) to (h): 0, 0.1, 1, 2, 4, 6, 8, 10 μM) of rutin solution. Scan rate: 100 mV s−1. | ||
| Electrodes | Methods | Linear range (μM) | LOD (μM) | Reference |
|---|---|---|---|---|
| a PAMAM: poly(amidoamine) dendrimers.b MIP: molecularly imprinted polymer.c MWCNTs: multiwalled carbon nanotubes.d PdPc: palladium phthalocyanine.e CoFe2O4NPs: nanoparticles.f ILs: ionic liquids.g CPE: carbon paste electrode.h GO: graphene oxide.i SWV: scan wave voltammograms. | ||||
| PAMAMa/graphene/GCE | DPV | 0.001–2 | 0.0006 | 33 |
| Graphene/GCE | DPV | 0.1–2 | 0.023 | 34 |
| MIPb/graphene-MWCNTsc/GCE | DPV | 0.01–1 | 0.005 | 35 |
| PdPcd-MWCNTs/GCE | DPV | 0.1–51 | 0.075 | 36 |
| CoFe2O4NPse/ILsf/CPEg | DPV | 0.0001–0.01 | 0.00005 | 37 |
| GOh-chitosan/GCE | SWVi | 0.9–90 | 0.56 | 38 |
| ZIF-8-AB-CS/GCE | DPV | 0.1–10 | 0.004 | This work |
3.6 Selectivity, reproducibility, and stability
Selectivity of the sensor is an important property of the whole determination method. To investigate the selectivity of the sensor, some inorganic compounds and organic compounds are chosen as interference. CuCl, FeSO4, KNO3, NaCl, VB2, tyrosine (Tyro), tryptophan (Tryp) were added to 5 μM rutin, respectively. The concentration of inorganic compounds or organic compounds were 100-fold of rutin. The results are shown in Fig. S1 and Table S1.† It manifests that the sensor has a high selectivity. And the relative error deviation is less than 5%. Further, we studied the reproducibility and stability of the sensor. The reproducibility experiment was executed via scanning 20 circles successively with CV at the ZIF-8-AB-CS/GCE in 50 μM rutin solution (pH 3). The RSD of the same sensor is 0.6–1.0%, and the RSD for sensor to sensor (N = 5) is 2.5–3.6% in the same day. Finally, we stored the sensor in refrigerator for 120 hours and studied its long-term stability. The peak current value is about 85% of initial current value (RSD = 3.0%, N = 3). The results indicates that the sensor has a good stability.3.7 Real sample analysis
To evaluate the practicality of the developed method, we purchased rutin tablets (20 mg per tablet) from local pharmacy. Firstly, three tablets were accurately weighed and then grounded into fine powder respectively. Then, the powder was dissolved into 10 mL ethanol by sonication. Next, 0.025 mL, 0.05 mL and 0.1 mL dispersion were transferred into 50 mL volumetric flask and diluted with 0.1 M PBS (pH 3) to volume respectively. At last, the concentration of the diluted rutin solution was detected by DPV at same electrode and calculated with the linear equation in section of 3.5. Table S2† shows the recoveries of four parallel samples are 96.0–104.6%. It demonstrates the proposed method based on the ZIF-8-AB-CS/GCE has a quite good accuracy and practical applicability.4 Conclusions
In summary, a sensitive and simple electrochemical sensor based on ZIF-8-AB-CS was successfully fabricated towards rutin determination. ZIF-8-AB-CS/GCE exhibits more excellent electrochemical performance than ZIF-8-CS/GCE and AB-CS/GCE. This phenomenon may due to the synergistic effect between ZIF-8 and AB. Meanwhile, the results shows that the sensor has good selectivity, reproducibility, stability and recoveries from the real samples. Moreover, the sensor has a potential application for the electrochemical sensing of other targets. The approach of sensor fabrication also could be used to construct other types of sensors.Conflicts of interest
There are no conflicts to declare.Acknowledgements
This work was supported by the open fund of the State Key Laboratory of Luminescent Materials and Devices in South China University of Technology (No. 2018-skllmd-09), the Science and Technology Plan Projects of Henan Province (No. 172102410085) and the Key Research Projects for Institutions of Higher Education from the Department of Education, Henan Province (No. 17A150010).References
- S. Sharma, A. Ali, J. Ali, J. K. Sahni and S. Baboota, Expert Opin. Invest. Drugs, 2013, 22, 1063–1079 CrossRef PubMed
.
- S. Chen, J. Gong, F. Liu and U. Mohammed, Immunology, 2000, 100, 471–480 CrossRef PubMed
.
- E. Mesquita and M. Monteiro, Food Res. Int., 2018, 106, 54–63 CrossRef PubMed
.
- A. F. Memon, A. R. Solangi, S. Q. Memon, A. Mallah, N. Memon and A. A. Memon, Food Anal. Methods, 2017, 10, 83–91 CrossRef
.
- T. A. Matyushina, E. I. Morosanova and Y. A. Zolotov, J. Anal. Chem., 2010, 65, 308–315 CrossRef
.
- S. Li, L. Zhang, L. Chen, Y. Zhong and Y. Ni, Anal. Methods, 2016, 8, 4056–4063 RSC
.
- X. Chen, Z. Wang, F. Zhang, L. Zhu, Y. Li and Y. Xia, Chem. Pharm. Bull., 2010, 58, 475–478 CrossRef PubMed
.
- Y. Zhang and J. Zheng, Talanta, 2008, 77, 325–330 CrossRef PubMed
.
- B. Wang, R. Gui, H. Jin, W. He and Z. Wang, Talanta, 2018, 178, 1006–1010 CrossRef PubMed
.
- Y. Wei, G. Wang, M. Li, C. Wang and B. Fang, Microchim. Acta, 2007, 158, 269–274 CrossRef
.
- D. Haijun, Y. Jianshan, Z. Jiaqi, H. Xiaodan and Y. Chengzhong, Electroanalysis, 2010, 22, 2399–2406 CrossRef
.
- B. Zeng, S. Wei, F. Xiao and F. Zhao, Sens. Actuators, B, 2006, 115, 240–246 CrossRef
.
- J. Song, J. Yang, J. Zeng, J. Tan and L. Zhang, Microchim. Acta, 2010, 171, 283–287 CrossRef
.
- H. Yang, B. Li, R. Cui, R. Xing and S. Liu, J. Nanopart. Res., 2017, 19, 354 CrossRef
.
- X. Niu, Z. Wen, X. Li, W. Zhao, X. Li, Y. Huang, Q. Li, G. Li and W. Sun, Sens. Actuators, B, 2018, 255 Search PubMed
.
- R. Xing, X. Zhao, Y. Liu, J. Liu, B. Liu, Y. Ren, S. Liu and L. Mao, J. Nanosci. Nanotechnol., 2018, 18, 4651–4657 CrossRef PubMed
.
- J. Zhang, S. Cui, Y. Ding, X. Yang, K. Guo and J. Zhao, Ceram. Int., 2018, 44, 7858–7866 CrossRef
.
- J. Sun, T. Gan, W. Meng, Z. Shi, Z. Zhang and Y. Liu, Anal. Lett., 2015, 48, 100–115 CrossRef
.
- W. Yazhen, Bioelectrochemistry, 2011, 81, 86–90 CrossRef PubMed
.
- T. Yuanbin, J. Jing, Z. Shenghui, S. Zhen, W. Jinshou, Z. Jingdong, P. Wenhong and Y. Changzhu, Electroanalysis, 2016, 28, 189–196 CrossRef
.
- A. H. Chughtai, N. Ahmad, H. A. Younus, A. Laypkov and F. Verpoort, Chem. Soc. Rev., 2015, 44, 6804–6849 RSC
.
- J. Della Rocca, D. Liu and W. Lin, Acc. Chem. Res., 2011, 44, 957–968 CrossRef PubMed
.
- S. Liu, L. Sun, F. Xu, J. Zhang, C. Jiao, F. Li, Z. Li, S. Wang, Z. Wang, X. Jiang, H. Zhou, L. Yang and C. Schick, Energy Environ. Sci., 2013, 6, 818–823 RSC
.
- H.-B. Shang, C.-X. Yang and X.-P. Yan, J. Chromatogr. A, 2014, 1357, 165–171 CrossRef PubMed
.
- P. Gai, H. Zhang, Y. Zhang, W. Liu, G. Zhu, X. Zhang and J. Chen, J. Mater. Chem. B, 2013, 1, 2742–2749 RSC
.
- K. S. Park, Z. Ni, A. P. Côté, J. Y. Choi, R. Huang, F. J. Uribe-Romo, H. K. Chae, M. O'Keeffe and O. M. Yaghi, Proc. Natl. Acad. Sci. U. S. A., 2006, 103, 10186–10191 CrossRef PubMed
.
- R. S. Nicholson, Anal. Chem., 1965, 37, 1351–1355 CrossRef
.
- L. Suresh, P. K. Brahman, K. R. Reddy and J. S. Bondili, Enzyme Microb. Technol., 2018, 112, 43–51 CrossRef PubMed
.
- E. A. Khudaish, F. Al-Nofli, J. A. Rather, M. Al-Hinaai, K. Laxman, H. H. Kyaw and S. Al-Harthy, J. Electroanal. Chem., 2016, 761, 80–88 CrossRef
.
- A. J. Brad and L. R. Faulkner, Electrochemical methods: Fundamentals and applications, Wiley, 1980 Search PubMed
.
- J.-Q. Jiang, C.-X. Yang and X.-P. Yan, ACS Appl. Mater. Interfaces, 2013, 5, 9837–9842 CrossRef PubMed
.
- C. Mielczarek, Eur. J. Pharm. Sci., 2005, 25, 273–279 CrossRef PubMed
.
- H. Yin, Y. Zhou, L. Cui, T. Liu, P. Ju, L. Zhu and S. Ai, Microchim. Acta, 2011, 173, 337–345 CrossRef
.
- Y. Lei, D. Du, L. Tang, C. Tan, K. Chen and G.-J. Zhang, Anal. Lett., 2015, 48, 894–906 CrossRef
.
- L. Yang, J. Yang, B. Xu, F. Zhao and B. Zeng, Talanta, 2016, 161, 413–418 CrossRef PubMed
.
- R. Xing, H. Yang, S. Li, J. Yang, X. Zhao, Q. Wang, S. Liu and X. Liu, J. Solid State Electrochem., 2017, 21, 1219–1228 CrossRef
.
- M. L. Yola, C. Göde and N. Atar, J. Mol. Liq., 2017, 246, 350–353 CrossRef
.
- M. Arvand, A. Shabani and M. S. Ardaki, Food Anal. Methods, 2017, 10, 2332–2345 CrossRef
.
Footnote |
| † Electronic supplementary information (ESI) available. See DOI: 10.1039/c8ra06452k |
| This journal is © The Royal Society of Chemistry 2018 |

