 Open Access Article
Theoretical studies on the structural and spectral properties of two specific C54 isomers and the chlorinated species C54Cl8†
Xitong Song,
Xiaoqi Li and
Jiayuan Qi *
*
College of Chemistry, Fuzhou University, Fuzhou, Fujian 350116, China. E-mail: jyqi@fzu.edu.cn
First published on 21st September 2018
Abstract
X-ray photoelectron (XPS) and near-edge X-ray absorption fine structure (NEXAFS) spectra as well as the ground-state electronic/geometrical structures of #540C54 captured in experiment and the most controversial isomer #369C54 (C2v- and Cs-symmetry, respectively) have been calculated at the density functional theory (DFT) level. After chlorination, significant changes were observed in the electronic structure and X-ray spectra. Both XPS and NEXAFS spectra showed strong isomer dependence. The results indicated that the “fingerprints” in the X-ray spectra afforded an effective way to identify the fullerene isomers mentioned above. Ultraviolet-visible (UV-Vis) absorption spectroscopy of C54Cl8 was also simulated at the time-dependent (TD) DFT level, and the simulated UV-Vis spectrum was in accordance with the experimental result. The results of this study can provide valuable information for further experimental and theoretical studies of new fullerenes and their derivatives through X-ray and ultraviolet spectroscopy. The study of newly synthesized fullerene isomers and their derivatives using X-ray and UV-Vis spectra offers valuable information for further experimental and theoretical exploration.
1 Introduction
Owing to unique physicochemical properties and the potential in technical applications, fullerenes and their complex compounds have drawn extensive attention from researchers worldwide since the discovery of C60 in 1985.1 Many higher fullerenes such as C76, and C78 have been observed and successfully isolated.2,3 However, for the fullerenes that are smaller than C60, it is ineluctable to have adjacent pentagons, and they violate the isolated pentagon rule (IPR).4 Due to enhanced local steric strain, non-IPR fullerenes that have contiguous pentagons are unstable and difficult to synthesize and isolate. Fortunately, researchers have made tremendous progress in solving this problem by endohedral modifications (such as encapsulating metal ions or clusters) and exohedral modifications (such as connecting with chlorine or hydrogen), resulting in stable derivatives of the non-IPR cage.5 Also, many non-IPR fullerenes have been captured such as #916C56Cl12, #540C54Cl8 and #271C50Cl10 (denominated by Flower's spiral algorithm6).7,8 Due to the large number of isomers and more active chemical properties, the identification of isomers has become a difficult problem for chemists.As early as 2004, when Xie et al. synthesized C50Cl10,8 C54 had been captured as a by-product in a chlorine-involving arc-discharge process without isolation. Then, in 2006, Gao et al. simulated the relative energy and topological parameters of all 580 isomers of C54 using semiempirical PM3 methods, and they predicted the structure of C54Cl8.9 However, it was not captured for a long time until the breakthrough experiment in 2010. Tan et al. successfully captured C2-#540C54Cl8 with two pairs of triple sequentially fused pentagons (TSFP) in 2010;7 they reported detailed characterization by UV-Vis and a series of X-ray crystallography data. The structure of the observed non-IPR isomer was similar to the structure predicted by Gao et al.9 In 2012, Zheng et al. probed into the specific selectivity of the chlorination reaction of C54Cl8.10 The results showed that C2v-#540C54 was the most stable carbon cage, whereas C2-#540C54Cl8 was the most stable isomer based on thermodynamics. It is worth mentioning that his group preferred an intriguing theoretical isomer #369C54 and proposed the following question: “why the relative energy of #369C54Cl8 is lower than that of the captured C2-#540C54Cl8?” Herein, we report that #369C54 has 3 pairs of double fused pentagons (DFP) and triple directly fused pentagons (TDFP), and their relative energy is higher than those of #540C54, #537C54 and #541C54 (in order of increasing energy). In the future, #369C54Cl8 can also be captured in an experiment. Heretofore, some C54-related information (C54N6, C54H24, C54Si6, and B3N4C54) has been reported;11–14 however, these studies mainly focused on the relative energy and the addition reaction of isomers and did not report in-depth research.
In this report, a series of comparative studies on pure carbon cage and the corresponding chlorinated derivatives of two isomers of C54 are presented. We have explored the electronic structure and optical properties of the two isomers as well as their corresponding chlorinated derivatives by virtue of X-ray and ultraviolet-visible (UV-Vis) spectra. These techniques are atom-specific and sensitive to different local chemical environments of atoms.15 They have been demonstrated to be effective in the determination of the electronic structure of many molecules, surfaces, or bulk materials. We have simulated the X-ray photoelectron spectra (XPS) and the near-edge X-ray absorption fine structure (NEXAFS) spectra of #540C54 and #369C54 (hereinafter referred to as C2v-#540C54 and Cs-#369C54) as well as their corresponding chlorinated derivatives #540C54Cl8 and #369C54Cl8 (hereinafter referred to as C2-#540C54Cl8 and Cs-#369C54Cl8) at the density functional theory (DFT) level. NEXAFS is a sensitive technique for the accurate determination of electronic structure, especially the unoccupied molecular orbitals of molecules; XPS focuses on the information of core orbits, which can thus be used to identify elements and their chemical states in a quantitative manner. In regard to UV-Vis spectroscopy, it is a commonly used technique of characterization in experiments because it can reflect the electronic structure information of the valence band in the system. Many theoretical groups have explored the electronic structures of fullerenes and their corresponding chlorinated derivatives using UV-Vis spectroscopy; the results show that UV-Vis spectra are isomer-dependent, and the identification of electronic structure is credible.16–20 Hence, we also simulate the UV-Vis spectrum of the experimentally captured isomer C2-#540C54Cl8, and the simulation result is in agreement with the experimental results. In general, systematic spectral researches can enhance our comprehension of compounds.
This paper is constituted as follows: Section II describes our computational methods to investigate the electronic structures as well as NEXAFS, XPS and UV-Vis spectra. Section III presents the spectral results and our detailed discussion. Concluding remarks are finally given in Section IV.
2 Computational methods
In this study, we used molecular graphics molecular mechanics, molecular graphics and quantum chemistry to explore the electronic structure and X-ray spectroscopy properties of fullerene in detail. First, the initial coordinates of the two isomers Cs-#369C54Cl8 and C2-#540C54Cl8 were obtained from Zheng et al. and the crystallographic data (CIF) of previous experimental results,7,10 respectively. Subsequently, geometry optimizations of the two C54 isomers and the two chlorinated species were achieved at the B3LYP21,22/6-31G(d, p) level with the Gaussian 09 quantum chemical package.23 Considering the dispersive interaction in the functional, we used wB97XD and B3LYP to simulate the optimization of the structure and the energy of the chlorides, respectively. The potential pitfall of the optimization process is that the hybrid density functional method (B3LYP) cannot describe the weak interaction easily. However, according to our calculations, the slight effects on the systems of the present study could be reasonably neglected (please see Table S7 in the ESI†). The obtained geometries were then used to generate X-ray photoelectron spectra (XPS) and near-edge X-ray absorption fine structure spectra (NEXAFS) as well as ultraviolet-visible (UV-Vis) spectra. Ultimately, we chose a much bigger basis set 6-311++G(3df,3pd) to calculate the single point for further energy and charge population analyses. All the energy values we obtained were corrected by ZPE. According to our calculation, the trends of the energy and the stability of corresponding isomers were in agreement with the results of a previous investigation, where the basis set was smaller (such as 3-21G, 6-31G*,6-311G**). Only a slight difference (around 0.1–1 kcal mol−1) could be observed in relative energies. Compared with the results of the previous surveys, we provide more accurate results because of our more rational and authentic computational level.Also, we use the StoBe program24 at the DFT level with the gradient corrected Becke (BE88) exchange25 and the Perdew (PD86) correlation functionals26 to simulate NEXAFS and XPS spectra. To achieve the convergence of the nuclear hole state, the triple-ζ quality individual gauge for localized orbital (IGLO-III) basis set of Kutzelnigg et al. has been chosen for the excited carbon atom, whereas the other non-excited carbon atoms and chlorine atoms have been depicted by model core potentials.27 We also mention the way that we adopted a full core-hole (FCH) potential method combining a double basis set technique. We used a standard basis set for obtaining the lowest energy of the system, whereas we adopted an auxetic diffuse basis set (19s, 19p, 19d) for simulating NEXAFS spectra in theory.
The FCH method has been validated since NEXAFS can offer precise transition moments and good relative energy in the simulation of fullerene. To obtain the absolute energy, the spectra should be calibrated so that the first spectral feature [1s → the lowest unoccupied molecular orbital (LUMO)] coincides with that from the ΔKohn–Sham (ΔKS) approach.28,29 Ionization potentials (IPs) have been obtained by a similar calibration using the energy difference between the fully optimized core-ionized state and the ground state. Thus, for all spectra, a shift of +0.2 eV has been employed to account for the differential relativistic effect due to the introduced core hole.28 Using a Gaussian function with full width at half maximum (FWHM) of 0.3 eV below IP and a Stieltjes imaging approach in the region above,30,31 NEXAFS spectra can be obtained. The final XPS spectra are generated by broadening the IP values with a Lorentzian line shape with FWHM values set at 0.15 eV and 0.2 eV for different spectral lines.
The UV-Vis absorption spectrum is calculated using time-dependent (TD) DFT calculations at the B3LYP21,25/def2-TZVP32,33 level by the ORCA program.34 Previous researches indicate that the functionals with varying fractions of the Hartree–Fock (HF) exchange have different excitation energies. To be specific, the excitation energy can increase with increasing HF% such as TPSSh (10% HF), O3LYP (11.61% HF), B3LYP (20% HF) and PBE0 (25% HF).34,35 During the simulation process, to accelerate the course of calculation, we adopt RIJCOSX approximations combined with the auxiliary basis set def2-TZVP/J. Considering the solvation effect of the toluene solution in the experiment, the solvation energies are estimated at the optimized geometries in the toluene solution using the conductor-like screening model (COSMO).36 The final UV-Vis spectrum is obtained by a Gaussian functional convolution with FWHM set at 3000 cm−1, which constitutes an average width for an absorption band observed in the UV-Vis range.37
3 Results and discussion
3.1 Geometrical and electronic structure
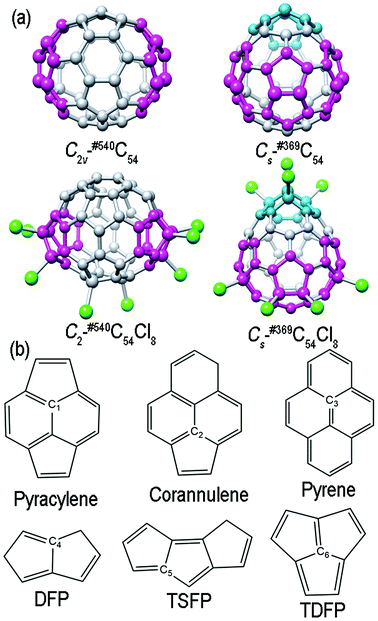
Optimized structures of the two C54 isomers and the two corresponding chlorides are shown in Fig. 1(a) (DFP and TSFP are colored in pink and blue, respectively; the chlorine atoms are colored in green). DFP and TDFP presented in Cs-#369C54 as well as in the corresponding chloride Cs-#369C54Cl8 are the most distinct geometrical features; besides, both C2v-#540C54 and its corresponding chloride C2-#540C54Cl8 show two pairs of TSFP structures. In accordance with the results obtained after optimizing, due to the addition of chlorine atoms, the symmetry of the parent #540C54 is reduced from C2v to C2, whereas #369C54 still maintains Cs symmetry. The results are consistent with the experimental results and other previous theoretical calculations.Then, the singlet and triplet states of the two C54 isomers and the corresponding chlorides C54Cl8 have been considered (please see Table S5 in the ESI†). Furthermore, the results show that the ground states of the above clusters are all singlet states. Table 1 shows the numerical values of bond lengths, the HOMO (Highest Occupied Molecular Orbital)–LUMO (Lowest Unoccupied Molecular Orbital) gaps of all studied species and the relative total energies of the two fullerene isomers. From the results, we can conclude that although the shortest and the longest bond lengths of the two C54 isomers are different, this cannot offer useful information about their relative stabilities as their average values are the same (1.436 Å and 1.436 Å). We have also found that Cs-#369C54 shows higher relative energy [28.76 kcal mol−1 at the B3LYP/6-31G(3df, 3pd) level, which is approximately consistent with another calculated result of 30.29 kcal mol−1 at the B3LYP/3-21G level]. Meanwhile, the relative energies of the corresponding chlorides show an opposite trend, i.e., the relative energy of C2-#540C54Cl8 is higher than that of Cs-#369C54Cl8 (about 9.57 kcal mol−1), which is in agreement with another calculated result of 9.48 kcal mol−1 (at the B3LYP/6-311G** level). The trends of the HOMO–LUMO gap of the parent cages as well as the corresponding chlorides are the same as that of their relative energies. In terms of bond length data, chlorination stretches the C–C bond length of the carbons connected to chlorine atoms. We use X-ray spectroscopy to further study this, as presented in the next section. As displayed in Table 1, we have also calculated the binding energies (BE, indicated as ΔEb) between the C54 backbone and chlorine molecules, which was taken as the chlorine source in the experiment.7,38 In this study, binding energy is defined as the total energy difference between the chlorinated species and the separated fragments (the carbon cage and n chlorine molecules), i.e.,
| ΔEb = Echlorinated species − (Efullerene backbone + n × ECl2), |
| Molecule | Shortest Rcc | Longest Rcc | Average Rcc | Gap | ΔE | ΔEb | ρC |
|---|---|---|---|---|---|---|---|
| C2v-#540C54 | 1.374 | 1.483 | 1.436 | 1.271 | 0.00 | — | — |
| Cs-#369C54 | 1.387 | 1.492 | 1.436 | 1.630 | 28.76 | — | — |
| C2-#540C54Cl8 | 1.374 | 1.612 | 1.452 | 3.079 | 9.57 | −576.88 | 6.859 |
| Cs-#369C54Cl8 | 1.369 | 1.598 | 1.452 | 2.311 | 0.00 | −601.18 | 7.587 |
To better understand the interaction between C54 and Cl2 molecules, we have also analyzed the Mulliken charge distribution of C2-#540C54Cl8 and Cs-#369C54Cl8. The sum of Mulliken charges over all carbon atoms (ρC) can qualitatively represent the charge transfer during the process of chloridization. As shown in Table 1, the ρC values of the two chlorinated species (C2-#540C54Cl8 and Cs-#369C54Cl8) are around 6.859e and 7.587e, respectively, from which we have inferred that the charge of each chlorine atom reaches approximately −1e. The results show strong electron acceptor and donor characteristics of Cl2 and the C54 backbone, respectively. The strong electron transfer and electrostatic interaction uncover great changes in electronic and geometrical structures after chlorination. A distinct increase in the C–C bond length indicates structural deformation (Table 1), whereas the changes in the electronic structure are indicated by XPS and NEXAFS spectra, as described below.
Grouping the carbon atoms of fullerenes according to the local environment is a common classification way.39 As shown in Fig. 1(b), there are three types of carbon sites40,41 that are commonly distinguished: (1) the pyracylene site C1, where the carbon atom lying in a pentagon ring is attached to another pentagon by an external bond; (2) the corannulene site C2, where the carbon atom lying in a pentagon ring is attached to a hexagon by an external bond; (3) the pyrene site C3, where the carbon atom is a common part of the three hexagons. Besides, there are also new carbon sites in Cs-#369C54 and C2v-#540C54 isomers: (4) the DFP site C4, where the carbon atom lies in a pentagon–pentagon ring fusion; (5) the TSFP site C5, where the carbon atom lies in the fused triple sequentially pentagons; (6) the TDFP site C6, where the carbon atom lies in the intersection of the three fused pentagons. The different combinations of these six carbon sites give rise to different isomers. As an example, there are 28 pyracylene sites, 11 corannulene sites, 5 Pyrene sites and 6 DFP sites for Cs-#369C54 and Cs-#369C54Cl8; also, there are 38 pyracylene sites, 6 corannulene sites, 2 pyrene sites and 8 TSFP sites for C2v-#540C54 and C2-#540C54Cl8.
3.2 XPS
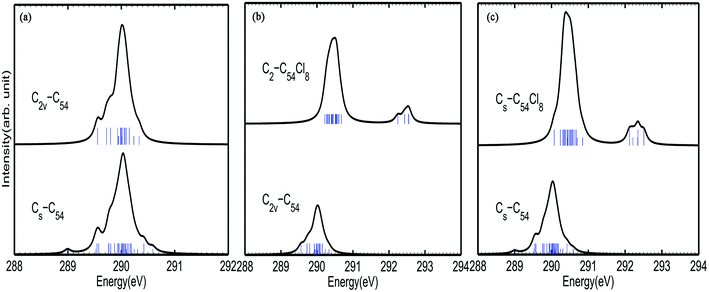
Fig. 2 shows the calculated C1s XPS spectra of different non-equivalent carbon atoms in each C54 isomer. As shown in Fig. 2(a), there is a strong peak at around 289.8–290.2 eV for both C2v-#540C54 and Cs-#369C54. Besides, there are three weak peaks at around 289.6 eV, 289.7–289.8 eV (ascribed to TSFP site C5) and 290.3 eV (ascribed to pyrene site C3) in the spectrum of C2v-#540C54. By contrast, Cs-#369C54 exhibits four similar peaks mentioned above and also has some different characteristics: two weak peaks appear at around 289.0 eV (ascribed to TDFP site C6) and 290.6 eV (ascribed to pyrene site C3). Through the analysis, we have drawn the conclusion that due to the existence of a group of TDFP site carbons, the environment of the carbon atoms changes, which then changes the IP value. Such a character can be used to identify the two different C54 isomers. According to previous studies, it is known that even in different fullerenes, the same type of C atom has similar IP values. For instance, the pyracylene and corannulene carbon sites in Cs-#369C54 and C2v-#540C54 show peaks at 289.8–290.2 eV, and the pyrene carbons have higher IP values at 290.2–290.4 eV. In a word, this indicates that the carbon atoms giving rise to the weak peak at lower energies belong to the pentagon–pentagon ring fusion, and the pyrene carbons give rise to the weak peak at higher energies; moreover, the strong peak is associated with the carbon atoms that belong to pyracylene and corannulene carbon sites.As shown in Fig. 2(b) and 3(c), the XPS spectra of both C2-#540C54Cl8 and Cs-#369C54Cl8 exhibit two groups of peaks: a strong peak at around 289.8–291.2 eV and weak peaks at around 292.2–292.6 eV. It is worth noting that the peak at higher energy is associated with the carbon atoms in the pentagon–pentagon ring fusions, which are connected to the chlorine atoms, whereas the rest of the atoms contribute to the stronger and broader peak. Besides, by comparing the spectra of pure cages and chlorides, it is not difficult to find that chlorination gives rise to a blue shift to a certain degree; especially in TDFP, TSFP and DFP sites directly connect to chlorine atoms. Since the carbon atoms bonded to chlorine atoms have the characteristics of an electron donor, the energy level position of the inner 1s orbital of the chlorinated carbon atoms is reduced, that is, the peaks of C2-#540C54Cl8 and Cs-#369C54Cl8 appear in the high-energy regions of the XPS spectra. This result coincides with previously reported results on halogenation of carbon compounds, which indicates that the binding energy of carbon 1s electrons can increase differently depending on the bond type of the carbon atoms.42,43 The calculated result again indicates the effective change in geometrical and electronic structures of the C54 backbone after chlorination.
Hence, XPS spectra can be regarded as an effective tool to identify isomers with different symmetries in principle.
3.3 NEXAFS
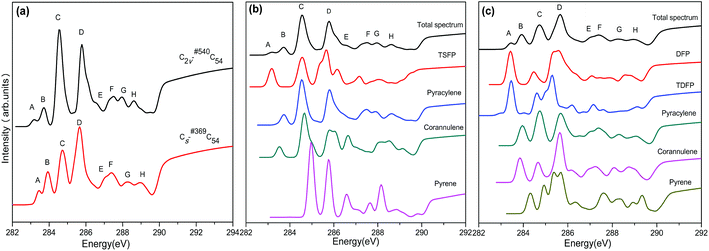
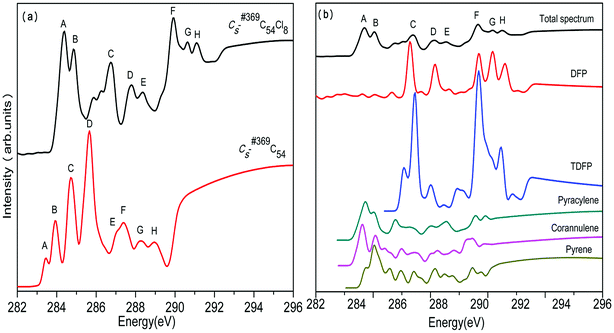
The calculated NEXAFS spectra of the two C54 isomers as well as the contributions from various types of carbons are displayed in Fig. 3. The total NEXAFS spectrum in this section is based on different relative abundances of different types of carbons. As shown in Fig. 3(a), both C2v-#540C54 and Cs-#369C54 exhibit eight major peaks, which are labeled as A–H (marked in the ascending order of energy). In Fig. 3(a), we can see that the NEXAFS spectra of the two isomers show a distinct difference by the peaks in the range between 283 and 287 eV. To be specific, compared to Cs-#369C54, which exhibits two distinct sharp peaks (marked as C and D), C2v-#540C54 shows a stronger peak C and a wider peak D, and it has a right shoulder peak labeled as E. Slight differences can also be observed in high-energy areas; especially, Cs-#369C54 exhibits a weak peak H around 289 eV, which is almost non-existent in C2v-#540C54.Fig. 3(b) and (c) show the contributions of different carbon types to C2v-#540C54 and Cs-#369C54, respectively. In Fig. 3(b), we can see that peak A arises from TSFP, which is peculiar to C2v-#540C54; this can be viewed as “fingerprints”. The pyracylene, corannulene and TSFP site carbons all make important contributions to peak B, and the pyrene site carbon leads to peak G. As for peaks C, D, E, F and H, they significantly originate from all types of carbons. In Fig. 3(c), we can see that peak A arises from TDFP and DFP, which are peculiar to Cs-#369C54; this can be regarded as “fingerprints”. Besides, pyracylene, corannulene and pyrene site carbons mainly contribute to peak B. The remaining peaks arise from all five types of carbons.
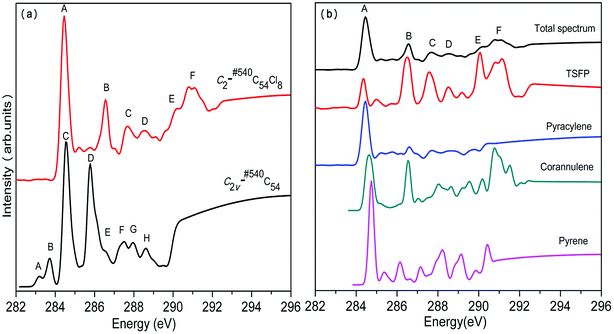
In the same way, we have calculated the total NEXAFS spectra of C2v-#540C54Cl8 and Cs-#369C54Cl8 as well as the contributions from the four types of carbons, as displayed in Fig. 4 and Fig. 5, respectively. From Fig. 4(a) and 5(a), we can observe that the NEXAFS spectra of chlorine derivatives have strong peaks in both high-energy region (290–292 eV) and low-energy region (284–287 eV). Clearly, the peaks in the high-energy region do not exist in the parent cages. Therefore, peaks E and F for C2v-#540C54Cl8 as well as peaks F, G and H for Cs-#369C54Cl8 can be regarded as “fingerprints” to identify the two chlorine derivatives with different symmetries. Furthermore, as shown in Fig. 4(b), TSFP and corannulene carbon sites contribute to “fingerprints”; TDFP and DFP carbon sites contribute to “fingerprints”, as shown in Fig. 5(b). All these carbon sites (TSFP, TDFP and DFP) are novel types of carbon atoms present in the newly captured C54 chlorides. By a careful consideration of Fig. 3, 4 and 5, we can find that all types of C atoms show varying degrees of blueshifts after chlorination. Specifically, distinct blue shifts of about 2 eV and 3 eV have been observed in TSFP, TDFP and DFP carbon sites. In addition, the other carbon atoms show a small blue shift of about 0.2 eV. Furthermore, the peaks of TSFP, TDFP and DFP carbon sites are stronger after chlorination. In a word, all these differences clarify that chlorination effectively changes the electronic structure of the main chain of C54.
In conclusion, we observed clear differences between the two C54 isomers and their corresponding chlorine derivatives from NEXAFS spectra due to the difference between the isomers as well as the effects of chlorination on the geometry and the electronic structure of fullerene. Thus, peaks E and F for C2v-#540C54Cl8 as well as peaks F, G and H for Cs-#369C54Cl8 could reasonably be viewed as “fingerprints” to identify the two isomers. Then, simulation results confirmed that the NEXAFS spectrum could provide effective identification information for non-IPR fullerenes.
3.4 UV-Vis absorption spectrum
In addition to the NEXAFS and XPS spectra mentioned above for the different isomers of C54 fullerene and the corresponding chlorides, we have also simulated the UV-Vis absorption spectrum of C2v-#540C54Cl8 on the TD-DFT level. Considering the effect of the proportion of the Hartree–Fock (HF) exchange on results, we have managed to simulate the spectrum by using functionals with different HF%. In conclusion, we found that the generated spectrum using the functional with B3LYP (20% HF), shown in Fig. 6, is consistent with the experimental result. The vertical coordinates of the UV-Vis absorption spectrum obtained by simulation are convolved by a Gaussian function with FWHM = 3000 cm−1. As displayed in Fig. 6, the absorption spectrum has five different feature peaks, of which four absorption peaks have larger convolutional intensities at about 288, 341, 465 nm and an exceedingly weak crest at about 504 nm.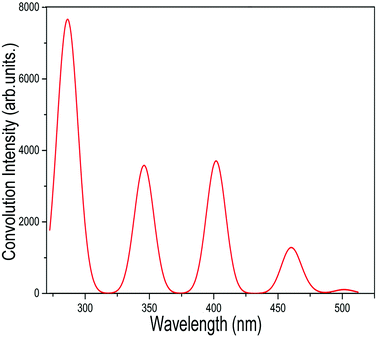 | ||
| Fig. 6 Calculated UV-Vis spectrum of C2-#540C54Cl8, which is generated by a Gaussian functional convolution with FWHM = 3000 cm−1. | ||
We have also listed the TD-DFT calculated adsorption wavelength, excitation energies, oscillator strengths (fosc) and the leading transition composition for further explanation. Table 2 lists the excitations with fosc > 0.001 as well as the contributions of more than 10% in the transition processes. In accordance with our calculations, each strong peak observed in the spectrum is not derived from one excitation energy only. For instance, the empirical strong peak at 288 nm stems from the cooperative contributions of the electronic excitations with the energies at 283.3, 285.5, 289 and 289.4 nm. The absorption peak at 341 nm mainly corresponds to the excitation HOMO → LUMO+5(72.6%), HOMO−5 → LUMO+2 (41.0%), HOMO−3 → LUMO+4 (29.2%) and HOMO → LUMO+5 (11.2%). Besides, compared with the other strong peaks, there is a weak peak at 504 nm. The other peaks of the absorption spectrum in Fig. 6 are detailed in Table 2. Previous studies have shown that the TD-DFT method slightly overestimates the excitation energy and produces a certain deviation; thus, it is reasonable to hold the view that the UV-Vis absorption spectrum obtained by our simulation is consistent with the experimental results. This method should be considered as a conducive means for characterizing the electronic structures of fullerenes and their derivatives. Simultaneously, it will be a significant application to provide rational and appropriate theoretical explanations for experimental phenomena. Other relevant details are shown in the ESI.†
| Exp. λa | State | Calc. λ | Calc. E | foscb | Leading transition configurationsc (%) |
|---|---|---|---|---|---|
| a Experimental values from ref. 6.b Only the excitations with fosc > 0.001 are listed.c Contributions of less than 10% are omitted. | |||||
| S66 | 283.3 | 4.376 | 0.01970 | H−5 → L+6(57.0), H−10 → L+1(12.7) | |
| S65 | 285.5 | 4.342 | 0.00719 | H−3 → L+8(55.0), H−2 → L+8(10.3), H−8 → L+2(10.2) | |
| S62 | 289 | 4.290 | 0.00588 | H−12 → L(48.3) | |
| S61 | 289.4 | 4.284 | 0.00595 | H−10 → L+1(54.0), H−9 → L+1(10.7) | |
| 288 | S64 | 289.4 | 4.284 | 0.00464 | H−13 → L(25.22), H−15 → L(24.9), H−12 → L+1(17.0) |
| 341 | S29 | 344.9 | 3.595 | 0.03093 | H → L+5(72.6) |
| S28 | 346.9 | 3.574 | 0.01065 | H−5 → L+2(41.0), H−3 → L+4(29.2), H → L+5(11.2) | |
| 406 | S13 | 401.7 | 3.087 | 0.09950 | H−4 → L(46.7), H → L+3(24.7) |
| 465 | S5 | 460.1 | 2.695 | 0.04826 | H−3 → L+1(34.4), H−2 → L+1(32.9), H−1 → L+1(25.6) |
| S4 | 470.3 | 2.637 | 0.00938 | H−2 → L(38.5), H−1 → L(36.8), H−3 → L(17.8) | |
| 504 | S1 | 501.2 | 2.474 | 0.00586 | H → L+1(94.7) |
4 Conclusion
We have calculated the electronic structures and the XPS and NEXAFS spectra of the two C54 isomers C2v-#540C54 and Cs-#369C54 as well as their corresponding chlorides C2-#540C54Cl8 and Cs-#369C54Cl8 at the DFT level. The UV-Vis absorption spectra of the chloride C2-#540C54Cl8 are also obtained by the TD-DFT method. Both XPS and NEXAFS spectra show that the chlorination process has a significant effect on the carbon cage, and they also demonstrate strong isomer dependence. In particular, the carbon atoms at the fusions of the pentagon–pentagon rings (DFP, TDFP and TSFP) show specific signals that are characteristic of C2v-#540C54 and Cs-#369C54 as well as C2-#540C54Cl8 and Cs-#369C54Cl8. In NEXAFS and XPS spectra, the C atoms at the fusions of pentagon–pentagon rings (DFP, TDFP and TSFP) contribute to the fingerprint peaks of non-IPR fullerenes and the corresponding chlorinated derivatives, which appear in the lower and higher energy regions, respectively. In other words, there is a large blue shift in the NEXAFS and XPS spectra after chlorination. In addition, the calculated UV-Vis absorption spectra are greatly consistent with previous experimental results. Therefore, the results indicate that X-ray and UV-Vis spectroscopy can afford useful methods for further experimental and theoretical studies of fullerene isomers and their derivatives.Conflicts of interest
There are no conflicts to declare.Acknowledgements
This work was supported by the National Natural Science Foundation of China (Grant No. 21503042), the Research Fund for the Doctoral Program of Higher Education of China (20123514120003), Natural Science Foundation of Fujian Province (2014J05015), Foundation of Educational Commission of Fujian Province (JA14036) and Fuzhou University (2012-XQ-12).References
- H. W. Kroto, J. R. Heath, S. C. O'Brien, R. F. Curl and R. E. Smalley, Nature, 1985, 318, 162–163 CrossRef.
- R. Ettl, I. Chao, F. Diederich and R. L. Whetten, Nature, 1991, 353, 149–153 CrossRef.
- F. Diederich, R. L. Whetten, C. Thilgen, R. Ettl, I. Chao and M. M. Alvarez, Science, 1991, 254, 1768–1770 CrossRef PubMed.
- H. Kroto, Nature, 1987, 329, 529–531 CrossRef.
- Y.-Z. Tan, S.-Y. Xie, R.-B. Huang and L.-S. Zheng, Nat. Chem., 2009, 1, 450–460 CrossRef PubMed.
- P. W. Fowler and D. E. Manolopoulos, An atlas of fullerenes, Oxford Univ. Press, Oxford, 1995 Search PubMed.
- Y. Z. Tan, J. Li, F. Zhu, X. Han, W. S. Jiang, R. B. Huang, Z. P. Zheng, Z. Z. Qian, R. T. Chen, Z. J. Liao, S. Y. Xie, X. Lu and L. S. Zheng, Nat. Chem., 2010, 2, 269–273 CrossRef PubMed.
- S.-Y. Xie, F. Gao, X. Lu, R.-B. Huang, C.-R. Wang, X. Zhang, M.-L. Liu, S.-L. Deng and L.-S. Zheng, Science, 2004, 304, 699 CrossRef PubMed.
- X. Gao and Y. Zhao, J. Comput. Chem., 2007, 28, 795–801 CrossRef PubMed.
- H. Zheng, J. Li and X. Zhao, Dalton Trans., 2012, 41, 14281–14287 RSC.
- M. Bühl, Chem. Phys. Lett., 1995, 242, 580–584 CrossRef.
- G. Mehta and P. S. Sarma, Tetrahedron Lett., 2002, 43, 6557–6560 CrossRef.
- Y. Yong, S. Lv, R. Zhang, Q. Zhou, X. Su, T. Li and H. Cui, RSC Adv., 2016, 6, 89080–89088 RSC.
- A. K. Srivastava, S. K. Pandey and N. Misra, J. Nanostruct. Chem., 2016, 6, 103–109 CrossRef.
- J. Stöhr, NEXAFS spectroscopy, Springer-Verlag, Berlin, 1992 Search PubMed.
- J. Qi, W. Hua and B. Gao, Chem. Phys. Lett., 2012, 539, 222–228 CrossRef.
- J. Qi, X. Hu, H. Zhu and M. Zheng, Phys. Chem. Chem. Phys., 2016, 18, 8049–8058 RSC.
- J. Qi, H. Zhu, M. Zheng and X. Hu, RSC Adv., 2016, 6, 96752–96761 RSC.
- N. Chen, C. M. Beavers, M. Mulet-Gas, A. Rodríguez-Fortea, E. J. Munoz, Y.-Y. Li, M. M. Olmstead, A. L. Balch, J. M. Poblet and L. Echegoyen, J. Am. Chem. Soc., 2012, 134, 7851–7860 CrossRef PubMed.
- B. Brena and Y. Luo, J. Chem. Phys., 2003, 119, 7139–7144 CrossRef.
- C. Lee, W. Yang and R. G. Parr, Phys. Rev. B: Condens. Matter Mater. Phys., 1988, 37, 785 CrossRef.
- A. D. Becke, J. Chem. Phys., 1993, 98, 5648–5652 CrossRef.
- M. J. Frisch, G. W. Trucks, H. B. Schlegel, G. E. Scuseria, M. A. Robb, J. R. Cheeseman, G. Scalmani,V. Barone, B. Mennucci, G. A. Petersson, H. Nakatsuji, M. Caricato, X. Li, H. P. Hratchian, A. F. Izmaylov, J. Bloino, G. Zheng, J. L. Sonnenberg, M. Hada, M. Ehara, K. Toyota, R. Fukuda, J. Hasegawa, M. Ishida, T. Nakajima, Y. Honda, O. Kitao, H. Nakai, T. Vreven, J. A. Montgomery Jr, J. E. Peralta, F. Ogliaro, M. J. Bearpark, J. Heyd, E. N. Brothers, K. N. Kudin, V. N. Staroverov, R. Kobayashi, J. Normand, K. Raghavachari, A. P. Rendell, J. C. Burant, S. S. Iyengar, J. Tomasi, M. Cossi, N. Rega, N. J. Millam, M. Klene, J. E. Knox, J. B. Cross, V. Bakken, C. Adamo, J. Jaramillo, R. Gomperts, R. E. Stratmann, O. Yazyev, A. J. Austin, R. Cammi, C. Pomelli, J. W. Ochterski, R. L. Martin, K. Morokuma, V. G. Zakrzewski, G. A. Voth, P. Salvador, J. J. Dannenberg, S. Dapprich, A. D. Daniels, Ö. Farkas, J. B. Foresman, J. V. Ortiz, J. Cioslowski and D. J. Fox, GAUSSIAN 09 (Revision D.01), Gaussian Inc., Wallingford, CT, 2009 Search PubMed.
- K. Hermann, L. Pettersson, M. Casida, C. Daul, A. Goursot, A. Koester, E. Proynov, A. St-Amant, D. Salahub and V. Carravetta, StoBe-deMon (Version 3.0) and Documentation for STOBE2007, StoBe Software, Stockholm, 2007 Search PubMed.
- A. D. Becke, Phys. Rev. A, 1988, 38, 3098 CrossRef.
- J. P. Perdew, Phys. Rev. B: Condens. Matter Mater. Phys., 1986, 33, 8822 CrossRef.
- W. Kutzelnigg, U. Fleischer and M. Schindler, NMR-basic principles and progress, Springer, Verlag, Heidelberg, 1990 Search PubMed.
- L. Triguero, O. Plashkevych, L. G. M. Pettersson and H. Ågren, J. Electron Spectrosc. Relat. Phenom., 1999, 104, 195–207 CrossRef.
- C. Kolczewski, R. Püttner, O. Plashkevych, H. Ågren, V. Staemmler, M. Martins, G. Snell, A. S. Schlachter, M. Sant'Anna, G. Kaindl and L. G. M. Pettersson, J. Chem. Phys., 2001, 115, 6426–6437 CrossRef.
- P. W. Langhoff, Electron-molecule and photon-molecule collisions, Springer, New York, 1979 Search PubMed.
- P. W. Langhoff, Theory and application of moment methods in many-fermion systems, Springer, New York, 1980 Search PubMed.
- A. Schäfer, H. Horn and R. Ahlrichs, J. Chem. Phys., 1992, 97, 2571–2577 CrossRef.
- F. Weigend and R. Ahlrichs, Phys. Chem. Chem. Phys., 2005, 7, 3297–3305 RSC.
- F. Neese, Wiley Interdiscip. Rev.: Comput. Mol. Sci., 2012, 2, 73–78 Search PubMed.
- R. J. Magyar and S. Tretiak, J. Chem. Theory Comput., 2007, 3, 976 CrossRef PubMed.
- A. Klamt and G. Schüürmann, J. Chem. Soc., Perkin Trans. 2, 1993, 799–805 RSC.
- S.-W. Tang, J.-D. Feng, Y.-Q. Qiu, H. Sun, F.-D. Wang, Z.-M. Su, Y.-F. Chang and R.-S. Wang, J. Comput. Chem., 2010, 32, 658–667 CrossRef PubMed.
- C. L. Gao, X. Li, Y. Z. Tan, X. Z. Wu, Q. Zhang, S. Y. Xie and R. B. Huang, Angew. Chem., Int. Ed., 2014, 53, 7853–7855 CrossRef PubMed.
- A. Bassan, M. Nyberg and Y. Luo, Phys. Rev. B: Condens. Matter Mater. Phys., 2002, 65, 165402 CrossRef.
- F. Diederich and R. L. Whetten, Acc. Chem. Res., 1992, 25, 119–126 CrossRef.
- T. Heine, G. Seifert, P. Fowler and F. Zerbetto, J. Phys. Chem. A, 1999, 103, 8738–8746 CrossRef.
- E. Papirer, R. Lacroix, J.-B. Donnet, G. Nanse and P. Fioux, Carbon, 1994, 32, 1341–1358 CrossRef.
- E. Papirer, R. Lacroix, J.-B. Donnet, G. Nansé and P. Fioux, Carbon, 1995, 33, 63–72 CrossRef.
Footnote |
| † Electronic supplementary information (ESI) available. See DOI: 10.1039/c8ra06514d |
| This journal is © The Royal Society of Chemistry 2018 |

