Phase separation and affinity between a fluorinated perylene diimide dye and an alkyl-substituted hexa-peri-hexabenzocoronene†
Giovanna
De Luca
ab,
Andrea
Liscio
a,
Manuela
Melucci
a,
Tobias
Schnitzler
c,
Wojciech
Pisula
c,
Christopher G.
Clark
Jr
c,
Luigi Monsù
Scolaro
b,
Vincenzo
Palermo
*a,
Klaus
Müllen
*c and
Paolo
Samorì
*ad
aIstituto per la Sintesi Organica e la Fotoreattività – Consiglio Nazionale delle Ricerche,
via Gobetti 101, 40129, Bologna, Italy. E-mail: palermo@isof.cnr.it
bDipartimento di Chimica Inorganica, Chimica Analitica e Chimica Fisica – Università di Messina, Salita Sperone 31, Vill. S. Agata, 98166, Messina, Italy
cMax Planck Institute for Polymer Research, Ackermannweg 10, 55128, Mainz, Germany. E-mail: muellen@mpip-mainz.mpg.de
dNanochemistry Laboratory, ISIS – CNRS 7006, Université de Strasbourg, 8 allée Gaspard Monge, 67000, Strasbourg, France. E-mail: samori@isis-ulp.org
First published on 24th September 2009
Abstract
Fluorination of alkyl groups is a known strategy for hindering miscibility, thus promoting phase separation, when blends are prepared with a hydrocarbon compound. A new perylene bis(dicarboximide) derivative functionalized with branched N-perfluoroalkyl moieties (BPF-PDI) has been synthesized as electron acceptor to be potentially used in conjunction with the electron donor hexakis(dodecyl)hexabenzocoronene (HBC-C12) in bulk heterojunction solar cells. Aiming at controlling self-assembly between the two components at the supramolecular level, stoichiometric blends in CHCl3 have been prepared either by spin- or drop-casting onto silicon surfaces, and further subjected to solvent vapour annealing (SVA) treatment in a CHCl3-saturated atmosphere. Spectroscopic investigation in solution shows the formation of supramolecular BPF-PDI–HBC-C12 dimers, with an association constant Kass = (2.1 ± 0.3) × 104 M−1, pointing to a strong and unexpected affinity between the two species within the mixture. Characterization through optical and atomic force microscopies of the deposited samples revealed that the self-assembly behaviour of the blends on SiOx is remarkably different from mono-component films, thus confirming the absence of a macroscopic phase-separation between the two components featuring isolated domains of the neat acceptor or donor compound. In addition, X-ray studies provided evidence for the existence of a local-scale phase separation. These findings are of importance for organic photovoltaics, since they offer a new strategy to control the phase separation at different scales in electron acceptor–donor blends.
Introduction
Achieving full control over the phase separation in bi-component films of electron-acceptor and electron-donor materials is crucial for the fabrication of organic photovoltaic devices.1–4 The ideal phase-separation for such applications should be on the local scale, and in particular on the nanometer scale, i.e. comparable to the mean exciton diffusion length. Several approaches have so far been employed to develop phase-segregated bi- or multi-component architectures with a nanoscale precision, including block copolymers,5,6 monomolecular dyads,7–14 as well as blends of dissimilar systems with15–18 or without fluoro-substitution on the side-chains.19Nanographenes,20,21 and in particular hexa-peri-hexabenzocoronenes,22–26 are building blocks exhibiting high charge carrier mobility, which is key for the fabrication of solar cells with high quantum efficiencies.27 On the other hand, perylenebis(dicarboximide)s (PDIs)28–34 are well-known n-type semiconductors of interest as active components for the fabrication of field-effect transistors (FETs)35–41 and solar cells.42–47 Fluorinated PDIs have been used in the last few years for application in FETs, as a strategy to hinder the planarity of the conjugated core as well as to change the stability of the device in the air.48–52 Above all, the fluorination of PDI makes them stronger electron acceptors.
Previous work on blending hexakis(dodecyl)hexabenzocoronene (HBC-C12)53,54 as a good electron donor, with PDI containing branched aliphatic side chains55,56 as a good electron acceptor, showed that while interaction between the aromatic cores tends to form ADADAD periodic columnar stacks, as observed by X-ray diffraction measurements,57 the side chains can either hinder or favour this stacking. Making use of different side chains and deposition conditions, it was possible to vary the extent of the phase separation from the molecular57 to the micron27 scale.
Herein we describe the characterization of a novel PDI derivative with branched fluorinated chains (BPF-PDI, Fig. 1a) and its self-assembly behaviour, either neat or as a blend with hexakis(dodecyl)hexabenzocoronene (HBC-C12, Fig. 1b). A thorough optical characterization in solution has been carried out by absorption spectroscopy to gain a deep understanding on the intimate interaction between BPF-PDI and HBC-C12, both in terms of stoichiometry of the potential supramolecular complex and of the association equilibrium constant. The formation of a complex, either a donor/acceptor dimer or a higher aggregate, is hence hypothesized in solution owing to supramolecular interactions between the two aromatic species, which are electronically complementary.58 An atomic force microscopy59 investigation of the blend deposited on surfaces has shown that this interaction leads to different morphologies as compared to the parent neat compounds. This provided evidence for the absence of a macroscopic phase separation between the two components. X-ray studies on thin films or bulk samples pointed out the occurrence of a phase separation on the local scale.
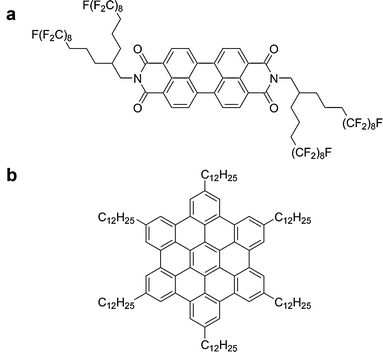 | ||
| Fig. 1 Chemical formulae of (a) BPF-PDI and (b) HBC-C12. | ||
Differently from other studies, where the fluorine end-groups were attached directly to the bay area of PDI to lower the HOMO and LUMO energy levels,52 our molecule is intentionally fluorinated only on the side chains, to very affect only slightly the molecular energy levels. In particular, we used long, double-armed side chains, which give some solubility to the molecule even if partially fluorinated. In this way, the different behaviour observed can be ascribed to the self-assembly properties of the molecule, and not to the electronic properties of its aromatic core.
Experimental
Synthesis of PDI with branched perfluorinated sidechains
The monoacid 1 was prepared starting from substitution of a malonic ester with two fluorinated alkyl chains, followed by saponification of the esters and decarboxylation of the resulting diacid 2 (Scheme 1).60,61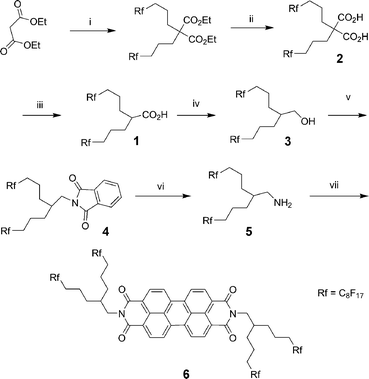 | ||
| Scheme 1 Reagents and conditions: (i) NaH, Rf(CH2)3I, DMF, 80 °C, 16 h, 95%; (ii) KOH, EtOH, 90 °C, 16 h, 70%; (iii) 180 °C, 30 min, 87%; (iv) BH3·THF, THF, reflux, 16 h, 95%; (v) phthalimide, diethylazodicarboxylate, THF, rt, 72 h, 82%; (vi) N2H4·H2O, EtOH–THF (5:1), reflux, 16 h, 90%; (vii) AcOH, N-methyl-2-pyrrolidone, 160 °C, 16 h, 63%. | ||
The alcohol 3 was obtained in high yield by reduction of the monoacid 1 in anhydrous THF with the BH3·THF complex as reducing agent. This alcohol was reacted with phthalimide under Mitsunobu conditions to form the phthalimide derivative 4. After treatment of compound 4 with hydrazine hydrate in a boiling ethanol–THF (5:1), the fluorinated branched amine 5 was received in 90% yield.
The doubly perfluoroalkyl-swallow-tailed perylene diimide 6 was achieved by condensing amine 5 with 3,4:9,10-perylenetetracarboxylic dianhydride in NMP with acetic acid to give the crude product 6, which was purified by washing with THF and subsequent recrystallisation from chloroform.
Additional details on synthetic procedures and spectroscopic characterization can be found in the ESI†.
Self-assembly and characterization
All chemicals and solvents were purchased from Sigma-Aldrich and used as received. All solvents were HPLC grade, whereas hydrogen peroxide (30% w/w) and ammonium hydroxide (≥25% w/w) solutions were semiconductor grade.N,N′-Bis(1-heptyloctyl)-3,4:9,10-perylene-bis(dicarboximide)55 and hexakis(dodecyl)hexabenzocoronene53 (PDI7 and HBC-C12, respectively) were synthesized according to literature methods.
After cleaning of the Si/SiOxsamples (∼5 × 5 mm2) by a standard RCA procedure,62 20–40 µL drops of the solutions in CHCl3 (500 µM total dye concentrations) were either drop-cast or spun (2000 rpm, 60 s) on the substrates in the air. During drop-casting, solvent evaporation was slowed down by placing the sample under a watch glass, to favour self-assembly. Due to the low solubility of the fluorinated species in CHCl3, its solutions were heated prior to use until no aggregates were detectable by eye (40–50 °C). Solvent vapour annealing (SVA) post-treatments were carried out as described elsewhere.63–66 Optical microscopy (OM) images were recorded with a Nikon Eclipse 80i microscope equipped with CFI Plan Fluor Series objectives and a DS-2Mv digital camera.
Tapping-mode atomic force microscopy (AFM)67–69 was employed, recording both the height signal (output of the feedback signal) and the phase signal (phase lag of the tip oscillation with respect to the piezo oscillation). While the first type of image provides a topographical map of the surface, the latter is extremely sensitive to structural heterogeneities on the sample surface, being therefore ideal to identify different components in a hybrid film.70,71
Scanning Probe Image Processor (SPIP; image metrology ApS, Lyngby, Denmark) was used for AFM image processing. Scientist for Windows (version 2.1, Micromath Scientific Software, Saint Louis, Missouri USA) was employed for least-mean-square fitting procedures.
Solutions for UV/vis extinction spectra were prepared by means of Hamilton syringes, and measured on a Jasco model V-560 double-beam spectrophotometer using quartz cells of different path lengths (0.1–40 mm) depending on their concentration. Normalized extinction spectra were obtained by dividing measured absorbance values for the corresponding concentrations and optical path lengths.
Fluorescence (emission and excitation) spectra were recorded on a Jasco model FP-750 spectrofluorimeter equipped with a Hamamatsu R928 photomultiplier, and were not corrected for absorption of the samples. In the case of highly absorbing samples a front-face geometry was adopted. A UV filter (Hoya glass type UV-34, cut-off: 340 nm) was used in order to cut off the UV component of the instrument’s light sources, avoiding the formation of HCl by photodecomposition of CHCl3.72
The thin films for structural investigation were prepared as described above. The fibres were prepared by filament extrusion using a home-built mini-extruder. If necessary, the material was heated up to a phase at which it became plastically deformable, and was extruded as 0.7 mm thin fiber by a constant-rate motion of the piston along the cylinder.
The 2D-WAXS experiments were performed by means of a rotating anode (Rigaku 18 kW) X-ray beam with pinhole collimation and a two-dimensional Siemens detector. A double graphite monochromator for CuKα radiation (λ = 0.154 nm) was used. A θ–θ Siemens D500 Kristalloflex with a graphite-monochromatized CuKα X-ray beam was used for the investigation of the structure in the thin film. The diffractogram was presented as a function of the scattering vector s with s = (2sinθ)/λ where 2θ is the scattering angle.
Results and discussion
Self-assembly in solution
The substitution of PDI with fluorinated swallow-tailed N-alkyl groups (Fig. 1a) causes low solubility of BPF-PDI in CHCl3; the associated aggregation phenomena were studied by Beer's law experiments in a concentration range between 6 × 10⁻⁷ M and 2 × 10⁻⁴ M. As shown in Fig. 2a, BPF-PDI displays a behaviour compatible with the presence of monomeric species for concentrations up to 70 µM. A linear fit of the data obeying Beer's law yields an extinction coefficient ε527 = (6.4 ± 0.1) × 104 M−1 cm−1, which is in good agreement with the values usually observed for this class of chromophores.73 A sudden drop in the absorbance at λmax and the simultaneous appearance of extended fibrillar aggregates precipitating from solution are observed for concentrations higher than 70 µM (red dots in Fig. 2a),74 accompanied by a slight broadening of the absorption bands (Fig. 2b). At first, the sudden absorbance reduction observed in the Beer experiment going from 70 to 122 µM (Fig. 2a) may suggest the existence of a critical aggregation concentration. However, one day after the samples were prepared (by dilution from a warm stock solution) and their spectra recorded (3 hours after sample preparation), aggregates can also be detected in the 70 µM BPF-PDI solution, pointing to slower aggregation kinetics on decreasing BPF-PDI concentration. Future effort in our laboratories will be addressed towards the exploration of the kinetics of the aggregation processes.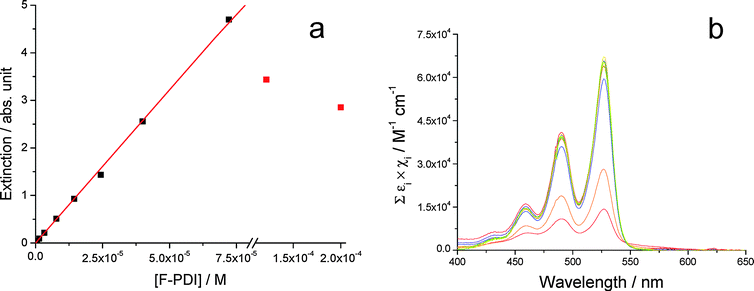 | ||
| Fig. 2 (a) Dots: extinction at 527 nm vs. concentration for BPF-PDI (6 × 10⁻⁷ M to 2 × 10⁻⁴ M). Experimental extinction values have been corrected for optical path lengths. Solid line: Beer's law. Fitting parameters: εF-PDI = (6.4 ± 0.1) × 104 M−1 cm−1 (λ = 527 nm); R2 = 0.9995. Red dots correspond to solutions presenting extensive aggregation phenomena in solution, and they have been excluded from the fitting. (b) Normalized extinction spectra of the solutions relative to (a), experimental data having been divided for optical path length and BPF-PDI concentration. | ||
Differently, HBC-C12 displays a more conventional aggregation behaviour in CHCl3 than the perylene derivative solutions, with a smoother deviation from Beer's law on increasing its concentration (Fig. 3a). The value of the extinction coefficient of this molecule in CHCl3 has been determined experimentally at 391 nm by considering only the spectra of the most diluted solutions (from 6 × 10⁻⁷ M to 8 × 10⁻⁵ M), and the linear fit yielded a value of (3.9 ± 0.1) × 104 M−1 cm−1. From this, the extinction coefficient in CHCl3 at λmax (361 nm) can be calculated as 1.15 × 10⁵ M−1 cm−1, which is almost one order of magnitude larger than the value reported by Kastler et al. for HBC-C12 solutions in 1:3 CHCl3–CH3OH (∼2 × 10⁴ M−1 cm−1).75
![(a) Dots: extinction at 391 nm vs. concentration for HBC-C12. The red line, reported to highlight the deviation of this system from Beer's law, has been obtained considering only the first seven points for the linear fit. [HBC-C12] = 6 × 10⁻⁷ M to 5 × 10⁻⁴ M. Experimental extinction values have been corrected for optical path lengths. Fitting parameters: εHBC-C12 = (3.9 ± 0.1) × 104 M−1 cm−1 (λ = 391 nm); R2 = 0.999. (b) Normalized extinction spectra of the solutions relative to (a), experimental data having been divided for optical path length and HBC-C12 concentration.](/image/article/2010/JM/b915484a/b915484a-f3.gif) | ||
| Fig. 3 (a) Dots: extinction at 391 nm vs. concentration for HBC-C12. The red line, reported to highlight the deviation of this system from Beer's law, has been obtained considering only the first seven points for the linear fit. [HBC-C12] = 6 × 10⁻⁷ M to 5 × 10⁻⁴ M. Experimental extinction values have been corrected for optical path lengths. Fitting parameters: εHBC-C12 = (3.9 ± 0.1) × 104 M−1 cm−1 (λ = 391 nm); R2 = 0.999. (b) Normalized extinction spectra of the solutions relative to (a), experimental data having been divided for optical path length and HBC-C12 concentration. | ||
As far as the acceptor–donor mixtures are concerned, an unexpected affinity between BPF-PDI and HBC-C12 species can be noticed at first glance. In fact, unlike the behaviour exhibited in CHCl3 by the two isolated molecules, their 1:1 mixtures do not exhibit any evident sign of aggregation, even when the concentration of each component reaches 1 mM. At the same time, evident colour changes occur as soon as the two species are mixed: immediately upon mixing CHCl3 solutions of BPF-PDI (whose bright orange colour is mainly due to fluorescence) and HBC-C12 (which is faintly yellow), an intense magenta solution is obtained (Fig. 4). This evidence points to the existence of a strong interaction between the two molecules in solution, which is not observed upon mixing HBC-C12 with PDIs bearing conventional alkyl chains. The propensity of BPF-PDI and HBC-C12 to associate was examined by a Job continuous variation experiment (Fig. 5).76 This was accomplished by varying BPF-PDI:HBC-C12 molar ratios while keeping the solution total molarity constant (50 µM). By plotting the function:77
| Yi = Absi,λ − ελ(BPF-PDI)[BPF-PDI]i − ελ(HBC-C12)[HBC-C12]i | (1) |
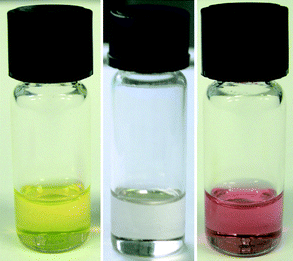 | ||
| Fig. 4 Left to right: BPF-PDI (50 µM), HBC-C12 (50 µM), and their 1:1 blend (50 µM each), in CHCl3 solutions. | ||
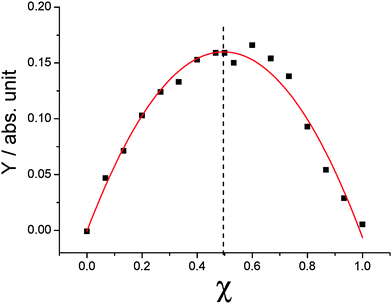 | ||
| Fig. 5 A Job continuous variation experiment: molar fraction of BPF-PDI is varied while keeping the total concentration of HBC-C12 and BPF-PDI constant at 5.0 × 10⁻⁵ M. Dots correspond to absorbance differences at 552 nm (Y, as defined in eqn (1)) vs. BPF-PDI molar fractions. The vertex of the parabola is found at 0.5, the value expected for a 1:1 ratio of donor and acceptor molecules in their supramolecular adduct (hetero-dimer). Model equation and fitting parameters: y = a + bx + cx2; a = 0 ± 0.007; b = 0.65 ± 0.03; c = −0.65 ± 0.3; R2 = 0.97. | ||
Moreover, systematic dilution experiments have been carried on concentrated solutions containing a 1:1 ratio between BPF-PDI and HBC-C12, enabling investigation of the equilibrium between the two isolated species and their hetero-dimer, according to the following:78
| HBC-C12 + BPF-PDI ⇌ HBC-C12·BPF-PDI | (2) |
This allowed the determination of the related association constant Kass. Fig. 6a shows the normalized UV/Vis spectral change observed upon dilution of a CHCl3 solution containing the two species at a concentration of 800 µM each. The extinction spectrum of this starting solution (Fig. 6b, red line) displays broad features both in the zone typical of HBC-C12 (275–425 nm) and in that related to BPF-PDI (425–600 nm). In this latter spectral range, the band centered around 543 nm disappears upon dilution from 800 µM to 1 µM (Fig. 6a). Moreover, sharp features typical of monomeric PDI derivatives arise from the starting less structured spectrum, with a slight blue-shift of their maxima and a marked increase of absorbance (Fig. 6b, blue line). In addition, in the spectral window where HBC-C12 presents its typical absorption profile, the broad features of the concentrated mixture undergo a small blue-shift, become markedly sharper, and increase in intensity. At the end, the profile of the most diluted samples can be satisfactorily described by the sum of the spectra of the isolated species (green line in Fig. 6b), in agreement with the dissociation of the dimer at high dilution.
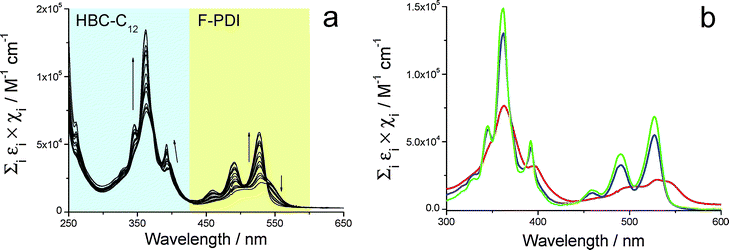 | ||
| Fig. 6 (a) UV/vis spectral change upon dilution of a HBC-C12–BPF-PDI blend (1:1 ratio), highlighting the dissociation equilibria exhibited by the hetero-dimer. Experimental data have been divided for optical path length and D/A total concentration, arrows marking the decrease in hetero-dimer concentration from 8.0 × 10⁻⁴ M to 10−6 M. (b) Normalized UV/vis spectra of most concentrated (red) and most diluted (blue) solutions, principally containing the hetero-dimer or isolated species, respectively. The sum of normalized UV/vis spectra of the two isolated species (green line) is reported for comparison. | ||
By analyzing the absorption variation at 527 nm (Fig. 7, dots) with the hetero-dimerization model described in eqn (2), the theoretical curve shown as a red line in Fig. 7 is obtained through a least-mean-square fitting process. This analysis yields a value for the dimer extinction coefficient at 527 nm of (1.2 ± 0.2) × 104 M−1 cm−1, while the equilibrium constant of dimer formation Kass is calculated to be (2.1 ± 0.3) × 104 M−1.
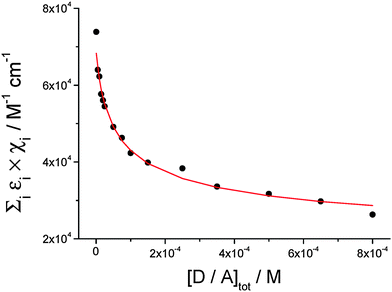 | ||
| Fig. 7 Dots: normalized extinction at 527 nm vs. hetero-dimer total concentration; solid line: theoretical curve corresponding to the hetero-dimer association equilibrium (see eqn (2)). Fitted parameters: Kass = (2.1 ± 0.3) × 104 M−1; ε = (1.2 ± 0.2) × 104 M−1 cm−1 (λ = 527 nm); R2 = 0.998. | ||
The fluorescence emission exhibited by diluted solutions (10 µM) of HBC-C12 in CHCl3 (Fig. 8a; black lines) is in good agreement with the emission properties already reported in the literature for this molecule,75 as is the emission of 10 µM solutions of BPF-PDI (Fig. 8a; red lines) with respect to previous data concerning other PDI derivatives.73 In neither case does the fluorescence profile depend on the excitation wavelength, pointing to the presence of only one emitting species in each solution. When the two molecules are mixed in a 1:1 ratio at a low concentration (10 µM total dye), and the sample is illuminated with light that both dyes can absorb (λ < 420 nm), the resulting emission features (Fig. 8a, blue lines) can be described as the sum of contributions from two non-interacting fluorophores: the bands centred around 470 and 491 nm are analogous to those of neat HBC-C12, whereas the peaks at 536, 576 and 623 are reminiscent of the emission of the perylene moiety. This conclusion is supported by the excitation spectra (Fig. 8b), in particular by that corresponding to the emission at 576 nm (Fig. 8b, blue dashed line). Its profile coincides with both fluorescence excitation and UV/vis absorption spectra of BPF-PDI (Fig. 8b, red dashed line, and Fig. 2b, respectively), and shows no contribution from HBC-C12 absorption, also indicating the absence of energy transfer between the two molecules under these conditions. In the concentrated equimolar mixture (800 µM total dye), where the equilibrium shifts from the two isolated dyes towards the supramolecular hetero-dimer, the emission profile is still very similar to that of the diluted mixture (Fig. 8a, green lines).79 This evidence remains even valid when exciting the concentrated mixture at 550 nm (Fig. 8a, inset), where the extinction coefficient of the dimeric species is larger than that of the neat chromophores. Moreover, the excitation spectra recorded for this solution (Fig. 8b, green lines) indicate that the various emission features are due to contributions from the non-interacting HBC-C12 and BPF-PDI monomers, the luminescence from the perylene moiety showing no contribution from the excitation of HBC-C12 molecules. All this evidence suggests that the HBC-C12–BPF-PDI complex is non-emitting and that the fluorescence exhibited by the concentrated mixture is due to the residual HBC-C12 and BPF-PDI monomers in equilibrium with the dimers, although a very weak emission of the complex cannot be entirely excluded as it might be hidden underneath the strong emission of the perylene monomers.
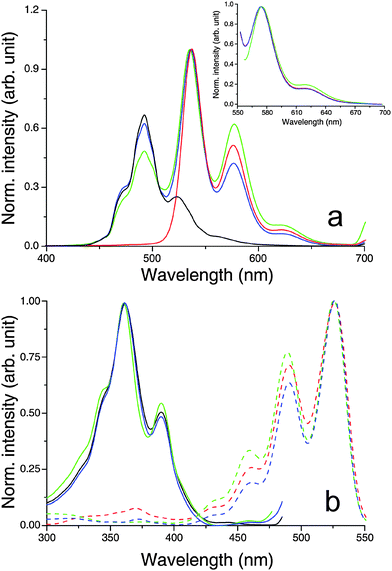 | ||
| Fig. 8 Normalized fluorescence (a) emission and (b) excitation spectra of CHCl3 solutions of the systems under study, showing that the emission profiles of both concentrated and diluted blends are due to contributions from the isolated chromophores in equilibrium with the quenched BPF-PDI–HBC-C12 dimer. Experimental conditions: (black) 10 µM HBC-C12; (red) 10 µM BPF-PDI; (green) mix of 400 µM BPF-PDI and 400 µM HBC-C12, front-face geometry; (blue) mix of 5 µM BPF-PDI and 5 µM HBC-C12. (a) Excitation wavelengths: 352 nm, 550 nm (main and inset, respectively). (b) Emission wavelengths: 491 nm, 576 nm (solid and dashed lines, respectively). | ||
If this high affinity between BPF-PDI and HBC-C12 is considered together with the increase of the total dye concentration as CHCl3 evaporates after casting the mixture on a silicon surface, the formation of a blend with no macroscopic phase separation can be foreseen. In the present case, these interactions are strong enough to cause the formation of a stable hetero-dimer between BPF-PDI and HBC-C12 already in solution, probably strengthened by additional contributions from the presence of the long, fluorinated side chains of the perylene derivative. This binary complex may behave as a new single building block, allowing easier processability for the blended material.
Deposition at surfaces of mono-component films of branched BPF-PDI or PDI7
Self-assembly of neat films for BPF-PDI on surfaces has been studied by depositing CHCl3 solutions of this molecule on Si/SiOx, either by spin-coating or drop-casting. We have performed a direct comparison of the behaviour of this system with previously investigated PDI derivatives, i.e. PDI2 (having 1-ethyl-propyl side chains) and PDI7 (having 1-heptyl-octyl side chains).63,64 For this purpose, rather concentrated CHCl3 solutions (500 µM) have been employed and, due to the low solubility of BPF-PDI in CHCl3, deposition experiments have been carried out after heating the starting solutions until no aggregates were detectable by eye.An AFM characterization of the BPF-PDI sample prepared by spin-coating is displayed in Fig. 9a; it shows a multilayered structure, each layer having a height of (2.1 ± 0.2) nm, similar to previous observation on PDIs exposing non-fluorinated side-chains (see Fig. S1†).64 A closer look revealed that these films have a grainy substructure, leading to a reduced surface flatness if compared to layers formed by PDI7 (Fig. S1), as proven by measuring the root-mean-square roughness (RRMS) on images with a scan length of 1 µm. Indeed, while BPF-PDI films had RRMS = 0.41 ± 0.04 nm, PDI7 films had RRMS = 0.18 ± 0.02 nm. This higher roughness for the BPF-PDI films can be attributed to two reasons. On the one hand, the longer fluorinated side-chains have a larger degree of freedom than the shorter alkyl groups of PDI7, possibly leading to a less ordered structure. On the other hand, the same fluorinated chains might cause the formation of globular or micellar aggregates representing a first level of organization, that might further assemble into the observed multilayer.80,81 These factors might also be the origin of the difference observed between BPF-PDI and PDI7 on comparing the heights of their multilayered structure.
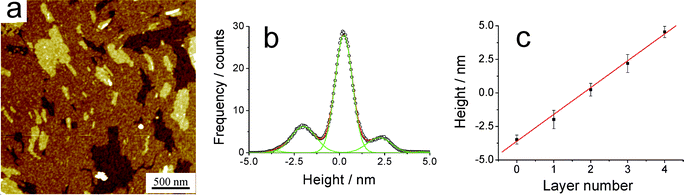 | ||
| Fig. 9 (a) AFM topography of a BPF-PDI sample spun on SiOx from a warm CHCl3 solution, showing the formation of a well-defined multilayered structure. The height histogram is shown in (b), while (c) highlights the uniform thickness of (2.1 ± 0.2) nm of each layer. (a) z-range: 9.2 nm. (d) R2 = 0.997. | ||
An improvement in the degree of order exhibited by these BPF-PDI deposits has been attempted through solvent vapour annealing (SVA) treatments by placing the spin-coated samples in a CHCl3-saturated atmosphere for three days at room temperature. In fact, spin-coating generally leads to the formation of kinetically trapped aggregates due to fast solvent evaporation, and the annealing of the samples in a solvent vapour atmosphere may enhance the mobility of the deposited molecules on the surface, directing the self-aggregation towards thermodynamically favoured structures.82 As a result of the SVA treatment, the molecules constituting the starting multilayered structures migrate on the SiOx surface to yield well-ordered objects having a high aspect ratio and very sharp edges (Fig. 10a,b), with lengths of 1–4 µm and widths of 100–250 nm, sometimes organized in bundles (indicated by a white arrow in Fig. 10a). By analyzing the height histogram (Fig. 10c,d) it becomes evident that the heights of these fibrillar objects are quite regular: a thickness value of (6.4 ± 0.5) nm is common to several self-assembled fibers, while taller ones show a uniform increase in thickness with steps of (2.1 ± 0.2) nm. This value matches that measured for the multi-layered structure prior to SVA, although in that case a smaller number of layers are formed, pointing to an overall increase in the degree of order upon annealing. Furthermore, the 3:1 ratio observed between the thickness of the first layer and that of the upper layers suggests that the first layer might be three molecules thick, while the upper layers are one molecule thick.
![(a) AFM topography of a BPF-PDI sample spun on SiOx from a warm CHCl3 solution ([BPF-PDI] = 500 µM), after solvent vapour annealing (SVA) in saturated CHCl3 atmosphere at room temperature for 3 days. Upon SVA, BPF-PDI forms fibers having lengths below 4 µm and widths of 100–250 nm. (b) Height profile taken across the long dimension of the fiber indicated by the white arrow in (a). The height histogram of the topographic image is shown in (c), while (d) highlights the uniform increase in the fibers' thickness by steps of (2.1 ± 0.1) nm. (a) z-range = 23.3 nm. (e) R2 = 0.999.](/image/article/2010/JM/b915484a/b915484a-f10.gif) | ||
| Fig. 10 (a) AFM topography of a BPF-PDI sample spun on SiOx from a warm CHCl3 solution ([BPF-PDI] = 500 µM), after solvent vapour annealing (SVA) in saturated CHCl3 atmosphere at room temperature for 3 days. Upon SVA, BPF-PDI forms fibers having lengths below 4 µm and widths of 100–250 nm. (b) Height profile taken across the long dimension of the fiber indicated by the white arrow in (a). The height histogram of the topographic image is shown in (c), while (d) highlights the uniform increase in the fibers' thickness by steps of (2.1 ± 0.1) nm. (a) z-range = 23.3 nm. (e) R2 = 0.999. | ||
BPF-PDI samples deposited on SiOx by drop-casting appear very different from the spun ones; also a result of the larger amount of material that is deposited on the surface using this method. When 40 µL of a warm BPF-PDI solution in CHCl3 (500 µM) are cast on the silicon surface, the formation of a very dense, entangled network of self-assembled fibers is observed (Fig. 11 and ESI†). The profound entanglement of the BPF-PDI self-assembled network is revealed by AFM imaging of the sample surface (Fig. 11), highlighting the presence of overlapping bundles of fibers completely covering the SiOx surface. In the case of drop-cast samples, SVA treatment does not cause any significant change in sample morphology.
![AFM (a) topography and (b) x-gradient images (respectively) of a BPF-PDI sample drop-cast on SiOx from a warm CHCl3 solution ([BPF-PDI] = 500 µM), consisting of a membrane-like, densely packed network of fibres. (a) z-range = 496 nm.](/image/article/2010/JM/b915484a/b915484a-f11.gif) | ||
| Fig. 11 AFM (a) topography and (b) x-gradient images (respectively) of a BPF-PDI sample drop-cast on SiOx from a warm CHCl3 solution ([BPF-PDI] = 500 µM), consisting of a membrane-like, densely packed network of fibres. (a) z-range = 496 nm. | ||
Deposition at surfaces of bi-component films
As mentioned above, blends of HBC-C12 and BPF-PDI were prepared to obtain a nanoscale phase separation between electron donor and acceptor components in a simple, single-step deposition process. When the warm equimolar mixture between BPF-PDI and HBC-C12 (500 µM total dye concentration) is deposited onto SiOx by spin-coating, the surface gets covered by a uniform double-layer network comprised of unstructured assemblies (Fig. 12), the topmost layer having a height ∼1.6 nm. The bottom layer exhibits 94% coverage, with small voids having an approximate area of 120 nm2, while the upper layer has a less dense network, with hollow sites of about 600 nm2 and a 30% surface coverage. This morphology is quite different from those exhibited either in the neat BFP-PDI or HBC-C12 spin-cast from CHCl3 on SiOx (see Fig. 9 and Fig. S2†).64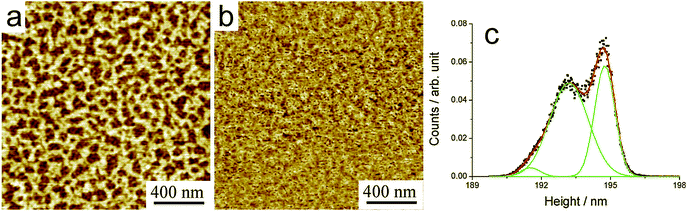 | ||
| Fig. 12 (a,b) AFM topography and phase images (respectively) of BPF-PDI–HBC-C12 blend spun on SiOx from a CHCl3 solution (500 µM total dye concentration), consisting in a uniform, porous network made of unstructured assemblies, the upper layer being ∼1.6 nm thick as per the height histogram in (c). (a) z-range = 5.9 nm. | ||
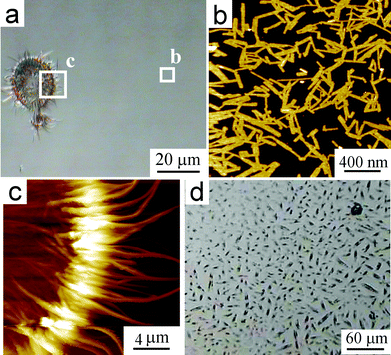
In order to establish if the observed lack of macroscopic phase separation is due to kinetic trapping, as a result of the spin-coating procedure employed, drop-casting was also used to deposit the blend onto SiOx, making it possible to exploit the slower solvent evaporation, and aiming at operating in a more thermodynamically controlled regime that might lead to a detectable phase separation. When the blend solution (500 µM total dye concentration) is drop-cast onto SiOx and evaporation is slowly carried out, optical and AFM microscopies reveal that most of the material self-organizes into objects with high aspect ratio, with lengths between 10–80 µm, widths around 2–5 µm and maximum height of ca. 100 nm (Fig. 13a,c,d). They have well defined growth directions without bending along their length, sharp edges and very regular surface organization. The silicon surface surrounding these objects is covered by a bilayer comprised of unstructured assemblies, the topmost level being ∼3 nm thick (Fig. 13b). The morphology of these samples is markedly different from that observed for drop-cast samples of the neat mono-component films (Fig. 11 and Fig. S3†, respectively), and gives no indication of phase separation at the hundreds of nanometers scale.
 | ||
| Fig. 13 (a) OM and (b–d) AFM images of BPF-PDI–HBC-C12 blend drop-cast on SiOx from a CHCl3 solution (500 µM total dye concentration), consisting of needle-like microcrystals surrounded by a thin bilayer of unstructured nano-aggregates, the topmost layer being ∼3 nm thick. (b) Zoom-in on the bilayer; topography and phase (respectively), z-range = 7.8 nm. (c,d) Zoom-in on a microcrystal; topography and x-gradient (respectively), z-range = 47.0 nm. | ||
The spin-coating and drop-cast samples of the BFP-PDI–HBC-C12 blend were also subjected to SVA in CHCl3 atmosphere for three days at room temperature, to evaluate the possibility of promoting phase separation within the films. On the one hand, after SVA on the spun samples, AFM (Fig. 14) shows a surface mostly covered by flat, high aspect ratio objects of (150 ± 70) nm in length, (35 ± 15) nm width, and around 4 nm in height (Fig. 14b), whereas in proximity of a defect, such a scratch or solvent droplet, the morphology evolves toward larger (∼20 µm long) fibrous structures (Fig. 14c). On the other hand, the drop-cast samples (Fig. 14d) revealed minimal changes, with bundles of micron-sized fibers. In addition, residuals of the bilayer structure are found on the silicon surface as nano-sized needles surrounded by less structured material (not shown).
 | ||
| Fig. 14 (a) OM and (b,c) AFM topographic images (the boxes are indicated) of BPF-PDI–HBC-C12 blend spun on SiOx from a CHCl3 solution (500 µM total dye concentration), after SVA in saturated CHCl3 atmosphere at room temperature for 3 days. (b) Upon SVA, the initial porous network changes into flat, high aspect ratio objects having (150 ± 70) nm length, (35 ± 15) nm width, and ∼4 nm height. (c) Fibrous structures of 20 µm approximate length, which form in the presence of a defect (here a solvent droplet) on the surface. (d) OM of the aforementioned blend drop-cast on SiOx, after SVA in saturated CHCl3 atmosphere at room temperature for 3 days. z-ranges: (b) 7.8 nm; (c) 970 nm. | ||
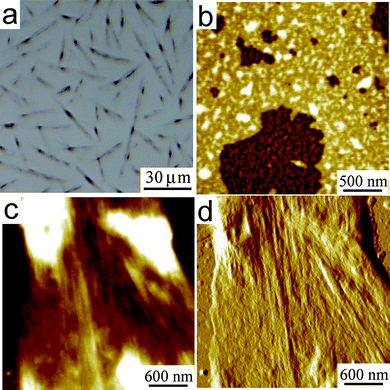
Ultimately, although a change in the morphology of the deposited blend has occurred in both cases, the interaction between donor and acceptor molecules appears to be strong enough to lead to only one kind of morphology on the silicon surface, with no evidence of phase separation at a microscopic scale, differently from other acceptor/donor blends.27,83–85 For the sake of comparison, Fig. 15a shows the blend of a conventional alkyl-substituted PDI co-deposited with HBC-C12: upon SVA, the two materials tend to phase-separate, forming different structures, unlike the HBC-C12–BPF-PDI blends (Fig. 15b).
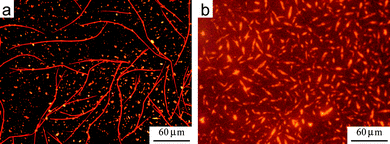 | ||
| Fig. 15 (a) Fluorescence microscopy of a blend of HBC-C12 and non-fluorinated PDI2 after SVA in THF. Phase separation of the two molecules leads to the growth of two structures, long red fibers formed by PDI and shorter yellow crystals (due to HBC-C12). See refs. 63 and 64 for more details. (b) Fluorescence microscopy of a blend of HBC-C12 and BPF-PDI after SVA in CHCl3. CHCl3 was used instead of THF due to better solubility of BPF-PDI in this solvent. No phase separation is observed. The reddish background is due to the high sensitivity needed to collect the much lower fluorescence from the blend. | ||
To better understand the organization in the equimolar BPF-PDI–HBC-C12 mixture, in particular to gain information about their tendency to phase-separate on a local scale, X-ray diffraction analysis of the thin films was performed (Fig. 16). The diffractogram of a freshly drop-cast film of the mixture (black line) mainly reveals reflections related to the donor material (green line), due to the pronounced order of neat HBC-C12, and no scattering intensities from the perylene derivative (blue line), the layer of pure BPF-PDI showing only poor intensity peaks. Given that for a homogenous mixture new scattering intensities would be expected,86 our results strongly suggest the occurrence of a phase separation between the donor and acceptor components. To gain further information on the molecular packing in the mixture, fiber wide-angle X-ray scattering experiments have been performed on bulk samples prepared in the same way from the solution as for the thin films. The typical 2D pattern in Fig. 17a indicates crystalline order of pure HBC-C12 with tilted molecules in columnar structures,87 whereas crystalline BPF-PDI is arranged in columnar stacks, but in a staggered fashion (Fig. 17b).88 The sample prepared by casting the blend on SiOx from solution shows only a few scattering intensities in the pattern, and the peaks in the diffractograms display a low intensity (Fig. 17c), indicating that the two molecules are influencing each other’s ordering but not completely eliminating phase separation. This conclusion is further verified by the comparison of the equatorial reflections, which are related to intercolumnar arrangement, between the starting materials and the drop-cast blend (Fig. S4†).
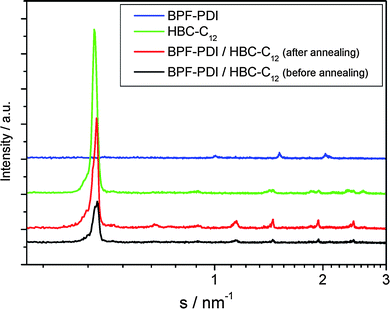 | ||
| Fig. 16 X-ray diffraction of thin films drop-cast from CHCl3: (blue) BPF-PDI; (green) HBC-C12; (black) equimolar BPF-PDI–HBC-C12 blend. The diffractograms were recorded 30 °C. | ||
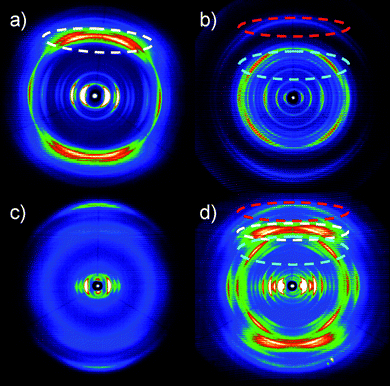 | ||
| Fig. 17 2D WAXS patterns of a) HBC-C12, b) BPF-PDI, and BPF-PDI–HBC-C12 c) before and d) after annealing at 135 °C. All patterns were recorded at 30 °C. Dashed circles indicate characteristic reflections of the pure compounds related to intracolumnar packing of the molecules. | ||
An improvement of the molecular packing in the individual domains was obtained by annealing the samples at 135 °C, as shown by (i) the increase in intensity of the reflections of the annealed thin films while their positions remained unchanged (Fig. 16, red line), and (ii) the presence of reflections only due to the pure compounds after annealing the fibres of the mixture (Fig. 17d). This confirms a distinct phase separation between BPF-PDI and HBC-C12, with a considerable improvement in the local order upon thermal treatment.
The occurrence of a phase separation at the local scale might be due to the dissimilar solubilities of the two starting species which, during the evaporation of the solvent, precipitate at different critical concentrations, leading to the phase-separated blend. Nonetheless, the surface morphologies of both donor and acceptor in the blends drop-cast on SiOx are indeed markedly different from the neat films, confirming the key role played by the intermolecular interactions between the two dissimilar molecular systems when deposited at the surface. It is worth noting that HBC-C12 has shown a similar behaviour when mixed with other alkyl-substituted PDI derivatives;89 moreover, Wang et al.86 recently reported phase separation for truxene derivatives depending on the molar ratio between donor and acceptor, while the morphology remained identical for all samples. In the present case, a deeper understanding of the actual organization of the BPF-PDI–HBC-C12 blend has been obtained by combining the complementary information concerning morphology and structure given by AFM and X-ray studies.
The origin of the strong interaction between BPF-PDI and HBC-C12 detected in solution still remains to be fully understood. The supramolecular interactions involving fluorinated organic compounds has been studied in various papers, where the formation of C–H⋯F hydrogen bonds (in analogy with O–H⋯F bonds) has been hypothesised.90–93 In our case, although different kinds of interactions between the various parts of the two molecules have to be considered (like stacking of the aromatic cores,94 Calkyl–H⋯F,95 Carom–H⋯F,96 C–H⋯O![[double bond, length as m-dash]](https://www.rsc.org/images/entities/char_e001.gif) C,97), some assumptions can be made on the relative strength of the different contributions. In fact, the unusual interaction between BPF-PDI and HBC-C12, and the lack of phase separation both in solution and solid, cannot be due to simple stacking of the aromatic moieties, which is present even in non-fluorinated PAH blends.27 Hence, the strong binding between the donor and acceptor molecules under study should be due to the presence of the long, fluorinated chains on the perylene derivative, and their interaction with the HBC-C12 molecule. In particular, given that the side-chains have a greater ability to arrange and interact in view of their conformational flexibility and peripheral position, the strong interaction observed between the two species should mainly involve the (CF2)n moieties of the PDI and the (CH2)n chains of the HBC. From XRD studies present in the literature on fluorinated compounds, a typical C–H⋯F bond length is 2.7–2.9 Å, which added to the C–F and C–H bond lengths (∼1.4 Å and ∼1.1 Å, respectively)98 gives a possible interaction distance between the two flexible chains that is quite large (5.2–5.4 Å). This interaction distance is much larger than a typical π-stacking between aromatic cores (3.34 Å).94 These proposed F⋯H interactions might coexist with stacking of the aromatic fragments, and even with direct C–F⋯π interactions, which have been previously observed in organic crystals.96 Even if it is much weaker than a “classical” hydrogen bond,99 the C–H⋯F–C interaction is strong enough to change significantly the crystal packing of various molecules and increase their melting point.95,97 Here, the large number of C–F and C–H bonds (68 and 150 respectively) present in the side chains of BPF-PDI and HBC-C12, together with the ease of these chains to interact due to their flexibility, might favour the formation of a high number of C–H⋯F–C contacts. These could operate in a cooperative way, and in synergy with the stacking of the aromatic cores, to give the very strong intermolecular interaction observed between these two molecules in the blends. It must be noted that simple linear alkanes and perfluoroalkanes, when mixed together, tend to phase-separate, mainly due to the weak intermolecular forces acting on the perfluoroalkanes. Such a phase separation is hindered in our case since the alkyl and perfluoroalkyl moieties are forced to interact with each other, being covalently attached to poly-aromatic cores which tend to form stacks.
C,97), some assumptions can be made on the relative strength of the different contributions. In fact, the unusual interaction between BPF-PDI and HBC-C12, and the lack of phase separation both in solution and solid, cannot be due to simple stacking of the aromatic moieties, which is present even in non-fluorinated PAH blends.27 Hence, the strong binding between the donor and acceptor molecules under study should be due to the presence of the long, fluorinated chains on the perylene derivative, and their interaction with the HBC-C12 molecule. In particular, given that the side-chains have a greater ability to arrange and interact in view of their conformational flexibility and peripheral position, the strong interaction observed between the two species should mainly involve the (CF2)n moieties of the PDI and the (CH2)n chains of the HBC. From XRD studies present in the literature on fluorinated compounds, a typical C–H⋯F bond length is 2.7–2.9 Å, which added to the C–F and C–H bond lengths (∼1.4 Å and ∼1.1 Å, respectively)98 gives a possible interaction distance between the two flexible chains that is quite large (5.2–5.4 Å). This interaction distance is much larger than a typical π-stacking between aromatic cores (3.34 Å).94 These proposed F⋯H interactions might coexist with stacking of the aromatic fragments, and even with direct C–F⋯π interactions, which have been previously observed in organic crystals.96 Even if it is much weaker than a “classical” hydrogen bond,99 the C–H⋯F–C interaction is strong enough to change significantly the crystal packing of various molecules and increase their melting point.95,97 Here, the large number of C–F and C–H bonds (68 and 150 respectively) present in the side chains of BPF-PDI and HBC-C12, together with the ease of these chains to interact due to their flexibility, might favour the formation of a high number of C–H⋯F–C contacts. These could operate in a cooperative way, and in synergy with the stacking of the aromatic cores, to give the very strong intermolecular interaction observed between these two molecules in the blends. It must be noted that simple linear alkanes and perfluoroalkanes, when mixed together, tend to phase-separate, mainly due to the weak intermolecular forces acting on the perfluoroalkanes. Such a phase separation is hindered in our case since the alkyl and perfluoroalkyl moieties are forced to interact with each other, being covalently attached to poly-aromatic cores which tend to form stacks.
Conclusions
A new perylene molecule BPF-PDI, functionalized with branched, highly fluorinated alkyl side chains, has been studied both in solution and on the surface. This molecule exhibits a strong tendency to self-assemble in organic solvents; when deposited on surfaces it forms either multi-layers or nano-needles, according to processing conditions. In particular, this electron-accepting molecule shows a strong tendency to interact with electron-donating alkyl-substituted hexa-peri-hexabenzocoronene molecules. Spectroscopic studies in solution show that BPF-PDI and HBC-C12 form supramolecular complexes with a 1:1 stoichiometry and featuring a relatively high association constant of Kass = (2.1 ± 0.3) × 104 M−1. When deposited on a surface, these bi-component systems self-assemble in anisotropic structures, with no evidence of a macroscopic phase separation, even after solvent vapour annealing treatments. On the other hand, X-ray studies provided unambiguous evidence for a local-scale phase separation between the two components. Such a phase separation may be of future interest for applications in the fabrication of amphiphilic materials and solar cells, where macroscopic phase separation of the different molecules composing the active material is often an issue, reducing interface area and exciton conversion efficiency.Acknowledgements
This work was supported by the EC FP7 ONE-P large-scale project no. 212311, the French National Agency (ANR), the German Research Foundation (Special program Organic Photovoltaics) and the EC through the NanoSciEra-SENSORS project, the ESF-SONS2-SUPRAMATES project, the Regione Emilia-Romagna PRIITT PROMINER Net-Lab, and the International Center for Frontier Research in Chemistry (FRC, Strasbourg).References and notes
- J. J. M. Halls, C. A. Walsh, N. C. Greenham, E. A. Marseglia, R. H. Friend, S. C. Moratti and A. B. Holmes, Nature, 1995, 376, 498–500 CrossRef CAS.
- G. Yu, J. Gao, J. C. Hummelen, F. Wudl and A. J. Heeger, Science, 1995, 270, 1789–1791 CrossRef CAS.
- C. J. Brabec, N. S. Sariciftci and J. C. Hummelen, Adv. Funct. Mater., 2001, 11, 15–26 CrossRef CAS.
- U. Scherf, A. Gutacker and N. Koenen, Acc. Chem. Res., 2008, 41, 1086–1097 CrossRef CAS.
- M. W. Matsen and F. S. Bates, Macromolecules, 1996, 29, 1091–1098 CrossRef CAS.
- S. B. Darling, Prog. Polym. Sci., 2007, 32, 1152–1204 CrossRef CAS.
- H. Imahori, K. Hagiwara, M. Aoki, T. Akiyama, S. Taniguchi, T. Okada, M. Shirakawa and Y. Sakata, J. Am. Chem. Soc., 1996, 118, 11771–11782 CrossRef CAS.
- E. Peeters, P. A. van Hal, J. Knol, C. J. Brabec, N. S. Sariciftci, J. C. Hummelen and R. A. J. Janssen, J. Phys. Chem. B, 2000, 104, 10174–10190 CrossRef CAS.
- P. Samorì, A. Fechtenkötter, E. Reuther, M. D. Watson, N. Severin, K. Müllen and J. P. Rabe, Adv. Mater., 2006, 18, 1317–1321 CrossRef CAS.
- N. Tchebotareva, X. M. Yin, M. D. Watson, P. Samorì, J. P. Rabe and K. Müllen, J. Am. Chem. Soc., 2003, 125, 9734–9739 CrossRef CAS.
- P. Samorì, X. M. Yin, N. Tchebotareva, Z. H. Wang, T. Pakula, F. Jackel, M. D. Watson, A. Venturini, K. Müllen and J. P. Rabe, J. Am. Chem. Soc., 2004, 126, 3567–3575 CrossRef CAS.
- J. F. Eckert, J. F. Nicoud, J. F. Nierengarten, S. G. Liu, L. Echegoyen, F. Barigelletti, N. Armaroli, L. Ouali, V. Krasnikov and G. Hadziioannou, J. Am. Chem. Soc., 2000, 122, 7467–7479 CrossRef CAS.
- F. Langa, M. J. Gomez-Escalonilla, J. M. Rueff, T. M. F. Duarte, J. F. Nierengarten, V. Palermo, P. Samorì, Y. Rio, G. Accorsi and N. Armaroli, Chem.–Eur. J., 2005, 11, 4405–4415 CrossRef CAS.
- J. M. Mativetsky, M. Kastler, R. C. Savage, D. Gentilini, M. Palma, W. Pisula, K. Müllen and P. Samorì, Adv. Funct. Mater., 2009, 19, 2486–2494 CrossRef CAS.
- U. Dahn, C. Erdelen, H. Ringsdorf, R. Festag, J. H. Wendorff, P. A. Heiney and N. C. Maliszewskyj, Liq. Cryst., 1995, 19, 759–764 CrossRef CAS.
- C. Tschierske, J. Mater. Chem., 1998, 8, 1485–1508 RSC.
- P. H. J. Kouwer, S. J. Picken and G. H. Mehl, J. Mater. Chem., 2007, 17, 4196–4203 RSC.
- S. Sergeyev, W. Pisula and Y. H. Geerts, Chem. Soc. Rev., 2007, 36, 1902–1929 RSC.
- M. M. S. Abdel-Mottaleb, S. De Feyter, M. Sieffert, M. Klapper, K. Müllen and F. C. De Schryver, Langmuir, 2003, 19, 8256–8261 CrossRef CAS.
- M. D. Watson, A. Fechtenkötter and K. Müllen, Chem. Rev., 2001, 101, 1267–1300 CrossRef CAS.
- A. C. Grimsdale and K. Müllen, Angew. Chem., Int. Ed., 2005, 44, 5592–5629 CrossRef CAS.
- J. S. Wu, W. Pisula and K. Müllen, Chem. Rev., 2007, 107, 718–747 CrossRef CAS.
- P. Samorì, N. Severin, C. D. Simpson, K. Müllen and J. P. Rabe, J. Am. Chem. Soc., 2002, 124, 9454–9457 CrossRef CAS.
- J. P. Hill, W. S. Jin, A. Kosaka, T. Fukushima, H. Ichihara, T. Shimomura, K. Ito, T. Hashizume, N. Ishii and T. Aida, Science, 2004, 304, 1481–1483 CrossRef CAS.
- Y. Yamamoto, T. Fukushima, Y. Suna, N. Ishii, A. Saeki, S. Seki, S. Tagawa, M. Taniguchi, T. Kawai and T. Aida, Science, 2006, 314, 1761–1764 CrossRef CAS.
- H. J. Räder, A. Rouhanipour, A. M. Talarico, V. Palermo, P. Samorì and K. Müllen, Nat. Mater., 2006, 5, 276–280 CrossRef.
- L. Schmidt-Mende, A. Fechtenkötter, K. Müllen, E. Moons, R. H. Friend and J. D. MacKenzie, Science, 2001, 293, 1119–1122 CrossRef CAS.
- F. Würthner, Chem. Commun., 2004, 1564–1579 RSC.
- J. J. M. Halls and R. H. Friend, Synth. Met., 1997, 85, 1307–1308 CrossRef CAS.
- C. W. Struijk, A. B. Sieval, J. E. J. Dakhorst, M. van Dijk, P. Kimkes, R. B. M. Koehorst, H. Donker, T. J. Schaafsma, S. J. Picken, A. M. van de Craats, J. M. Warman, H. Zuilhof and E. J. R. Sudholter, J. Am. Chem. Soc., 2000, 122, 11057–11066 CrossRef.
- C. Im, W. Tian, H. Bassler, A. Fechtenkötter, M. D. Watson and K. Müllen, Synth. Met., 2003, 139, 683–686 CrossRef CAS.
- M. Cotlet, S. Masuo, G. B. Luo, J. Hofkens, M. Van der Auweraer, J. Verhoeven, K. Müllen, X. L. S. Xie and F. De Schryver, Proc. Natl. Acad. Sci. U. S. A., 2004, 101, 14343–14348 CrossRef CAS.
- F. C. De Schryver, T. Vosch, M. Cotlet, M. Van der Auweraer, K. Müllen and J. Hofkens, Acc. Chem. Res., 2005, 38, 514–522 CrossRef CAS.
- F. Dinelli, R. Capelli, M. A. Loi, M. Murgia, M. Muccini, A. Facchetti and T. J. Marks, Adv. Mater., 2006, 18, 1416–1420 CrossRef CAS.
- G. Horowitz, F. Kouki, P. Spearman, D. Fichou, C. Nogues, X. Pan and F. Garnier, Adv. Mater., 1996, 8, 242 CAS.
- C. R. Newman, C. D. Frisbie, D. A. da Silva, J. L. Brédas, P. C. Ewbank and K. R. Mann, Chem. Mater., 2004, 16, 4436–4451 CrossRef CAS.
- B. A. Jones, M. J. Ahrens, M. H. Yoon, A. Facchetti, T. J. Marks and M. R. Wasielewski, Angew. Chem., Int. Ed., 2004, 43, 6363–6366 CrossRef CAS.
- R. J. Chesterfield, J. C. McKeen, C. R. Newman, C. D. Frisbie, P. C. Ewbank, K. R. Mann and L. L. Miller, J. Appl. Phys., 2004, 95, 6396–6405 CrossRef CAS.
- G. Witte and C. Woll, J. Mater. Res., 2004, 19, 1889–1916 CrossRef CAS.
- X. W. Zhan, Z. A. Tan, B. Domercq, Z. S. An, X. Zhang, S. Barlow, Y. F. Li, D. B. Zhu, B. Kippelen and S. R. Marder, J. Am. Chem. Soc., 2007, 129, 7246–7247 CrossRef CAS.
- R. Dabirian, V. Palermo, A. Liscio, E. Schwartz, M. B. J. Otten, C. E. Finlayson, E. Treossi, R. H. Friend, G. Calestani, K. Müllen, R. J. M. Nolte, A. E. Rowan and P. Samorì, J. Am. Chem. Soc., 2009, 131, 7055–7063 CrossRef CAS.
- J. J. Dittmer, R. Lazzaroni, P. Leclère, P. Moretti, M. Granström, K. Petritsch, E. A. Marseglia, R. H. Friend, J. L. Brédas, H. Rost and A. B. Holmes, Sol. Energy Mater. Sol. Cells, 2000, 61, 53–61 CrossRef CAS.
- F. Würthner, Z. J. Chen, F. J. M. Hoeben, P. Osswald, C. C. You, P. Jonkheijm, J. von Herrikhuyzen, A. Schenning, P. van der Schoot, E. W. Meijer, E. H. A. Beckers, S. C. J. Meskers and R. A. J. Janssen, J. Am. Chem. Soc., 2004, 126, 10611–10618 CrossRef.
- J. L. Li, F. Dierschke, J. S. Wu, A. C. Grimsdale and K. Müllen, J. Mater. Chem., 2006, 16, 96–100 RSC.
- W. S. Shin, H. H. Jeong, M. K. Kim, S. H. Jin, M. R. Kim, J. K. Lee, J. W. Lee and Y. S. Gal, J. Mater. Chem., 2006, 16, 384–390 RSC.
- A. Liscio, G. De Luca, F. Nolde, V. Palermo, K. Müllen and P. Samorì, J. Am. Chem. Soc., 2008, 130, 780–781 CrossRef CAS.
- V. Palermo, M. B. J. Otten, A. Liscio, E. Schwartz, P. A. J. de Witte, M. A. Castriciano, M. M. Wienk, F. Nolde, G. De Luca, J. J. L. M. Cornelissen, R. A. J. Janssen, K. Müllen, A. E. Rowan, R. J. M. Nolte and P. Samorì, J. Am. Chem. Soc., 2008, 130, 14605–14614 CrossRef CAS.
- H. Z. Chen, M. M. Shi, T. Aernouts, M. Wang, G. Borghs and P. Heremans, Sol. Energy Mater. Sol. Cells, 2005, 87, 521–527 CrossRef CAS.
- H. Z. Chen, M. M. Ling, X. Mo, M. M. Shi, M. Wang and Z. Bao, Chem. Mater., 2007, 19, 816–824 CrossRef CAS.
- B. A. Jones, A. Facchetti, M. R. Wasielewski and T. J. Marks, J. Am. Chem. Soc., 2007, 129, 15259–15278 CrossRef CAS.
- J. H. Oh, S. Liu, Z. Bao, R. Schmidt and F. Würthner, Appl. Phys. Lett., 2007, 91, 212107 CrossRef.
- R. Schmidt, M. M. Ling, J. H. Oh, M. Winkler, M. Konemann, Z. N. Bao and F. Würthner, Adv. Mater., 2007, 19, 3692–3695 CrossRef CAS.
- A. Stabel, P. Herwig, K. Müllen and J. P. Rabe, Angew. Chem., Int. Ed. Engl., 1995, 34, 1609–1611 CrossRef CAS.
- P. Samorí, A. Fechtenkötter, T. Böhme, F. Jäckel, K. Müllen and J. Rabe, J. Am. Chem. Soc., 2001, 123, 11462–11467 CrossRef CAS.
- F. Nolde, J. Q. Qu, C. Kohl, N. G. Pschirer, E. Reuther and K. Müllen, Chem.–Eur. J., 2005, 11, 3959–3967 CrossRef CAS.
- F. Nolde, W. Pisula, S. Muller, C. Kohl and K. Müllen, Chem. Mater., 2006, 18, 3715–3725 CrossRef CAS.
- W. Pisula, M. Kastler, D. Wasserfallen, J. W. F. Robertson, F. Nolde, C. Kohl and K. Müllen, Angew. Chem., Int. Ed., 2006, 45, 819–823 CrossRef CAS.
- C. A. Hunter, K. R. Lawson, J. Perkins and C. J. Urch, J. Chem. Soc., Perkin Trans. 2, 2001, 651–669 RSC.
- P. Samorì, M. Surin, V. Palermo, R. Lazzaroni and P. Leclère, Phys. Chem. Chem. Phys., 2006, 8, 3927–3938 RSC.
- J. Loiseau, E. Fouquet, R. H. Fish, J. M. Vincent and J. B. Verlhac, J. Fluorine Chem., 2001, 108, 195–197 CrossRef CAS.
- R. Kaplanek, T. Briza, M. Havlik, B. Dolensky, Z. Kejik, P. Martasek and V. Kral, J. Fluorine Chem., 2006, 127, 386–390 CrossRef CAS.
- W. Kern and D. A. Puotinen, RCA Rev., 1970, 31, 187–206 Search PubMed.
- G. De Luca, A. Liscio, P. Maccagnani, F. Nolde, V. Palermo, K. Müllen and P. Samorì, Adv. Funct. Mater., 2007, 17, 3791–3798 CrossRef CAS.
- G. De Luca, A. Liscio, F. Nolde, L. M. Scolaro, V. Palermo, K. Müllen and P. Samorì, Soft Matter, 2008, 4, 2064–2070 RSC.
- E. Treossi, A. Liscio, X. Feng, V. Palermo, K. Müllen and P. Samorì, Small, 2009, 5, 112–119 CrossRef CAS.
- A. Datar, R. Oitker and L. Zang, Chem. Commun., 2006, 1649–1651 RSC.
- P. Samorì, Chem. Soc. Rev., 2005, 34, 551–561 RSC.
- S. S. Sheiko and M. Möller, Chem. Rev., 2001, 101, 4099–4123 CrossRef CAS.
- H. Takano, J. R. Kenseth, S.-S. Wong, J. C. O'Brien and M. D. Porter, Chem. Rev., 1999, 99, 2845–2890 CrossRef CAS.
- M. O. Finot and M. T. McDermott, J. Am. Chem. Soc., 1997, 119, 8564–8565 CrossRef CAS.
- P. Lèclere, R. Lazzaroni, J. L. Brédas, J. M. Yu, P. Dubois and R. Jérôme, Langmuir, 1996, 12, 4317–4320 CrossRef CAS.
- L. M. Scolaro, A. Romeo, M. A. Castriciano, G. De Luca, S. Patanè and N. Micali, J. Am. Chem. Soc., 2003, 125, 2040–2041 CrossRef.
- K. Balakrishnan, A. Datar, T. Naddo, J. Huang, R. Oitker, M. Yen, J. Zhao and L. Zang, J. Am. Chem. Soc., 2006, 128, 7390–7398 CrossRef CAS.
- The apparent hypochromicity observed in the normalized extinction spectra (Fig. 2b) of the more concentrated solutions is a result of the difference between nominal vs. actual concentrations of monomeric BPF-PDI that is still present in solution.
- M. Kastler, W. Pisula, D. Wasserfallen, T. Pakula and K. Müllen, J. Am. Chem. Soc., 2005, 127, 4286–4296 CrossRef CAS.
- P. Job, Ann. Chim. (Paris), 1928, 9, 113–203 Search PubMed.
- K. Hirose, in Analytical Methods in Supramolecular Chemistry, ed. C. Schalley, Wiley-VCH, Weinheim, 2007, pp. 17–54 Search PubMed.
- To take into account the formation of more complex aggregates, spectroscopic data were also analyzed with models dealing with the formation of 2:2 or 3:3 species, but the corresponding fitting procedures failed to converge.
- The difference in band intensity that can be seen on comparing the emission profiles of concentrated vs. diluted blends can be ascribed to the different geometry (front face vs. right angle, respectively) that had to be used to record the fluorescence spectra. See J. R. Lakowicz,Principles of Fluorescence Spectroscopy, 3rd edn, Springer, 2006, pp. 55–57 Search PubMed.
- B. P. Binks, P. D. I. Fletcher, S. N. Kotsev and R. L. Thompson, Langmuir, 1997, 13, 6669–6682 CrossRef CAS.
- P. Lo Nostro, C. Y. Ku, S. H. Chen and J. S. Lin, J. Phys. Chem., 1995, 99, 10858–10864 CrossRef CAS.
- V. Palermo and P. Samorì, Angew. Chem., Int. Ed., 2007, 46, 4428–4432 CrossRef CAS.
- M. Chiesa, L. Burgi, J. S. Kim, R. Shikler, R. H. Friend and H. Sirringhaus, Nano Lett., 2005, 5, 559–563 CrossRef CAS.
- H. Hoppe, T. Glatzel, M. Niggemann, A. Hinsch, M. C. Lux-Steiner and N. S. Sariciftci, Nano Lett., 2005, 5, 269–274 CrossRef CAS.
- V. Palermo, G. Ridolfi, A. M. Talarico, L. Favaretto, G. Barbarella, N. Camaioni and P. Samorì, Adv. Funct. Mater., 2007, 17, 472–478 CrossRef CAS.
- J.-Y. Wang, J. Yan, L. Ding, Y. Ma and J. Pei, Adv. Funct. Mater., 2009, 19, 1746–1752 CrossRef CAS.
- I. Fischbach, T. Pakula, P. Minkin, A. Fechtenkotter, K. Müllen, H. W. Spiess and K. Saalwachter, J. Phys. Chem. B, 2002, 106, 6408–6418 CrossRef CAS.
- M. R. Hansen, T. Schnitzler, W. Pisula, R. Graf, K. Müllen and H. W. Spiess, Angew. Chem., Int. Ed., 2009, 48, 4621–4624 CrossRef CAS.
- J. P. Schmidtke, R. H. Friend, M. Kastler and K. Müllen, J. Chem. Phys., 2006, 124, 174704 CrossRef.
- F. Babudri, G. M. Farinola, F. Naso and R. Ragni, Chem. Commun., 2007, 1003–1022 RSC.
- T. Hasegawa, K. Inukai, S. Kagoshima, T. Sugawara, T. Mochida, S. Sugiura and Y. Iwasa, Chem. Commun., 1997, 1377–1378 RSC.
- J. A. K. Howard, V. J. Hoy, D. OHagan and G. T. Smith, Tetrahedron, 1996, 52, 12613–12622 CrossRef CAS.
- K. Reichenbacher, H. I. Suss and J. Hulliger, Chem. Soc. Rev., 2005, 34, 22–30 RSC.
- W. Pisula, Z. Tomovic, C. Simpson, M. Kastler, T. Pakula and K. Müllen, Chem. Mater., 2005, 17, 4296–4303 CrossRef CAS.
- B.-K. An, S. H. Gihm, J. W. Chung, C. R. Park, S.-K. Kwon and S. Y. Park, J. Am. Chem. Soc., 2009, 131, 3950–3957 CrossRef CAS.
- F. Emmerling, I. Orgzall, B. Dietzel, B. W. Schulz, G. Reck and B. Schulz, J. Mol. Struct., 2007, 832, 124–131 CrossRef CAS.
- L. Shimoni, H. L. Carrell, J. P. Glusker and M. M. Coombs, J. Am. Chem. Soc., 1994, 116, 8162–8168 CrossRef CAS.
- G. R. Desiraju and T. Steiner, The Weak Hydrogen Bond, Oxford University Press, Oxford, 1999 Search PubMed.
- P. G. Boswell, E. C. Lugert, J. Rábai, E. A. Amin and P. Bühlmann, J. Am. Chem. Soc., 2005, 127, 16976–16984 CrossRef CAS.
Footnote |
| † Electronic supplementary information (ESI) available: Explanation of dense network formation during BPF-PDI drop-casting; AFM and OM images of PDI7 and HBC-C12 samples cast on SiO2; equatorial integrations of the 2D WAXS patterns; synthesis and characterization of BPF-PDI. See DOI: 10.1039/b915484a |
| This journal is © The Royal Society of Chemistry 2010 |