Heterogeneous In/Mo cooperative bandgap engineering for promoting visible-light-driven CO2 photoreduction†
Guoyang
Gao
a,
Qiuye
Wang
a,
Peifen
Zhu
 *b,
Hongyang
Zhu
c,
Yang
Qu
 a and
Guofeng
Wang
 *a
*a
aKey Laboratory of Functional Inorganic Material Chemistry, Ministry of Education, School of Chemistry and Materials Science, Heilongjiang University, Harbin 150080, China. E-mail: 2010070@hlju.edu.cn
bDepartment of Electrical Engineering and Computer Science, University of Missouri, Columbia, Missouri 65211, USA. E-mail: pzhu@missouri.edu
cSchool of Physics and Electronic Engineering, Linyi University, Linyi 276005, China
First published on 9th June 2022
Abstract
Improving the low charge separation efficiency, poor light absorption capacity, and insufficient active sites of photocatalysts are the important challenges for CO2 photoreduction. In this study, a Mo modified InOOH/In(OH)3 heterojunction with enhanced CO2 reduction efficiency was synthesized in situ by using an In(OH)3 monatomic lamellar material with isolated In atom sites exposed on its surface. And bandgap tuning via the energy levels formed by Mo doping and vacancy defect engineering can simultaneously improve visible light absorption and photogenerated charge separation. The results of experimental characterization and DFT calculation show that the Mo impurity energy levels, O defect energy levels, and surface Mo atoms existing in the InOOH phase can act as an electron transfer ladder in cooperation with the In defect energy levels in the In(OH)3 phase, thereby promoting electron transfer between heterogeneous interfaces. Under visible light irradiation, the evolution rates of CH4 and CO of the Mo modified InOOH/In(OH)3 photocatalyst are more than ∼11 and ∼8 times higher than those of InOOH, respectively. This work provides new insights into the design of the CO2 photoreduction platform through a collaborative strategy of bandgap tuning, transition metal doping, and heterostructure construction.
1. Introduction
Industrial development has promoted the progress of human society, but it has also produced many negative effects. The use of fossil fuels not only accelerated the energy shortage but also significantly increased CO2 emissions, causing many serious environmental problems including the greenhouse effect.1–3 Therefore, the effective catalytic reduction of CO2 into value-added products plays an indispensable role in alleviating energy and environmental issues.4–8 In recent years, various strategies including photocatalytic reduction, electrochemical reduction, and photoelectrochemical reduction have been widely used in CO2 conversion.9–13 Among them, photocatalytic CO2 reduction, which uses abundant and sustainable solar energy to mimic natural photosynthesis, has received increasing attention.14–18 Although a variety of semiconductor photocatalysts have been developed, most of them still have low photocatalytic activity, low conversion efficiency, and low light utilization, which greatly limit possible practical applications. Therefore, the development of excellent photocatalysts is still the key requirement for developing actual CO2 conversion processes.Generally, the CO2 photoreduction reaction mainly includes light absorption, photo-generated electron–hole separation, and photo-excited electron reduction of CO2.19–21 Although some excellent semiconductor catalysts, such as g-C3N4,22,23 TiO2,24,25 CdS,26,27 and BiVO4,28,29 have been developed, the poor optical absorption capacity, high recombination rate of photogenerated electron–hole pairs, lack of active sites and low stability are still urgent scientific problems to be solved. In recent years, the advent of single-atom catalysts broke through the bottleneck of the development of traditional heterogeneous photocatalytic systems. Due to the unique electronic structure, highly uniform active center and adjustable coordination environment, and other special characteristics, the single-atom catalysts exhibit excellent catalytic activity.30–34 Although strategies such as atom doping,35,36 defect engineering,37–39 and heterostructure construction40–43 have greatly broadened the development of photocatalysts, it is still very challenging to achieve multi-method fusion to effectively improve photocatalytic activity on this basis.
As a kind of important semiconductor material, indium-based semiconductor nanomaterials (In2O3, In(OH)3, InOOH, In2S3, InN, etc.) have been widely concerned, which are widely used in the fields of optoelectronics, gas sensing, and catalysis.44–47 The indium-based hydroxide is rich in hydroxyl groups, which will help activate water molecules to promote catalytic reactions in the water phase.48,49 However, the hydroxy-rich In(OH)3 and InOOH, as wide bandgap semiconductors, are generally unable to absorb visible light, which will limit their applications in the field of CO2 photoreduction.50–52 It is noteworthy that InOOH as a catalyst for photocatalytic CO2 reduction has been rarely reported. Therefore, by appropriate modification engineering to adjust the band structure, promote visible light absorption, and achieve effective electron–hole separation, they will surely become promising visible light-responsive photocatalysts.
In this research, we synthesized a two-dimensional In(OH)3 monatomic lamellar material with highly isolated In atom active sites for the first time. And then, Mo modified In(OH)3 atomic-layer-based InOOH composite photocatalyst was prepared by in situ synthesis methods. In this composite system, impurity and defect energy levels were introduced into the bandgap by Mo doping and In/O defects to promote visible light absorption and charge separation. The photocatalytic reaction results show that CO2 can be effectively reduced to CO and CH4 in the pure water system without any sacrificial agents, which indicates that the as-prepared photocatalysts involve two-electron reduction and eight-electron reduction behaviors in the photoreduction process. Compared with InOOH, the CH4 and CO yields of the Mo modified InOOH/In(OH)3 were increased by ∼11 times and ∼8 times, respectively. A series of experimental results and theoretical calculations show that the coordinated system of surface Mo atoms, Mo impurity energy levels, and In/O defect energy levels can be used as an electron transfer ladder to promote electron transfer from InOOH to In(OH)3. This work provides a new idea for designing a highly active and wide bandgap semiconductor composite photocatalytic system with an excellent visible light response.
2. Experimental
The chemicals, characterization details and computational details are shown in ESI.†2.1 Synthesis of In(OH)3 and InOOH
NaOH (1.00 g), deionized water (8 mL), ethanol (8 mL), and oleic acid (10 mL) were successively added into a beaker under constant stirring. Afterward, In(NO3)3 aqueous solution (2 mL, 0.5 mol L−1) was slowly dropped into the beaker. After stirring for 60 min, the colloidal solution was transferred into a 50 mL Teflon-lined autoclave and subjected to hydrothermal treatment at 200 °C for 12 h. After the reaction, the obtained white precipitations were washed with cyclohexane and ethanol and then dried at 60 °C in an oven for 12 h. Finally, the white In(OH)3 powder was obtained. For the synthesis of InOOH, the volumes of deionized water and oleic acid in the initial reactants are changed to 11 and 13 mL, respectively, and the white InOOH powder was obtained.2.2 Synthesis of InOOH/In(OH)3 and Mo-doped InOOH/In(OH)3 heterojunction
For the synthesis of InOOH/In(OH)3 heterojunction, NaOH (1.00 g), deionized water (11 mL), ethanol (8 mL), and oleic acid (13 mL) were successively added into a beaker under constant stirring. Under the condition of stirring, a certain quality of In(OH)3 powder was fully dispersed in the above-mixed solution. Then, 2 mL In(NO3)3 aqueous solution (0.5 mol L−1) was slowly added dropwise to the mixed solution. The other experimental procedures are consistent with the synthesis of InOOH. According to the theoretical mass percentage (10 wt%, 20 wt%, and 30 wt%) of In(OH)3 added, the obtained products were named IOOH/IOH-10, IOOH/IOH-20, and IOOH/IOH-30 respectively. For the synthesis of Mo-doped InOOH/In(OH)3 heterojunction, the previous synthesis steps are the same as those of InOOH/In(OH)3, except that 1.97 mL In(NO3)3 aqueous solution (0.5 mol L−1) and 0.03 mL Na2MoO4 aqueous solution (0.5 mol L−1) were slowly added dropwise to the mixed solution of NaOH (1.00 g), deionized water (11 mL), ethanol (8 mL), oleic acid (13 mL), and the theoretical mass percentage of 20 wt% In(OH)3. The obtained product was named Mo–IOOH/IOH-20.3. Results and discussion
3.1. Design scheme of overall work
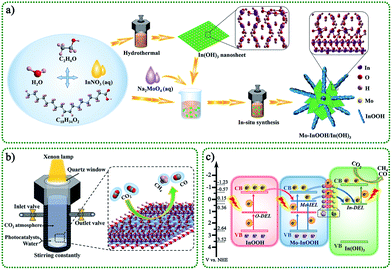
The overall design route of the work was shown in Scheme 1. In this study, we constructed a novel Mo modified InOOH/In(OH)3 heterojunction photocatalyst based on the unique advantages of transition metal element doping, two-dimensional thin-layer materials, defective semiconductor materials, and heterostructures. Specifically, In(OH)3 monatomic lamellar material with isolated In atom active sites and In vacancy defects were prepared by a simple hydrothermal method. Further, the obtained In(OH)3 nanosheets and related reactants were added to the reactor to obtain Mo modified InOOH/In(OH)3 heterojunction photocatalyst by in situ synthesis.The schematic diagram of the reaction system for photocatalytic reduction of CO2 is shown in Scheme 1b. The CO2 photoreduction reaction process of the as-prepared photocatalyst took place in a closed reactor with a CO2 atmosphere and pure water system. Under the light irradiation with a xenon lamp as the light source, the reduction products of CO2 were mainly CO and CH4. Here, we proposed a feasible photocatalytic mechanism, as shown in Scheme 1c. Under visible light irradiation (λ >420 nm), photocatalytic activity is achieved through a multi-level electron transfer mechanism. The presence of oxygen defect energy level (O-DEL), Mo impurity energy level (Mo-IEL), and In defect energy level (In-DEL) narrows the energy bandgap. First, the initial electrons are excited from the valence band (VB) of InOOH to the O-DEL and the Mo-lEL. Then the excited electrons located at the Mo-IEL are further transferred to the In-DEL of the In(OH)3. It is further excited to the conduction band (CB) of In(OH)3 by absorbing photons, and finally, a CO2 reduction reaction occurs. In addition, the excited electrons of the O-DEL can be transferred to the CB by absorbing photons and then transferred to the Mo-IEL or the In-DEL. The Mo doping strategy can not only introduce impurity energy levels but also form surface Mo atoms to promote charge transfer between interfaces. Therefore, the excellent charge separation efficiency, efficient interfacial charge transfer, and isolated In atom active sites on the surface of In(OH)3 will surely enable the designed photocatalysts to have excellent catalytic activity.
3.2. Morphology properties and structure analysis
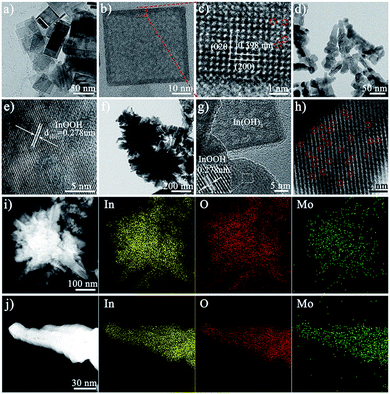
The morphology of the as-synthesized photocatalysts can be visualized by using an electron microscope. The scanning electron microscopy (SEM), transmission electron microscopy (TEM), and high-resolution transmission electron microscope (HRTEM) images of In(OH)3 show the morphology of regular two-dimensional square flakes, as shown in Fig. 1a–c and S1.† More importantly, it can be seen from the high-magnification TEM image (Fig. 1c) that the surface of the In(OH)3 sheet exposes abundant isolated In atom sites. And the observed lattice spacing of 0.398 nm corresponds to the (020) or (200) crystal plane spacing of In(OH)3. In addition, the In vacancy defects marked by red circles can also be observed on the surface of In(OH)3 nanosheets, which will also be further studied by UV-vis diffuse reflectance spectra and photoluminescence spectra. InOOH photocatalysts exhibit an irregular rod-like morphology, as shown in Fig. 1d, e and S2.† The HRTEM images of InOOH photocatalysts show a lattice spacing of 0.278 nm, which can be assigned to the (101) crystal plane. The element mapping image shows that In and O elements are uniformly distributed on the surface of InOOH nanorods (Fig. S3†). As shown in Fig. 1f and g, the Mo–IOOH/IOH-20 composite photocatalysts with the flower-like composite cluster structure have observed In(OH)3 and InOOH two-phase materials under the high magnification field of view. Aberration-corrected high-angle annular dark-field scanning transmission electron microscopy (AC HAADF-STEM) results confirmed the existence of Mo single-atom sites in the InOOH/In(OH)3 heterojunction photocatalysts (Fig. 1h). Both the low-magnification and high-magnification element mapping images further confirmed that the Mo elements are uniformly distributed on the surface of the photocatalysts, as shown in Fig. 1i and g.Next, the structure of the as-synthesized photocatalysts was studied. The powder X-ray diffraction (XRD) analysis results show that pure cubic phase In(OH)3 and orthorhombic phase InOOH have been obtained. And the XRD spectra of IOOH/IOH-x (x = 10, 20, and 30) and Mo–IOOH/IOH-20 composite photocatalysts show the diffraction peaks of In(OH)3 and InOOH simultaneously, indicating the coexistence of the two phases (Fig. 2a and S4†). Especially, no new diffraction peaks are introduced after Mo doping, indicating that Mo doping does not change the product's crystal phase.
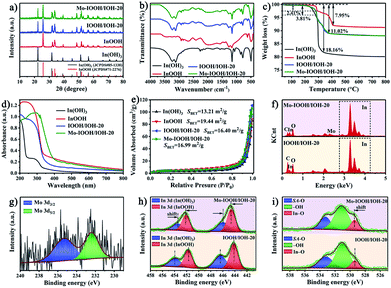
The FT-IR spectra of In(OH)3 and InOOH both reveal typical characteristic absorption peaks. As shown in Fig. 2b, the characteristic absorption peaks located at 3230 cm−1 (O–H stretching vibrations), 1155 cm−1 (O–H bending vibration), 780 cm−1 (O–H bending vibration), and 494 cm−1 (In–OH absorption bands) can be attributed to the functional groups of In(OH)3. And the characteristic absorption peaks attributed to InOOH are located at 2924 cm−1 (–CH2 asymmetric stretching mode), 2854 cm−1 (–CH2 symmetric stretching mode), 1269 cm−1 (O–H bending or deformation vibration), 1160 cm−1 (O–H bending or deformation vibration), and 491 cm−1 (In–O vibration), respectively.52,53 The characteristic peaks attributed to both In(OH)3 and InOOH were observed for the Mo–IOOH/IOH-20 composite photocatalysts, which further confirmed that the Mo–IOOH/IOH-20 composite photocatalysts have been successfully obtained. The structural information of InOOH, IOOH/IOH-20, and Mo–IOOH/IOH-20 was also further investigated by Raman spectrometry (Fig. S5†). The peaks at 228, 272, 316, and 459 cm−1 can be assigned to the characteristic vibration modes of InOOH. In contrast, the slight shifts in the characteristic peaks of IOOH/IOH-20 and Mo–IOOH/IOH-20 indicate the formation of a heterojunction between In(OH)3 and InOOH.
The TGA analysis results show that all the In(OH)3, InOOH, IOOH/IOH-20, and Mo–IOOH/IOH-20 samples exhibit excellent thermal stability with no significant weight loss in the range of 200 °C (Fig. 2c). The thermal weight loss curve of In(OH)3 shows two weight loss steps with a total weight loss of about 18.16%, which can be attributed to the desorption of the surface-adsorbed solvent molecules and dehydration during the transition from In(OH)3 to In2O3.48 Similarly, there are two obvious stages of thermal weight loss in InOOH. The weight loss in the first and second stages is caused by the desorption of the surface-adsorbed solvent molecules below 290 °C and the conversion of InOOH to In2O3 at higher temperatures above 290 °C, respectively.54 The total weight loss of IOOH/IOH-20 and Mo–IOOH/IOH-20 are both about 11.02%, showing a similar thermogravimetric loss process as above.
It can also be seen from the UV-visible absorption curve (Fig. 2d) that the InOOH has significant tailing absorption in the wavelength range of 350–800 nm, indicating that it has visible light absorption ability. In addition, the In(OH)3 photocatalyst exhibits strong absorption bands caused by the In vacancy defect in the wavelength range of 240–350 nm, which is similar to the results previously reported.48,50 It is worth noting that compared with IOOH/IOH-20, the absorption spectrum of Mo–IOOH/IOH-20 photocatalyst is redshifted and its visible absorption capacity is enhanced. The bandgap energies of InOOH, IOOH/IOH-20, and Mo–IOOH/IOH-20 are 3.21, 3.30, and 2.60 eV, respectively (Fig. S6†). In particular, In(OH)3 has two bandgap energies of 4.75 and 3.16 eV. And the former one can be attributed to the main bandgap from bulk In(OH)3, while later one is created by In vacancy. This is consistent with the previously reported results.48,50 In addition, UV diffuse reflectance spectra and bandgaps plots of IOOH/IOH-10 and IOOH/IOH-30 are shown in Fig. S7.†
In general, the specific surface area and pore structure of the photocatalyst are positively related to the adsorption performance. Therefore, the physical properties of the specific surface area and pore structure of the prepared series of photocatalysts were studied (Fig. 2e and S8†). All the four types of In(OH)3, InOOH, IOOH/IOH-20, and Mo–IOOH/IOH-20 photocatalysts exhibit typical type-IV adsorption–desorption isotherms with obvious hysteresis loops and condensation steps, indicating the existence of mesopores and macropores. The Brunauer–Emmett–Teller (BET) specific surface areas of In(OH)3 and InOOH photocatalysts are 13.21 and 19.44 m2 g−1, respectively. The BET-specific surface area of the Mo–IOOH/IOH-20 composite photocatalyst is 16.99 m2 g−1, which maintains a relatively large specific surface area. Energy dispersive spectrometer (EDS) analysis further explained the elemental composition of the synthesized photocatalysts. The EDS spectrum shows the presence of C, In, O, Mo, Cu, and Al elements in the IOOH/IOH-20 photocatalysts (Fig. 2f). The Cu and Al elements are derived from the sample test carrier. Mo element was also observed on the surface of the Mo–IOOH/IOH-20 composite photocatalysts. The EDS spectra of In(OH)3 and InOOH are shown in Fig. S9.†
The composition and surface electronic state of the as-synthesized photocatalysts were further explained by X-ray photoelectron spectroscopy (XPS). The XPS survey spectra reveal that all photocatalysts are composed of target elements and C (adventitious carbon) elements (Fig. S10†). The high-resolution Mo 3d spectrum of Mo–IOOH/IOH-20 shows the binding energies of Mo 3d3/2 and Mo 3d5/2 peaks at 235.3 eV and 232.4 eV, respectively, indicating that Mo mainly exists in the form of +6 (Fig. 2g). The binding energies of In 3d3/2 and In 3d5/2 are 454.05 eV and 446.50 eV for In(OH)3, 451.70 eV and 444.15 eV for InOOH, respectively (Fig. S11 and S12†). As shown in Fig. S11 and S12,† the O 1s high-resolution spectra can confirm two types of oxygen species (surface adsorbed oxygen and –OH) for In(OH)3, and three types of oxygen species (surface adsorbed oxygen (SA-O), In–O, and –OH) for InOOH, respectively. According to the In 3d spectra of IOOH/IOH-20 and Mo–IOOH/IOH-20 (Fig. 2h), the signal peaks for the In(OH)3 phase and the InOOH phase can be identified one by one. Among them, the In 3d orbit signal peaks of In(OH)3 phase and InOOH phase in Mo–IOOH/IOH-20 are shifted by 0.5 eV to low binding energy and 0.45 eV to high binding energy, respectively. Similarly, the In–O oxygen species assigned to the InOOH phase are also shifted to higher high binding energies (Fig. 2i). These results indicate that the charge density around the atoms in the In(OH)3 phase is increased and the charge density around the atoms in the InOOH phase is decreased, implying that electrons can be transferred from InOOH to In(OH)3. More importantly, Mo single-atoms can also facilitate the charge transfer between the heterointerfaces, which is consistent with the mechanism mentioned above.
3.3. Photocatalytic activity and charge separation
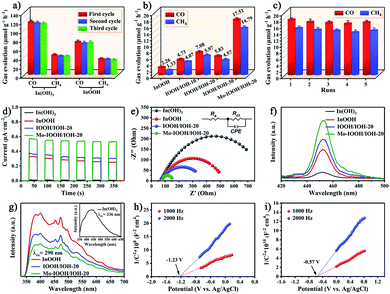
The CO2 reduction activity of all the prepared photocatalysts was also evaluated. The prepared photocatalysts were subjected to a CO2 photoreduction reaction for 5 hours in a pure water system without using any sacrificial agents. The results show that CO and CH4 are the main products of the photocatalytic reaction. As shown in Fig. 3a, both In(OH)3 and InOOH exhibit highly efficient CO and CH4 evolution rates under ultraviolet light irradiation, and the yields hardly changed after three cycles of reaction. Among them, the CO and CH4 evolution rates of In(OH)3 photocatalyst are 116.62 and 42.81 μmol g−1 h−1, respectively. In further exploration, the CO2 photoreduction ability of InOOH, IOOH/IOH-x (x = 10, 20, and 30), and Mo–IOOH/IOH-20 photocatalysts were evaluated under visible-light irradiation (Fig. 3b). The results demonstrate that the CO and CH4 evolution rate of Mo–IOOH/IOH-20 is 17.51 and 14.79 μmol g−1 h−1, respectively, which are significantly higher than those of InOOH and IOOH/IOH-x (x = 10, 12, and 30). Compared with InOOH, the evolution rate of CO and CH4 over Mo–IOOH/IOH-20 were increased by ∼8 times and ∼11 times, respectively. The selectivity of CO2 photoreduction products of the prepared photocatalysts is shown in Fig. S13.† Furthermore, the CO2 adsorption capacity of the photocatalysts was further investigated by CO2-TPD experiments (Fig. S14†). The results show that In(OH)3 exhibits stronger CO2 desorption band and surface basic sites in the range of 25–280 °C compared to InOOH, which proves that In(OH)3 surface has higher CO2 adsorption ability. The above results further indicate that the combination of material recombination, dual-single-atom modification, and bandgap tuning is an effective strategy to improve the efficiency of CO2 photoreduction. In addition, the evolution rate of CO and CH4 for Mo–IOOH/IOH-20 hardly changed during the five catalytic reactions (Fig. 3c). The structure of the photocatalysts after the catalytic reaction was also studied. The results of the XRD pattern show that there are no other phases or impurities in Mo–IOOH/IOH-20 after the reaction, indicating that it maintained excellent structural stability during the reaction (Fig. S15†).The charge separation efficiency was studied by recording the transient photocurrent response of several on/off cycles under visible light irradiation. As shown in Fig. 3d, the photocurrent of all photocatalysts shows high repeatability and stability in multiple cycles. The Mo–IOOH/IOH-20 shows greater photocurrent intensity, further confirming that it has higher photogenerated carrier separation and transfer efficiency. Furthermore, the electrochemical impedance spectroscopy (EIS) and the equivalent circuit diagram obtained by fitting indicate that Mo–IOOH/IOH-20 has a smaller semicircle radius and Rct value compared with In(OH)3, InOOH and IOOH/IOH-20 (Fig. 3e and Table S1†). These results confirm that the interfacial charge transfer resistance of Mo–IOOH/IOH-20 is significantly reduced, which can be inferred that the introduction of Mo promotes charge transfer and separation.55 In further research, the classic coumarin fluorescence was used to detect the amount of hydroxyl radicals (˙OH) produced during photochemical processes. As the key active substance, the ˙OH can react with coumarin to generate luminescent 7-hydroxycoumarin in the process of photocatalytic reaction.19,55 Therefore, the production of ˙OH is directly proportional to the fluorescence signal intensity. As shown in Fig. 3f, the fluorescence spectra test results show that Mo–IOOH/IOH-20 has the highest ˙OH yield, which means higher electron–hole pair separation efficiency. The improvement of photogenerated carrier separation and transfer efficiency can be attributed to the existence of the Mo-impurity energy levels, In/O defect energy levels, and heterojunction interface.
Room temperature photoluminescence (PL) spectroscopy also further confirmed that IOOH/IOH-20 has a higher charge separation efficiency (Fig. 3g). Previous studies have shown that In vacancy defects can cause the crystalline In(OH)3, which has no photoluminescence emission, to appear a wide emission peak in the range of about 350 to 750 nm.47 In this study, we also observed the In vacancy defect-states emission in the PL spectrum of In(OH)3. This result further confirms that the absorption peak at around 300 nm in the UV diffuse reflectance spectrum of In(OH)3 is caused by In vacancy defects. In addition, the two broad emission bands in the range of 350 to 400 nm and 450 to 500 nm can be observed in the PL spectrum of InOOH, which can be attributed to intrinsic bandgap transition and oxygen vacancies state, respectively.48 In addition, Mott–Schottky plots exhibited a positive slope, indicating that In(OH)3 and InOOH are typical n-type semiconductors (Fig. 3h and i). And it can be known that the flat band potentials of In(OH)3 and InOOH are −1.23 and −0.57 V, respectively, which are equivalent to −1.03 and −0.37 V versus the normal hydrogen electrode (NHE), respectively. It is well known that the CB potentials of n-type semiconductors are about 0.1 or 0.2 V higher than the flat band potentials.48 Therefore, the CB potentials of In(OH)3 and InOOH are −1.23 and −0.57 V versus the NHE, respectively.
3.4. DFT calculation
The rationality of the designed charge separation system was further studied theoretically by using density functional theory (DFT). The geometric structures, charge density difference, and electron localization function of In16H16O32, MoIn15H16O32, Mo2In14H16O32, Mo4In12H16O32, Mo8In8H16O32, and Mo16H16O32 are shown in Fig. 4 and S16.† It is noted that the yellow area indicates gaining electrons, on the contrary, the blue area indicates losing electrons. Charge analysis showed that the net charge on In and Mo is 1.974260 and 1.863416, respectively. This indicates that the In is more easily to lose electrons than that of Mo. That leads to the electron density around Mo being larger than that around In. The bond order of In and Mo is 2.847246 and 2.216849, respectively. This indicates that Mo–O bond strength is larger than that of In–O. The theoretical simulation of band structure and density of states for In16H16O32, MoIn15H16O32, Mo2In14H16O32, Mo4In12H16O32, Mo8In8H16O32, and Mo16H16O32 are shown in Fig. S17.† It is noted that the differences of the six configurations are not only due to the Mo content but also due to the position of Mo replacing In. And thus, the results indicated that the bandgap is not only related to the doping amount of Mo but also related to the position where Mo replaces In. Overall, the bandgap of MoxIn16−xH16O32 (x = 0, 1, 2, 4, 8, and 16) increases with the increase of Mo content due to the larger bond strength of the M–O bond than that of the In–O bond.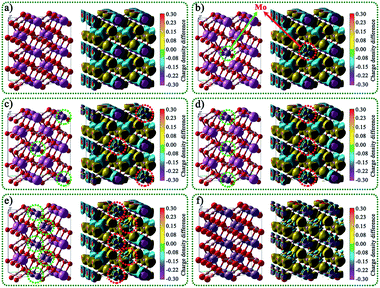 | ||
| Fig. 4 Geometric structures and the corresponding charge density difference of (a) In16H16O32, (b) MoIn15H16O32, (c) Mo2In14H16O32, (d) Mo4In12H16O32, (e) Mo8In8H16O32, and (f) Mo16H16O32. | ||
The geometric structures, charge density difference, calculated Fermi levels, and work functions of the (001) surface of MoxIn32−xH32O64 (x = 0, 2, 4, 8, 16, and 32) with different Mo doping amounts and different exposed atoms are shown in Fig. 5 and S18.† For In32H32O64, Mo8In24H32O64, and Mo32H32O64 in Fig. 5, the exposed atoms are mainly O, and the work function value decreases with the increase of Mo content. For Mo2In30H32O64, Mo4In28H32O64, and Mo16In16H32O64 in Fig. S18,† the exposed atoms are mainly In and Mo, and the work function value also decreases with the increase of Mo content. After doping Mo single atom, the reduction of surface work function values is conducive to the migration of electrons from the interior to the surface, which is conducive to the improvement of photocatalytic performance.
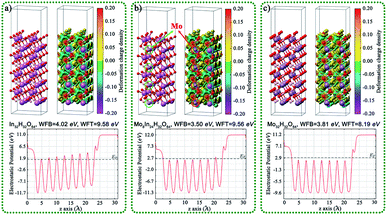 | ||
| Fig. 5 Geometric structures, charge density difference, calcula-ted Fermi levels, and work functions of the (001) surface of (a) In32H32O64, (b) Mo8In24H32O64, and (c) Mo32H32O64. | ||
We also compared the geometric structures, work functions, band structure (BS), and density of states (DOS) of the (001) surface for InOOH and In(OH)3, as shown in Fig. 6. The theoretical band gaps of InOOH and In(OH)3 are separately 4.90 and 3.88 eV, and the work function values are 3.12 and 7.75 eV for InOOH and In(OH)3, respectively. This result further proves that electrons tend to transfer from InOOH to In(OH)3 inside InOOH/In(OH)3 heterojunction.
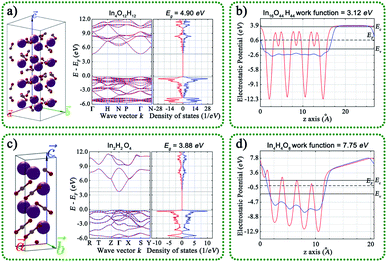 | ||
| Fig. 6 Geometric structures, band structure, the density of states, and calculated work functions of the (001) surface for (a and b) InOOH and (c and d) In(OH)3. | ||
The geometric structures, charge density difference, calculated Fermi levels, and work functions of the (001) surface of InOOH with different section thicknesses and different exposed atoms are shown in Fig. S19.† The results indicated that the Fermi levels, and work functions vales are related to the section thicknesses and different exposed atoms. The CO2 adsorbed on the (001) surface of In(OH)3 and InOOH with different section thicknesses, exposed atoms, and adsorption sites was also studied, as shown in Fig. 7 and S20.† The results indicated that the adsorption energies (Eads) of CO2 on the In(OH)3 (001) surface were much larger than those on the InOOH (001) surface. This indicates that CO2 will be preferentially adsorbed on the surface of In(OH)3. This result is consistent with the test results of CO2-TPD mentioned above.
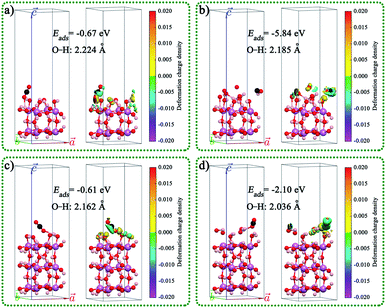 | ||
| Fig. 7 CO2 adsorbed on the (001) surface of In(OH)3 with different section thicknesses, exposed atoms, and adsorption sites: (a) In8CO26H24, (b) In8CO30H28, (c) In12CO38H36, and (d) In12CO40H40. | ||
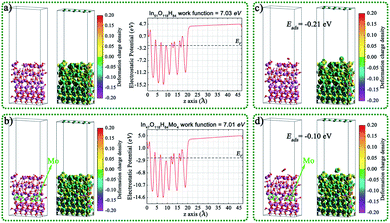
In order to further study the interfacial electron transport between In(OH)3 and InOOH, the InOOH/In(OH)3 and Mo doped InOOH/In(OH)3 heterojunction were constructed and the Eads of CO2 on the (001) surface of heterojunction were also calculated theoretically, as shown in Fig. 8. After Mo doping, the work function decreases slightly, which is more conducive to the transmission of electrons to the surface. In addition, the CO2 adsorption energy is reduced.
The optical properties of In4O12H12, In2H2O4, and MoxIn16−xH16O32 (x = 0, 1, 2, 4, 8, and 16) such as absorption coefficient, dielectric function, extinction coefficient, refractive index, reflectance, and optical conductivity were calculated by using DFT, as shown in Fig. S21 and S22.† The calculated results of In4O12H12, In2H2O4, and MoxIn16−xH16O32 (x = 0, 1, 2, 4, 8, and 16) show that they have significant differences in optical properties. More importantly, Mo doping has a positive effect on improving the optical properties of materials, which is an effective method to tune the optical properties of materials. This is consistent with the results of absorption spectra and band structures discussed above. Therefore, the optical properties of photocatalysts can be adjusted by Mo doping to achieve the purpose of improving photocatalytic activity.
4. Conclusions
In summary, an In(OH)3 monatomic lamellar material with isolated In atom sites exposed on its surface was successfully synthesized, which not only has high-efficiency photocatalytic performance, but also can be combined with InOOH to in situ prepare Mo modified InOOH/In(OH)3 heterojunction photocatalyst with visible-light response. And we also confirmed that bandgap tuning by introducing impurity levels and defect levels is a feasible strategy to improve visible light absorption and charge separation efficiency. The results show that the visible-light CO2 reduction efficiency of Mo–IOOH/IOH-20 (17.51 μmol g−1 h−1 for CO and 14.79 μmol g−1 h−1 for CH4) is much higher than that of InOOH (2.26 μmol g−1 h−1 for CO and 1.33 μmol g−1 h−1 for CH4), and the evolution rate of CO and CH4 was increased by ∼8 times and ∼11 times, respectively. The results of XPS characterization and charge density difference obtained by DFT calculation show that the charge density around the atoms in the In(OH)3 phase is increased and the charge density around the atoms in the InOOH phase is decreased, implying that electrons can be transferred from InOOH to In(OH)3. In brief, not only the Mo impurity energy levels, O defect energy levels, and surface atoms exist in the InOOH phase, but also the In defect energy levels exist in the In(OH)3 phase, which works together to act as electron transfer ladder, thereby promoting the efficiency of charge separation and transfer between heterogeneous interfaces and enhancing the CO2 photoreduction efficiency. This work provides a new way for the rational design of CO2 photoreduction catalysts with high catalytic activity.Author contributions
Guoyang Gao: experimental, conceptualization, methodology, formal analysis, investigation, data curation, writing – original draft. Qiuye Wang: experimental, formal analysis. Peifen Zhu: conceptualization, methodology, formal analysis, data curation, writing – review and editing, resources, software. Hongyang Zhu: formal analysis, writing – review and editing, resources. Yang Qu: methodology, formal analysis, writing – review and editing. Guofeng Wang: conceptualization, methodology, formal analysis, investigation, writing – review and editing, supervision, resources.Conflicts of interest
There are no conflicts to declare.Acknowledgements
This work was supported by the National Natural Science Foundation of China (No. 21871079 and 11774128), the Natural Science Foundation of Shandong Province (ZR2018JL003, 2019KJJ003), and the National Science Foundation (No. 1945558). Some of the computing for this project was performed at the ORU Research Computing and Analytics facility (ORCA) at Oral Roberts University. ORCA Director Stephen Wheat provided valuable technical expertise.Notes and references
- M. Aresta, A. Dibenedetto and A. Angelini, Chem. Rev., 2014, 114, 1709–1742 CrossRef CAS PubMed.
- S. E. Tanzer and A. Ramírez, Energy Environ. Sci., 2019, 12, 1210–1218 RSC.
- J. Li, H. Huang, W. Xue, K. Sun, X. Song, C. Wu, L. Nie, Y. Li, C. Liu, Y. Pan, H.-L. Jiang, D. Mei and C. Zhong, Nat. Catal., 2021, 4, 719–729 CrossRef CAS.
- Y. Zhang, B. Xia, J. Ran, K. Davey and S. Z. Qiao, Adv. Energy Mater., 2020, 10, 1903879 CrossRef CAS.
- C. Zhao, X. Dai, T. Yao, W. Chen, X. Wang, J. Wang, J. Yang, S. Wei, Y. Wu and Y. Li, J. Am. Chem. Soc., 2017, 139, 8078–8081 CrossRef CAS PubMed.
- Z.-K. Xin, Y.-J. Gao, Y. Gao, H.-W. Song, J. Zhao, F. Fan, A.-D. Xia, X.-B. Li, C.-H. Tung and L.-Z. Wu, Adv. Mater., 2022, 34, 2106662 CrossRef CAS PubMed.
- R. Zhao, P. Ding, P. Wei, L. Zhang, Q. Liu, Y. Luo, T. Li, S. Lu, X. Shi, S. Gao, A. M. Asiri, Z. Wang and X. Sun, Adv. Funct. Mater., 2021, 31, 2009449 CrossRef CAS.
- Y. Wang, S. Wang, S. L. Zhang and X. W. Lou, Angew. Chem., Int. Ed., 2020, 59, 11918–11922 CrossRef CAS.
- L. Shi, X. Ren, Q. Wang, W. Zhou and J. Ye, J. Mater. Chem. A, 2021, 9, 2421–2428 RSC.
- Y. Hu, F. Zhan, Q. Wang, Y. Sun, C. Yu, X. Zhao, H. Wang, R. Long, G. Zhang, C. Gao, W. Zhang, J. Jiang, Y. Tao and Y. Xiong, J. Am. Chem. Soc., 2020, 142, 5618–5626 CrossRef CAS PubMed.
- N. Zhang, X. Zhang, L. Tao, P. Jiang, C. Ye, R. Lin, Z. Huang, A. Li, D. Pang, H. Yan, Y. Wang, P. Xu, S. An, Q. Zhang, L. Liu, S. Du, X. Han, D. Wang and Y. Li, Angew. Chem., Int. Ed., 2021, 60, 6170–6176 CrossRef CAS.
- D. Yang, S. Zuo, H. Yang, Y. Zhou, Q. Lu and X. Wang, Adv. Mater., 2022, 34, 2107293 CrossRef CAS PubMed.
- T. Ouyang, S. Huang, X.-T. Wang and Z.-Q. Liu, Chem. –Eur. J., 2020, 26, 14024–14035 CrossRef CAS PubMed.
- X. Shi, X. a. Dong, Y. He, P. Yan, S. Zhang and F. Dong, ACS Catal., 2022, 12, 3965–3973 CrossRef CAS.
- X. Jiao, K. Zheng, Z. Hu, Y. Sun and Y. Xie, ACS Cent. Sci., 2020, 6, 653–660 CrossRef CAS PubMed.
- L. Wan, Q. Zhou, X. Wang, T. E. Wood, L. Wang, P. N. Duchesne, J. Guo, X. Yan, M. Xia, Y. F. Li, A. A. Jelle, U. Ulmer, J. Jia, T. Li, W. Sun and G. A. Ozin, Nat. Catal., 2019, 2, 889–898 CrossRef CAS.
- X. Xiong, C. Mao, Z. Yang, Q. Zhang, G. I. N. Waterhouse, L. Gu and T. Zhang, Adv. Energy Mater., 2020, 10, 2002928 CrossRef CAS.
- Q. Chen, G. Gao, Y. Zhang, Y. li, H. Zhu, P. Zhu, Y. Qu, G. Wang and W. Qin, J. Mater. Chem. A, 2021, 9, 15820–15826 RSC.
- S. Ji, Y. Qu, T. Wang, Y. Chen, G. Wang, X. Li, J. Dong, Q. Chen, W. Zhang, Z. Zhang, S. Liang, R. Yu, Y. Wang, D. Wang and Y. Li, Angew. Chem., Int. Ed., 2020, 59, 10651–10657 CrossRef CAS PubMed.
- J. Yang, Z. Wang, J. Jiang, W. Chen, F. Liao, X. Ge, X. Zhou, M. Chen, R. Li, Z. Xue, G. Wang, X. Duan, G. Zhang, Y.-G. Wang and Y. Wu, Nano Energy, 2020, 76, 105059 CrossRef CAS.
- X.-K. Wang, J. Liu, L. Zhang, L.-Z. Dong, S.-L. Li, Y.-H. Kan, D.-S. Li and Y.-Q. Lan, ACS Catal., 2019, 9, 1726–1732 CrossRef CAS.
- Y.-N. Gong, B.-Z. Shao, J.-H. Mei, W. Yang, D.-C. Zhong and T.-B. Lu, Nano Res., 2022, 15, 551–556 CrossRef CAS.
- W.-J. Ong, L.-L. Tan, Y. H. Ng, S.-T. Yong and S.-P. Chai, Chem. Rev., 2016, 116, 7159–7329 CrossRef CAS.
- F.-Y. Fu, I. Shown, C.-S. Li, P. Raghunath, T.-Y. Lin, T. Billo, H.-L. Wu, C.-I. Wu, P.-W. Chung, M.-C. Lin, L.-C. Chen and K.-H. Chen, ACS Appl. Mater. Interfaces, 2019, 11, 25186–25194 CrossRef CAS PubMed.
- W. Zhang, H. He, H. Li, L. Duan, L. Zu, Y. Zhai, W. Li, L. Wang, H. Fu and D. Zhao, Adv. Energy Mater., 2021, 11, 2003303 CrossRef CAS.
- Y. Zhao, Z. Han, G. Gao, W. Zhang, Y. Qu, H. Zhu, P. Zhu and G. Wang, Adv. Funct. Mater., 2021, 31, 2104976 CrossRef CAS.
- W. Jiang, D. Qu, L. An, X. Gao, Y. Wen, X. Wang and Z. Sun, J. Mater. Chem. A, 2019, 7, 18348–18356 RSC.
- X. Yue, L. Cheng, J. Fan and Q. Xiang, Appl. Catal., B, 2022, 304, 120979 CrossRef CAS.
- C. Kim, K. M. Cho, A. Al-Saggaf, I. Gereige and H.-T. Jung, ACS Catal., 2018, 8, 4170–4177 CrossRef CAS.
- S. Ji, Y. Chen, X. Wang, Z. Zhang, D. Wang and Y. Li, Chem. Rev., 2020, 120, 11900–11955 CrossRef CAS PubMed.
- J.-C. Liu, Y.-G. Wang and J. Li, J. Am. Chem. Soc., 2017, 139, 6190–6199 CrossRef CAS.
- Z. Zhang and D. Wang, J. Mater. Chem. A, 2022, 10, 5863–5877 RSC.
- B.-H. Lee, S. Park, M. Kim, A. K. Sinha, S. C. Lee, E. Jung, W. J. Chang, K.-S. Lee, J. H. Kim, S.-P. Cho, H. Kim, K. T. Nam and T. Hyeon, Nat. Mater., 2019, 18, 620–626 CrossRef CAS.
- P. Zhou, Q. Zhang, Y. Chao, L. Wang, Y. Li, H. Chen, L. Gu and S. Guo, Chem, 2021, 7, 1033–1049 CAS.
- L. Jiang, J. Li, Y. Li, X. Wu and G. Zhang, Appl. Catal., B, 2021, 294, 120249 CrossRef CAS.
- Q. Li, S. Wang, Z. Sun, Q. Tang, Y. Liu, L. Wang, H. Wang and Z. Wu, Nano Res., 2019, 12, 2749–2759 CrossRef CAS.
- W. Gao, S. Li, H. He, X. Li, Z. Cheng, Y. Yang, J. Wang, Q. Shen, X. Wang, Y. Xiong, Y. Zhou and Z. Zou, Nat. Commun., 2021, 12, 4747 CrossRef CAS PubMed.
- L. Hao, H. Huang, Y. Zhang and T. Ma, Adv. Funct. Mater., 2021, 31, 2100919 CrossRef CAS.
- P. Yang, H. Zhuzhang, R. Wang, W. Lin and X. Wang, Angew. Chem., Int. Ed., 2019, 58, 1134–1137 CrossRef CAS PubMed.
- S. He, C. Yan, X.-Z. Chen, Z. Wang, T. Ouyang, M.-L. Guo and Z.-Q. Liu, Appl. Catal., B, 2020, 276, 119138 CrossRef CAS.
- Y. Wang, X. Shang, J. Shen, Z. Zhang, D. Wang, J. Lin, J. C. S. Wu, X. Fu, X. Wang and C. Li, Nat. Commun., 2020, 11, 3043 CrossRef CAS PubMed.
- L. Wang, B. Cheng, L. Zhang and J. Yu, Small, 2021, 17, 2103447 CrossRef CAS PubMed.
- S. Huang, T. Ouyang, B.-F. Zheng, M. Dan and Z.-Q. Liu, Angew. Chem., Int. Ed., 2021, 60, 9546–9552 CrossRef CAS PubMed.
- V. Shanmuganathan, J. Santhosh Kumar, R. Pachaiappan and P. Thangadurai, Nanoscale Adv., 2021, 3, 471–485 RSC.
- J. Fan, M. Zuo, Z. Ding, Z. Zhao, J. Liu and B. Sun, Chem. Eng. J., 2020, 396, 125263 CrossRef CAS.
- H. Zhao, W. Yin, M. Zhao, Y. Song and H. Yang, Appl. Catal., B, 2013, 130–131, 178–186 CrossRef CAS.
- D. Dobrovolskas, A. Kadys, A. Usikov, T. Malinauskas, K. Badokas, I. Ignatjev, S. Lebedev, A. Lebedev, Y. Makarov and G. Tamulaitis, J. Lumin., 2021, 232, 117878 CrossRef CAS.
- B. Hu, M. Hu, Q. Guo, K. Wang and X. Wang, Appl. Catal., B, 2019, 253, 77–87 CrossRef CAS.
- J. Li, K. Li, B. Lei, M. Ran, Y. Sun, Y. Zhang, K.-H. Kim and F. Dong, Chem. Eng. J., 2021, 413, 127389 CrossRef CAS.
- Z. Wan, M. Hu, B. Hu, T. Yan, K. Wang and X. Wang, Catal. Sci. Technol., 2020, 10, 2893–2904 RSC.
- Z. Li, Z. Xie, Y. Zhang, L. Wu, X. Wang and X. Fu, J. Phys. Chem. C, 2007, 111, 18348–18352 CrossRef CAS.
- Y. Zhuang and J. Luan, Chem. Eng. J., 2020, 382, 122770 CrossRef CAS.
- J. Yin and H. Cao, Inorg. Chem., 2012, 51, 6529–6536 CrossRef CAS PubMed.
- X. Xu and X. Wang, Inorg. Chem., 2009, 48, 3890–3895 CrossRef CAS PubMed.
- J. Bian, Z. Zhang, J. Feng, M. Thangamuthu, F. Yang, L. Sun, Z. Li, Y. Qu, D. Tang, Z. Lin, F. Bai, J. Tang and L. Jing, Angew. Chem., Int. Ed., 2021, 60, 20906–20914 CrossRef CAS PubMed.
Footnote |
| † Electronic supplementary information (ESI) available. See https://doi.org/10.1039/d2ta02904a |
| This journal is © The Royal Society of Chemistry 2022 |

