Synthesis and SERS application of gold and iron oxide functionalized bacterial cellulose nanocrystals (Au@Fe3O4@BCNCs)†
Seju
Kang‡
 ab,
Asifur
Rahman‡
 ab,
Ethan
Boeding
ab and
Peter J.
Vikesland
 *ab
*ab
aDepartment of Civil and Environmental Engineering, Virginia Tech, Blacksburg, Virginia, USA. E-mail: pvikes@vt.edu
bVirginia Tech Institute of Critical Technology and Applied Science (ICTAS) Sustainable Nanotechnology Center (VTSuN), Blacksburg, Virginia, USA
First published on 2nd June 2020
Abstract
Bacterial cellulose nanocrystals (BCNCs) are biocompatible cellulose nanomaterials that can host guest nanoparticles to form hybrid nanocomposites with a wide range of applications. Herein, we report the synthesis of a hybrid nanocomposite that consists of plasmonic gold nanoparticles (AuNPs) and superparamagnetic iron oxide (Fe3O4) nanoparticles supported on BCNCs. As a proof of concept, the hybrid nanocomposites were employed to isolate and detect malachite green isothiocyanate (MGITC) via magnetic separation and surface-enhanced Raman scattering (SERS). Different initial gold precursor (Au3+) concentrations altered the size and morphology of the AuNPs formed on the nanocomposites. The use of 5 and 10 mM Au3+ led to a heterogenous mix of spherical and nanoplate AuNPs with increased SERS enhancements, as compared to the more uniform AuNPs formed using 1 mM Au3+. Rapid and sensitive detection of MGITC at concentrations as low as 10−10 M was achieved. The SERS intensity of the normalized Raman peak at 1175 cm−1 exhibited a log-linear relationship for MGITC concentrations between 2 × 10⁻¹⁰ and 2 × 10⁻⁵ M for Au@Fe3O4@BCNCs. These results suggest the potential of these hybrid nanocomposites for application in a broad range of analyte detection strategies.
Introduction
Bacterial cellulose (BC) is a cellulose nanomaterial synthesized by a number of bacterial species (i.e., Achromobacter, Alcaligenes, and Gluconacetobacter xylinus) in liquid culture media.1–3 Due to its facile synthesis and biocompatibility, BC has great potential for environmental, biomedical, and drug delivery applications.4–7 Hydroxyl groups on the BC surface enable attachment of diverse types of nanoparticles and production of BC-based nanocomposites. BC substrates can be functionalized with iron oxide (Fe3O4) nanoparticles due to their high reactivity and capacity for magnetic separation.8–10 The facile synthesis and surface functionalization of BC with Fe3O4 nanoparticles enables catalytic, biomedical, drug delivery and magnetic resonance imaging (MRI) applications.11,12 In addition, gold nanoparticle (AuNP) functionalized BCs have potential applications as biosensors. AuNPs can be synthesized and deposited onto BC substrates for analyte detection.3,13 Adjacent plasmonic metal nanoparticles with nano-sized gaps enhance inelastic Raman scattering signals due to the localized surface plasmon resonance effect – this phenomenon makes surface-enhanced Raman spectroscopy (SERS) possible.14,15 The high Raman enhancement factors (104 to 1012) of SERS makes it a promising technique for highly sensitive detection (<ng L−1).16,17 The development of SERS substrates to optimize the Raman signal is a highly interesting and active research area. Colloidal nanoparticles immobilized on cellulose substrates are of growing interest because of the cost-effective preparation and scalability of the approach.3,18,19Following strong acid hydrolysis of BC, bulk cellulose can be converted into highly crystalline cellulose fragments commonly referred to as bacterial cellulose nanocrystals (BCNCs).20 The use of BCNCs is advantageous due to their high specific surface area, colloidal and thermal stability, high tensile strength, and nanometric dispersity.2,21,22 In a recent study, cationic BCNCs coated by amines and amine-containing polymers were developed as nucleic acid nanocarriers.23 Recently researchers developed hydroxypropyl methylcellulose combined with BCNCs and silver nanoparticles to improve the tensile strength of a product potentially useful to the food packaging industry.24
In this study, we report the facile synthesis of hybrid BCNC-based nanocomposites coated with AuNPs and Fe3O4 nanoparticles (Au@Fe3O4@BCNCs). Fe3O4 nanoparticles were synthesized from an iron precursor dissolved in BCNC suspension and immobilized in situ onto the BCNCs to form Fe3O4 nanoparticle coated BCNCs (Fe3O4@BCNCs). This step was followed by the in situ reduction of Au3+ in the presence of Fe3O4@BCNCs to produce Au@Fe3O4@BCNCs. Previously, Au and Fe3O4 nanoparticles were combined in Au shell–Fe3O4 core materials and Au–Fe heterodimers for application in target molecule binding and detection through optical SERS sensing.25,26 The production of core–shell nanoparticles exhibits many challenges such as the poor diffusion barrier of the core layer due to shell formation, difficulties in controlling the uniformity and thickness of the shell coating, and atomic lattice mismatches between the core and shell components.25,27,28 BCNCs can potentially be used as alternative substrates that can readily bind to guest metals such as Au and Fe3O4 nanoparticles through C![[double bond, length as m-dash]](https://www.rsc.org/images/entities/char_e001.gif) O–metal binding or electrostatic interactions.4,21 Fe3O4@BCNCs can be quickly separated from suspension and can be used to concentrate target molecules using an external magnetic field. Furthermore, Fe3O4 nanoparticles can be easily detached from BCNCs following strong acid treatment and the BCNCs can then be re-functionalized, making them environmentally friendly. The Fe3O4@BCNCs can be further functionalized with AuNPs to utilize the biocompatibility and plasmonic nature of AuNPs. The Au@Fe3O4@BCNC platform combines the magnetic separation capability of Fe3O4 nanoparticles and SERS-active AuNPs for interaction with and SERS detection of organic molecules (Scheme 1).
O–metal binding or electrostatic interactions.4,21 Fe3O4@BCNCs can be quickly separated from suspension and can be used to concentrate target molecules using an external magnetic field. Furthermore, Fe3O4 nanoparticles can be easily detached from BCNCs following strong acid treatment and the BCNCs can then be re-functionalized, making them environmentally friendly. The Fe3O4@BCNCs can be further functionalized with AuNPs to utilize the biocompatibility and plasmonic nature of AuNPs. The Au@Fe3O4@BCNC platform combines the magnetic separation capability of Fe3O4 nanoparticles and SERS-active AuNPs for interaction with and SERS detection of organic molecules (Scheme 1).
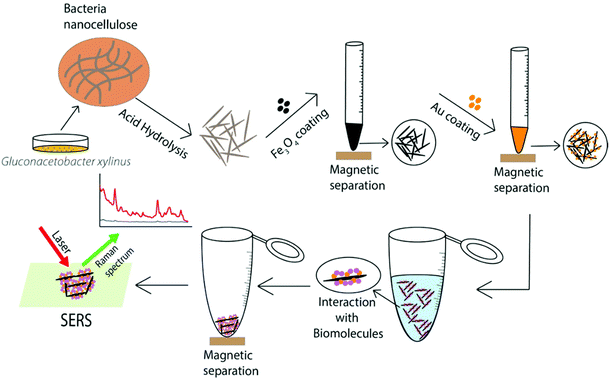 | ||
| Scheme 1 Schematic illustration of synthesis, functionalization, and SERS application of the Au@Fe3O4@BCNCs. | ||
The hybrid BCNC-based nanocomposites developed in this study were comprehensively characterized using transmission electron microscopy (TEM), scanning electron microscopy (SEM) and electrophoretic mobility measurements. As a proof-of-concept, we investigated the efficacy of the nanocomposites for the detection of malachite green isothiocyanate (MGITC) by SERS with different initial concentrations of Au3+ for functionalization.
Materials and methods
Materials
Gold chloride trihydrate (HAuCl4·3H2O, ≥99.9%), sodium citrate tribasic dihydrate (Na3Cit·2H2O, ≥99.0%), fructose, yeast extract, calcium carbonate (CaCO3, Reagent Plus), ammonium hydroxide (NH3OH, ACS Reagent, 28–30% NH3 basis), and iron(II) chloride (98%) were obtained from Sigma-Aldrich (St Louis, MO, USA). Sodium hydroxide (NaOH, certified ACS), hydrochloric acid (HCl, certified ACS plus), ferric chloride hexahydrate (FeCl3·6H2O, certified ACS) and malachite green isothiocyanate (MGITC) were purchased from Thermo Fisher Scientific (Hampton, NH, USA). Deionized (DI) water was ultrapure with ≥18 MΩ cm resistance.Synthesis of BC pellicles followed by BCNC preparation
BC pellicles in Petri dishes were synthesized following a published approach with minor revision.3 The cellulose-producing bacterial strain Gluconacetobacter xylinus (G. xylinus) was used to produce the BC pellicles. Prior to inoculating with G. xylinus, all media was autoclaved at 121 °C and 15 psi for 20 min. Approximately 10 mL aliquots of ATCC medium 459 (10 g fructose, 1 g yeast extract, and 2.5 g CaCO3 in 200 mL of DI water) were poured into 100 mm diameter, 15 mm deep Petri dishes. One or two visible G. xylinus colonies that had formed on nutrient agar were scooped and inoculated into each ATCC medium. This inoculated medium was quiescently stored in a 303 K oven for five days. After five days of incubation, hydrogel-like BC pellicles were generated. These pellicles were removed and rinsed using tap water to remove residual bacterial cells and nutrients. Following this cleaning, the BC pellicles were immersed in 0.1 M NaOH and stirred for three days to remove remaining residuals and hinder additional cellulose production. The cleaned BC pellicles were stored in DI water at room temperature until use.To prepare a BCNC suspension, a single piece of BC pellicle was hydrolyzed with 10–15 mL of 37% (w/w) HCl solution at 80 °C for 3.5 hours under continuous stirring. The acid hydrolysis reaction was then terminated and 40 mL of DI water was added to the reaction flask. The resulting cloudy and acidic BCNC suspension was centrifuged at 4000 rpm for 30 min. After centrifugation, the sediment was collected and re-suspended in DI water. This cycle was repeated until the pH of the BCNC suspension was between 6 and 7.
Functionalization with Fe3O4 nanoparticles and AuNPs
The BCNCs were centrifuged and mixed in 20 mL of DI water containing FeCl3·6H2O and FeCl2 in a 2![[thin space (1/6-em)]](https://www.rsc.org/images/entities/char_2009.gif) :
:![[thin space (1/6-em)]](https://www.rsc.org/images/entities/char_2009.gif) 1 molar ratio. The mixture was transferred to a round bottom flask and was purged with N2 gas for 1 hour while being magnetically stirred at 600 rpm. The suspension was then heated to 80 °C in a silicone oil bath and 5 mL of NH4OH (28–30%) was added dropwise using a syringe. Upon addition of NH4OH, the color of the suspension changed from orange/yellow to black, which indicated the attachment of Fe3O4 nanoparticles onto the BCNCs. The suspension was stirred for 30 min and then cooled to room temperature. The cooled suspension was diluted to 50 mL in DI water and was repeatedly washed and magnetically separated until excess Fe3O4 nanoparticles were fully removed. These magnetic separations were performed using a neodymium disc magnet (N52, 40 × 20 mm). Finally, the Fe3O4@BCNCs were stored in 50 mL of DI water.
1 molar ratio. The mixture was transferred to a round bottom flask and was purged with N2 gas for 1 hour while being magnetically stirred at 600 rpm. The suspension was then heated to 80 °C in a silicone oil bath and 5 mL of NH4OH (28–30%) was added dropwise using a syringe. Upon addition of NH4OH, the color of the suspension changed from orange/yellow to black, which indicated the attachment of Fe3O4 nanoparticles onto the BCNCs. The suspension was stirred for 30 min and then cooled to room temperature. The cooled suspension was diluted to 50 mL in DI water and was repeatedly washed and magnetically separated until excess Fe3O4 nanoparticles were fully removed. These magnetic separations were performed using a neodymium disc magnet (N52, 40 × 20 mm). Finally, the Fe3O4@BCNCs were stored in 50 mL of DI water.
To functionalize Fe3O4@BCNCs with AuNPs, 5 mL aliquots of Fe3O4@BCNC suspension were transferred into a conical tube. A magnetic field was applied to separate the nanocomposites. The supernatant was decanted and replaced with a fixed 5 mL volume of either 1, 5, or 10 mM HAuCl4. To accelerate the reduction of Au3+ to AuNPs, Na3Cit was added as a reducing agent. For each HAuCl4 concentration, small aliquots of Na3Cit (∼200 μL) were added into the samples at a 1![[thin space (1/6-em)]](https://www.rsc.org/images/entities/char_2009.gif) :
:![[thin space (1/6-em)]](https://www.rsc.org/images/entities/char_2009.gif) 1 molar ratio of HAuCl4 and Na3Cit. The samples were then incubated at 303 K overnight. The yellow Au3+ suspension rapidly changed to brown indicating the reduction of Au3+ to AuNP. The samples were repeatedly washed with DI water by magnetic separation and re-suspension until the supernatant became transparent indicating the removal of non-deposited AuNPs.
1 molar ratio of HAuCl4 and Na3Cit. The samples were then incubated at 303 K overnight. The yellow Au3+ suspension rapidly changed to brown indicating the reduction of Au3+ to AuNP. The samples were repeatedly washed with DI water by magnetic separation and re-suspension until the supernatant became transparent indicating the removal of non-deposited AuNPs.
Characterization of the Au@Fe3O4@BCNCs
TEM was used to observe the morphology of the BCNCs, Fe3O4@BCNCs, and Au@Fe3O4@BCNCs. The as-synthesized BCNC suspension [(∼0.01% (w/v)] was deposited on a carbon mesh 200 grid (Ted Pella, Inc.; Redding, CA), dried, and negatively stained with 2% uranyl acetate solution. The Fe3O4@BCNCs and Au@Fe3O4@BCNCs were diluted 10× and 10 μL of each sample was deposited onto the TEM grid without staining because negative staining can affect the imaging of Au and Fe3O4. TEM analysis was conducted using a field emission gun instrument (JEOL 2100) operating at an accelerating voltage of 200 kV. Nanoparticle sizes in each sample were determined (n = 50) using ImageJ software. The morphologies of AuNPs on the Au@Fe3O4@BCNCs were characterized using a field-emission Quanta 600 FEG environmental SEM. Secondary electron (InLens detector) mode was used to obtain contrast between aggregated BCNCs and AuNPs, while backscattered electron (RBSD detector) mode was used for energy dispersive spectroscopy (EDS) mapping and analysis. To compare the surface charge and stability of the different nanocomposites, electrophoretic mobility (UE, m2 V−1 s−1) was measured using a Zetasizer Nano DLS (Malvern Nano ZS, Malvern, UK). UE indicates particle response to an applied electric field and is measured by Doppler frequency shifts in scattered light.Proof-of-concept SERS application of the Au@Fe3O4@BCNCs
For the detection experiment, MGITC was selected because it has a large Raman cross-section and high affinity to the AuNP surface due to its thiol group.29,30 In a 2 mL tube, different concentrations of 500 μL MGITC solution were added into 500 μL of Au@Fe3O4@BCNC suspension. Following 3–4 hours of incubation at room temperature, the nanocomposites were magnetically separated and the supernatant was decanted. A preliminary test of sorption kinetics for MGITC was conducted by using the UV-Vis spectrophotometer. This test indicated that sorption reached equilibrium approximately within 2 hours (Fig. S1†). The residue was re-suspended using 10 μL of DI water and pipetted onto a glass slide. Raman spectra were collected using a WITec alpha500R Raman spectrometer (WITec GmbH, Ulm, Germany, spectral resolution = ∼3.5 cm−1), with a 785 nm laser (5 mW intensity) and a 10× confocal microscope objective. The signal was collected using a Peltier cooled charge-coupled device (CCD) with 300 Groves per mm grating set. For each sample, a total of 20 × 20 points (X × Y) were acquired across a 10 × 10 μm2 area with 0.1 s integration time for each point.SERS data analysis
For the collected Raman spectra, the baselines were corrected using an asymmetric least square smoothing method coded through Mathworks MATLAB/SIMULINK software (ver. R2019b). After baseline correction, the Raman intensities of the peaks of interest at 1175 and 77 cm−1 (I1175 and I77) were extracted and the intensity ratio of the peaks (I1175/I77) was plotted against the logarithm of MGITC concentrations.To calculate the limit of detection (LOD) of the Au@Fe3O4@BCNCs, the best-fit regression line was determined as follows:
I1175/I77 = â![[thin space (1/6-em)]](https://www.rsc.org/images/entities/char_2009.gif) log log![[thin space (1/6-em)]](https://www.rsc.org/images/entities/char_2009.gif) C + C + ![[b with combining circumflex]](https://www.rsc.org/images/entities/i_char_0062_0302.gif) |
![[b with combining circumflex]](https://www.rsc.org/images/entities/i_char_0062_0302.gif) are the slope and y intercept of the regression line. The LOD was calculated using the following the equation,
are the slope and y intercept of the regression line. The LOD was calculated using the following the equation,log![[thin space (1/6-em)]](https://www.rsc.org/images/entities/char_2009.gif) LOD = (3σâ − LOD = (3σâ − ![[b with combining circumflex]](https://www.rsc.org/images/entities/i_char_0062_0302.gif) )/â )/â |
Results and discussion
Synthesis and characterization of the nanocomposites
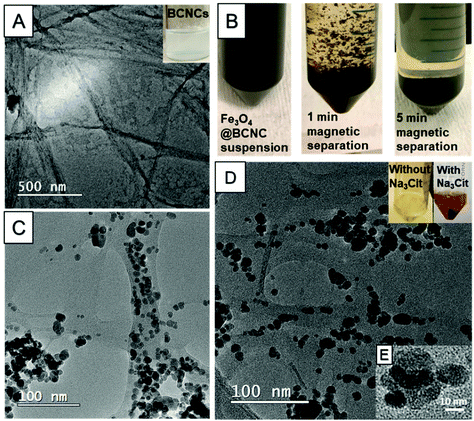
TEM images of the as-synthesized BCNCs revealed rod or needle shaped structures 30–40 nm in width and 400–800 nm in length (Fig. 1A). We did not perform post-treatment steps such as dialysis or filtration on the BCNC samples and this explains the presence of some impurities in the sample. The morphologies of the HCl-hydrolyzed BCNCs in this study are similar to those reported previously by Singhsa et al.23 HCl-hydrolysis has been reported to produce cellulose nanocrystals (CNCs) in greater yield and larger dimensions relative to H2SO4-hydrolysis.23,31 Given that the charged SO42− groups from H2SO4 can compromise the thermostability of the nanocrystals, HCl is thought to better optimize the CNC hydrolysis conditions.31,32The Fe3O4@BCNCs were prepared by the in situ synthesis of Fe3O4 nanoparticles on the BCNCs. Upon attachment of Fe3O4 nanoparticles, the Fe precursor/BCNC solution turned black indicating the formation of Fe3O4 nanoparticles. Following synthesis, the Fe3O4@BCNCs could be completely separated from suspension within 5 min using a magnetic field (40 × 20 mm N52 neodymium disc magnet) (Fig. 1B). AuNP functionalization of Fe3O4@BCNCs was done by the in situ reduction of Au3+ using Na3Cit as reducing agent. Na3Cit is a widely used reducing agent that accelerates AuNP formation.3,33 Upon AuNP formation, the color of the Au@Fe3O4@BCNC suspension changed from black to dark brown suggesting a higher reduction capacity of Na3Cit compared to the BCNC-OH surface functional groups as reported previously (Fig. 1D).3
FT-IR analysis of the BCNCs, BCNCs with Fe precursor, Fe3O4@BCNCs and Au@Fe3O4@BCNCs were performed to analyze the nature of the chemical bonding of BCNCs with nanoparticles. In the presence of Fe precursors and after Fe3O4 nanoparticle formation via Fe reduction, the peak at around 3340 cm−1 (BCNC-OH group) did not show any major shift (Fig. S2A†). This result suggests limited Fe–OH binding to the BCNC surface and an apparent electrostatic interaction between the –OH and Fe+3 seems to govern the interactions between BCNC-OH and Fe3O4 nanoparticles.21,34,35 FT-IR spectra of the Au@Fe3O4@BCNCs had similar peaks to the uncoated BCNC sample. All samples had characteristic FT-IR peaks at 3345 cm−1, the O–H stretching vibration, and at 1640 cm−1, attributed to –OH groups of adsorbed water (Fig. S2†).21,36 Other identified peaks were at 2896 cm−1 (C–H stretching) and 1060–1162 cm−1 (C–O and C–O–C stretching bonds in BCNC), suggesting no significant degradation of the BCNCs during Au and Fe3O4 functionalization (Fig. S2†).
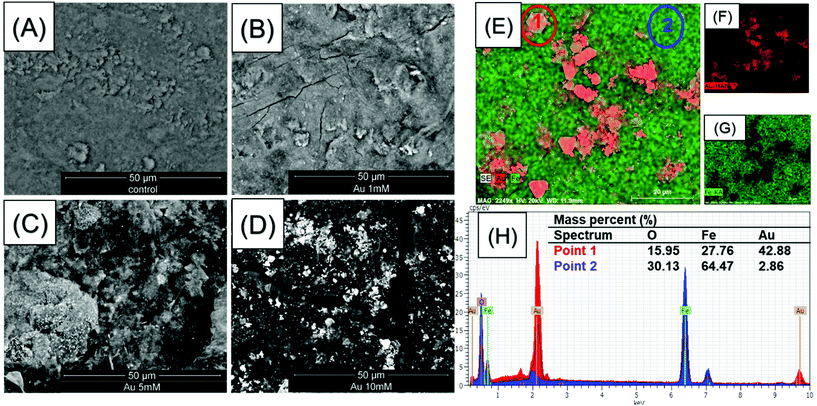
The morphologies of the nanoparticles within the Fe3O4@BCNCs and the Au@Fe3O4@BCNCs were characterized using TEM. Fig. 1C and D show the typical morphology of the Fe3O4@BCNCs and the 5 mM Au@ Fe3O4@BCNCs nanocomposites, with Au typically showing higher contrast (Fig. 1E). The as-synthesized BCNCs were stained with 2% uranyl acetate before TEM imaging and hence showed higher contrast (Fig. 1A) compared to the unstained Au and Fe3O4 functionalized BCNCs (Fig. 1C and D). The average nanoparticle diameter in the Fe3O4@BCNC samples was 9.43 ± 3.45 nm (n = 50). After treatment with 5 mM Au3+, the average nanoparticle size increased to 11.75 ± 2.4 nm (n = 50). To better differentiate between the Au and Fe3O4 nanoparticles, we performed backscattered electron imaging and EDS analysis on magnetically separated and aggregated BCNC samples. As shown in Fig. 2(A–D), backscattered SEM images revealed an increased presence of Au on the aggregated Fe3O4@BCNC surface with an increase in initial Au precursor loading. An increase in the initial Au3+ concentration, from 1 to 5 mM caused formation of increased numbers of dispersed AuNPs. A further increase in Au3+ concentration to 10 mM caused the scattered formation of aggregated AuNPs and Au nanoplates. Previously, Wei et al. observed Au nanoplate formation in AuNP coated BC substrates with Au3+ concentrations of 10 mM or higher.3 In addition, EDS mapping of the aggregated 10 mM Au@Fe3O4@BCNC sample (Fig. 2E–G) suggested plate-like AuNPs. EDS spectra (Fig. 2H) of an AuNP nanoplate (Fig. 2E, point 1) showed a higher mass percent (42.88%) of Au compared to Au (2.86 mass %) directly associated with Fe3O4 nanoparticles (Fig. 2E, point 2).
Magnetic separation of the Au@Fe3O4@BCNCs in suspension induces nanocomposite aggregation, which can potentially form aggregated structures (Fig. 2E). Aggregated AuNPs and Au nanoplates are typically characterized by strong SERS enhancements.3,37,38 Magnet induced aggregation has been used previously for core–shell Au@Fe3O4 nanoparticles to produce interparticle “hot-spots” that can amplify the Raman signals to achieve highly-sensitive detection.26
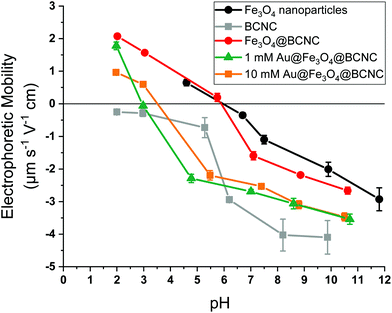
The effect of surface functionalization by Au and Fe3O4 on the electrophoretic mobility of the BCNCs is shown in Fig. 3. The pHIEP of the samples was estimated based upon where the electrophoretic mobility goes to zero as a function of solution pH in 0.01 M NaCl suspensions. HCl-hydrolyzed BCNCs exhibited a strongly negative surface potential and were stable in NaCl suspension. At higher electrolyte (NaCl) concentrations of 0.025 M or more, CNCs are reported to aggregate with a concomitant increase in hydrodynamic diameter.39 Upon functionalizing with Fe3O4 nanoparticles, the electrophoretic mobility for the Fe3O4@BCNCs was similar to that of bare Fe3O4 nanoparticles. This result contrasts with the unfunctionalized BCNCs, which showed mostly negative surface charge between pH 2 to 10. The pHIEP of the Fe3O4@BCNCs was estimated to be 5.9, similar to bare Fe3O4 nanoparticles. After functionalizing with 1 and 10 mM Au3+, the pHIEP of the nanocomposites shifted to between pH 3 and 4. Upon AuNP formation, the Au@Fe3O4@BCNCs showed negative surface charge at or above pH 4, similar to the observations in previous studies for Au nanoshell bearing cellulose nanocrystals and AuNPs.40,41 Attachment of Au and Fe3O4 nanoparticles onto the BCNCs was carefully controlled to utilize the efficiency of both the magnetic and plasmonic properties of the hybrid nanocomposites. The electrophoretic mobility measurements suggest that using the stated amount of Fe and Au precursors, the resulting nanocomposites showed charge stability in suspension and minimal aggregation at a low salt concentration of 0.01 M NaCl.
SERS detection of MGITC using the nanocomposites
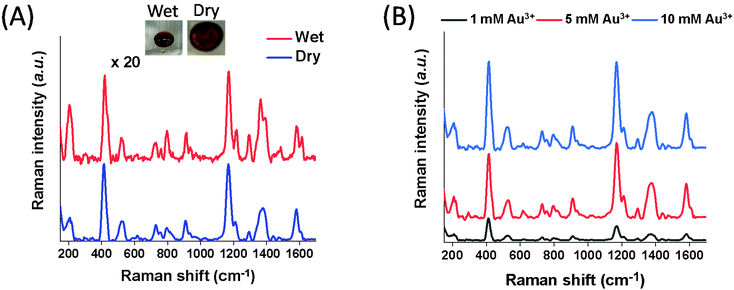
Using the Au@Fe3O4@BCNCs, SERS detection of MGITC was rapid and sensitive. Following sorption of MGITC to the nanocomposites, we readily separated the MGITC-sorbed nanocomposites from the suspension using a magnetic field. Within a few minutes, the suspension became transparent and the nanocomposites were concentrated near the magnet. Once the transparent supernatant was decanted, the nanocomposites were re-dispersed in 10 μL of DI water. After deposition of 10 μL of the droplet including the MGITC-sorbed nanocomposite onto the glass slide, we successfully collected the SERS spectra with several distinct peaks under both dry and wet conditions (Fig. 4A). The occurrence of a peak at 215 cm−1 corresponding to the Au–S bond demonstrates the successful complexation of isothiocyanate (–N![[double bond, length as m-dash]](https://www.rsc.org/images/entities/char_e001.gif) C
C![[double bond, length as m-dash]](https://www.rsc.org/images/entities/char_e001.gif) S) in MGITC to the AuNP surface.30 The most prominent peaks at 1175, 1366, and 1589 cm−1 can be assigned to the n-plane benzene ν9 mode, the aromatic ring stretching mode, and the in-plane aromatic ring stretching/bending mode, respectively.42,43 Other distinct peaks such as 914, 1296, and 1618 cm−1 arise from the B1u in-plane benzene ring mode, in-plane C–H or C–C–H bending mode, and phenyl-N stretching mode.42,43
S) in MGITC to the AuNP surface.30 The most prominent peaks at 1175, 1366, and 1589 cm−1 can be assigned to the n-plane benzene ν9 mode, the aromatic ring stretching mode, and the in-plane aromatic ring stretching/bending mode, respectively.42,43 Other distinct peaks such as 914, 1296, and 1618 cm−1 arise from the B1u in-plane benzene ring mode, in-plane C–H or C–C–H bending mode, and phenyl-N stretching mode.42,43
In Fig. 4A, insets show the pictures of the Au@Fe3O4@BCNCs in the dry and wet states. The coefficients of variance (CV) of the SERS band at 1175 cm−1 across the scanning area in both states were 13.8 and 14.0%, respectively (Fig. S3†). This result demonstrates that both conditions had low spatial variability. For the dry sample, it was quickly dried within ∼5 min in the oven at 60 °C. The collection time of the SERS spectra across a 10 μm × 10 μm area for one sample is only 40 s for 400 points in this study. The short intervals among analyte contact, sample separation, and data collection illustrate the rapid detection of MGITC using the Au@Fe3O4@BCNCs.
The overall SERS signals in a dry state were ∼20 times higher than in the wet state (Fig. 4A). After the droplet was dried, the Au@Fe3O4@BCNCs were densely packed at the edge due to the coffee ring effect and the distance between AuNPs became closer resulting in the formation of denser SERS hot-spots, especially at the edge. Additionally, we applied a magnetic field to the deposited droplet of the suspended MGITC-sorbed nanocomposites before drying to investigate if SERS intensities could be further enhanced (Fig. S4†). However, there was no significant effect on SERS enhancement, implying that the concentrated nanocomposites via the initial magnetic separation from suspension predominantly affected generation of SERS hot-spots. Hereafter, all SERS spectra were collected in the dry state due to its higher SERS enhancement.
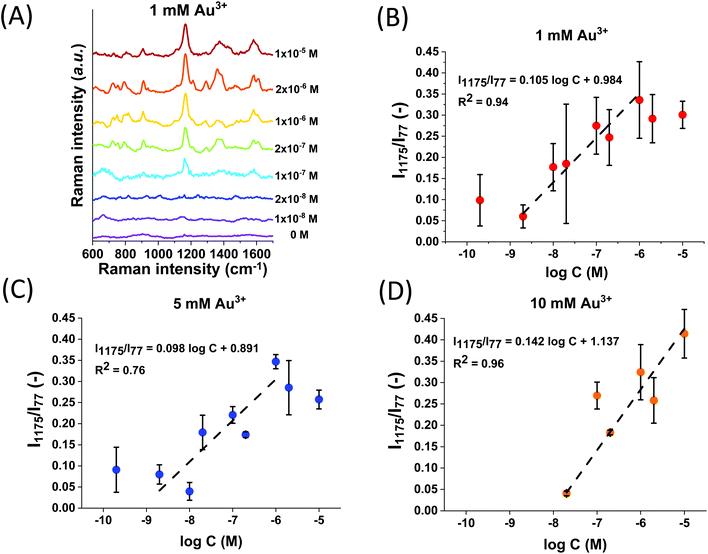
The effect of the initial concentration of Au3+ during the functionalization experiments on the SERS performance of Au@Fe3O4@BCNC was investigated. Fig. 4B shows the SERS spectra of 2 μM MGITC using Au@Fe3O4@BCNCs with different Au coating concentrations (1, 5, and 10 mM). It was observed that the peak intensities corresponding to MGITC increased with an increase in the initial concentration of Au3+. The SERS enhancement depends on the density, size, and morphology of AuNPs on the nanocomposite.3 The nanocrystals in our study provided more favorable SERS hot-spots with a higher initial concentration of Au3+. This observation may be attributed to the relatively larger size and quantity of AuNPs and formation of Au nanoplates, as observed in the SEM analysis (Fig. 2E). The heterogenous morphologies of plasmonic Au metals present on the BCNCs can potentially improve SERS enhancement.37,38
Quantification of MGITC using SERS
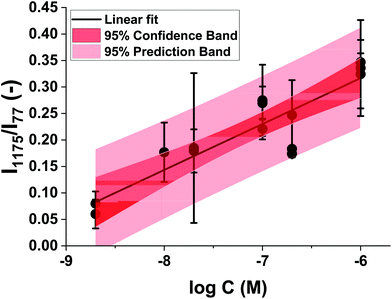
We successfully detected MGITC with concentrations ranging from 2 × 10⁻⁵ to 2 × 10⁻¹⁰ M using the Au@Fe3O4@BCNCs. However, quantification was challenging due to the large variation in the spatial arrangement of heterogenous SERS hot-spots among the batches arising from random aggregation of the nanocomposites. Therefore, we normalized the SERS hot-spots between different batches by using the intensity of the 77 cm−1 pseudo-peak (I77) as the internal standard. As discussed previously, I77 reflects elastically scattered light from the amplified spontaneous emission (ASE) of the Raman laser cut by the edge filter. In previous studies, it was reported that the density of SERS hot-spots can be reflected by the variation of I77.44–47Fig. 5A shows vertically stacked SERS spectra of different concentrations of MGITC using 1 mM Au@Fe3O4@BCNCs relative to a nanocomposite only control. All SERS spectra were averaged from 400 individual spectra and normalized by I77. It is noteworthy that the normalized intensities of the peaks were higher for higher concentrations of MGITC. For quantification, among many prominent peaks, the strongest peak at 1175 cm−1 was selected as representative.48,49 For each of the 1, 5, and 10 mM Au3+ coating conditions, the normalized Raman intensities at 1175 cm−1 (I1175/I77) were plotted against the logarithm of the MGITC concentration (Fig. 5B–D). A linear relationship between Raman intensity and the logarithm of analyte concentrations is commonly observed in quantitative analysis of plasmonic nano-substrates.50–52 We suggest that hot-spot normalized Raman intensities further enhance quantification and account for the spatial heterogeneity of AuNPs. These plots showed a clear linear trend between the two variables in a certain range with R-squared values between 0.76–0.96. The lowest intensities of MGITC-corresponding peaks were observed at ∼10−10 M for 1 and 5 mM Au@Fe3O4@BCNCs. On the other hand, no distinct peaks were detected at <10−8 M for 10 mM Au@Fe3O4@BCNCs which may be attributed to the decreased surface area of AuNP or Au nanoplate for MGITC sorption. Surprisingly, the Au@Fe3O4@BCNCs at the lower initial concentration of Au3+ tended to have a larger capacity for MGITC and ultimately higher detection sensitivity despite lower SERS enhancement. The sorption capacity of the Au@Fe3O4@BCNCs for MGITC depends on the surface area of Au regarding the strong Au–S bond between them. A higher fraction of AuNPs at the lower initial concentration of Au3+ would provide a larger Au surface area, resulting in greater sorption capacity for MGITC than plate-like Au at higher concentration.The linear regression between the normalized I1175 and the logarithm of the concentration of MGITC was evaluated for all the Au@Fe3O4@BCNCs. The range of concentrations was restricted to the range from 2 × 10⁻⁹ to 2 × 10⁻⁶ M and the data points with responses comparable to the blank were omitted. The results shown in Fig. 6 suggest that the normalized I1175 can be reasonably approximated as a linear function of the logarithm of the MGITC concentration. The two parameters were statistically correlated with an R-square value of 0.79 and the experimental data were within the 95% prediction region. Using this approach, the LOD was determined to be 5.8 × 10⁻¹⁰ M from the empirical best-fit equation (i.e., I1175/I77 = 0.837 + 0.087![[thin space (1/6-em)]](https://www.rsc.org/images/entities/char_2009.gif) log
log![[thin space (1/6-em)]](https://www.rsc.org/images/entities/char_2009.gif) C) and the standard error of the regression.53 We expect that it will be possible to further lower the LOD value by adjusting the size and morphology of AuNPs. Overall, this result demonstrates the applicability of Au@Fe3O4@BCNCs for quantitative SERS analysis.
C) and the standard error of the regression.53 We expect that it will be possible to further lower the LOD value by adjusting the size and morphology of AuNPs. Overall, this result demonstrates the applicability of Au@Fe3O4@BCNCs for quantitative SERS analysis.
We believe that tuning the Au and Fe3O4 nanoparticles in the experiment can improve the SERS performance of the Au@Fe3O4@BCNCs along with their magnetization capability in an interactive manner. In a previous study, core–shell Au-coated Fe3O4 nanoparticles showed a substantial reduction of the saturation magnetization compared to the bare Fe3O4 nanoparticles which may be attributed to the shielding effect of the Au layer on the outer side of magnetite.54 Further research on optimization of experimental functionalization conditions is required for these hybrid nanocomposites to expand their applicability.
Conclusions
In this work, BCNCs were prepared by HCl hydrolysis of BC pellicles. The hybrid BC-based nanocomposites, Au@Fe3O4@BCNCs, were prepared by the sequential in situ synthesis of Fe3O4 and AuNPs in the presence of BCNCs. The efficacy of the hybrid nanocomposites as biomolecule binding and detection agents was evaluated through SERS detection of MGITC as a proof-of-concept. The structure of the BCNCs was unaffected after functionalizing with Fe3O4 and AuNPs. The size and morphology of AuNPs on the BCNCs were affected by the initial concentration of Au3+. The formation of heterogenous mixtures of aggregated AuNPs and Au nanoplates at high Au3+ concentration could be responsible for high SERS intensity. Magnetic separation-induced generation of SERS hot-spots from the aggregated Au@Fe3O4@BCNCs had low spatial variability under both wet and dry conditions. Different concentration levels of MGITC were quantified through linear relationship between the normalized Raman peak of 1175 cm−1vs. the logarithmic concentrations of MGITC. These results suggest that the Au@Fe3O4@BCNCs used in this study have great potential for biomolecular interaction and detection with high sensitivity. Considering their facile synthesis procedure and biodegradability, the Au@Fe3O4@BCNCs can have a wide range of environmental and biological applications and expected low environmental impacts.Conflicts of interest
There are no conflicts to declare.Acknowledgements
Funding for this work was provided through US NSF grants CBET-1705653 and CBET-2029911 to P. V. Laboratory and instrumentation support was provided by NanoEarth a node of the NSF supported NNCI (NSF award number #1542100). Additional support was provided by the Sustainable Nanotechnology Interdisciplinary Graduate Program (VTSuN IGEP) funded by the Virginia Tech Graduate School. Some icons in the graphical abstract were created with BioRender.com.References
- M. Iguchi, S. Yamanaka and A. Budhiono, Bacterial cellulose—a masterpiece of nature's arts, J. Mater. Sci., 2000, 35(2), 261–270 CrossRef CAS.
- B. Thomas, M. C. Raj, J. Joy, A. Moores, G. L. Drisko and C. M. Sanchez, Nanocellulose, a versatile green platform: from biosources to materials and their applications, Chem. Rev., 2018, 118(24), 11575–11625 CrossRef CAS PubMed.
- H. Wei, K. Rodriguez, S. Renneckar, W. Leng and P. J. Vikesland, Preparation and evaluation of nanocellulose–gold nanoparticle nanocomposites for SERS applications, Analyst, 2015, 140(16), 5640–5649 RSC.
- A. W. Carpenter, C.-F. de Lannoy and M. R. Wiesner, Cellulose nanomaterials in water treatment technologies, Environ. Sci. Technol., 2015, 49(9), 5277–5287 CrossRef CAS PubMed.
- S. Ye, L. Jiang, J. Wu, C. Su, C. Huang, X. Liu and W. Shao, Flexible amoxicillin-grafted bacterial cellulose sponges for wound dressing: in vitro and in vivo evaluation, ACS Appl. Mater. Interfaces, 2018, 10(6), 5862–5870 CrossRef CAS PubMed.
- S. C. Fernandes, P. Sadocco, A. Alonso-Varona, T. Palomares, A. Eceiza, A. J. Silvestre, I. A. Mondragon and C. S. Freire, Bioinspired antimicrobial and biocompatible bacterial cellulose membranes obtained by surface functionalization with aminoalkyl groups, ACS Appl. Mater. Interfaces, 2013, 5(8), 3290–3297 CrossRef CAS PubMed.
- X. Chen, X. Xu, W. Li, B. Sun, J. Yan, C. Chen, J. Liu, J. Qian and D. Sun, Effective drug carrier based on polyethylenimine-functionalized bacterial cellulose with controllable release properties, ACS Appl. Bio Mater., 2018, 1(1), 42–50 CrossRef CAS.
- M. Echeverry-Rendon, L. M. Reece, F. Pastrana, S. L. Arias, A. R. Shetty, J. J. Pavón and J. P. Allain, Bacterial Nanocellulose Magnetically Functionalized for Neuro-Endovascular Treatment, Macromol. Biosci., 2017, 17(6), 1600382 CrossRef PubMed.
- J. Guo, I. Filpponen, L.-S. Johansson, P. Mohammadi, M. Latikka, M. B. Linder, R. H. Ras and O. J. Rojas, Complexes of magnetic nanoparticles with cellulose nanocrystals as regenerable, highly efficient, and selective platform for protein separation, Biomacromolecules, 2017, 18(3), 898–905 CrossRef CAS PubMed.
- X. Luo, X. Lei, N. Cai, X. Xie, Y. Xue and F. Yu, Removal of heavy metal ions from water by magnetic cellulose-based beads with embedded chemically modified magnetite nanoparticles and activated carbon, ACS Sustainable Chem. Eng., 2016, 4(7), 3960–3969 CrossRef CAS.
- S. Laurent, D. Forge, M. Port, A. Roch, C. Robic, L. V. Elst and R. N. Muller, Magnetic iron oxide nanoparticles: synthesis, stabilization, vectorization, physicochemical characterizations, and biological applications, Chem. Rev., 2008, 108(6), 2064–2110 CrossRef CAS PubMed.
- A. S. Teja and P.-Y. Koh, Synthesis, properties, and applications of magnetic iron oxide nanoparticles, Prog. Cryst. Growth Charact. Mater., 2009, 55(1–2), 22–45 CrossRef CAS.
- M. Park, H. Chang, D. H. Jeong and J. Hyun, Spatial deformation of nanocellulose hydrogel enhances SERS, BioChip J., 2013, 7(3), 234–241 CrossRef CAS.
- E. Petryayeva and U. J. Krull, Localized surface plasmon resonance: Nanostructures, bioassays and biosensing—A review, Anal. Chim. Acta, 2011, 706(1), 8–24 CrossRef CAS PubMed.
- A. Campion and P. Kambhampati, Surface-enhanced Raman scattering, Chem. Soc. Rev., 1998, 27(4), 241–250 RSC.
- A. M. Michaels, M. Nirmal and L. Brus, Surface enhanced Raman spectroscopy of individual rhodamine 6G molecules on large Ag nanocrystals, J. Am. Chem. Soc., 1999, 121(43), 9932–9939 CrossRef CAS.
- M. M. Carrabba, R. B. Edmonds and R. D. Rauh, Feasibility studies for the detection of organic surface and subsurface water contaminants by surface-enhanced Raman spectroscopy on silver electrodes, Anal. Chem., 1987, 59(21), 2559–2563 CrossRef CAS PubMed.
- H. Wei, K. Rodriguez, S. Renneckar and P. J. Vikesland, Environmental science and engineering applications of nanocellulose-based nanocomposites, Environ. Sci.: Nano, 2014, 1(4), 302–316 RSC.
- E. Morales-Narváez, H. Golmohammadi, T. Naghdi, H. Yousefi, U. Kostiv, D. Horak, N. Pourreza and A. Merkoçi, Nanopaper as an optical sensing platform, ACS Nano, 2015, 9(7), 7296–7305 CrossRef PubMed.
- Y. Habibi, A.-L. Goffin, N. Schiltz, E. Duquesne, P. Dubois and A. Dufresne, Bionanocomposites based on poly (ε-caprolactone)-grafted cellulose nanocrystals by ring-opening polymerization, J. Mater. Chem., 2008, 18(41), 5002–5010 RSC.
- N. Bossa, A. W. Carpenter, N. Kumar, C.-F. de Lannoy and M. Wiesner, Cellulose nanocrystal zero-valent iron nanocomposites for groundwater remediation, Environ. Sci.: Nano, 2017, 4(6), 1294–1303 RSC.
- A. Brinkmann, M. Chen, M. Couillard, Z. J. Jakubek, T. Leng and L. J. Johnston, Correlating cellulose nanocrystal particle size and surface area, Langmuir, 2016, 32(24), 6105–6114 CrossRef CAS PubMed.
- P. Singhsa, R. Narain and H. Manuspiya, Bacterial cellulose nanocrystals (BCNC) preparation and characterization from three bacterial cellulose sources and development of functionalized BCNCs as nucleic acid delivery systems, ACS Appl. Nano Mater., 2017, 1(1), 209–221 CrossRef.
- J. George, R. Kumar, V. A. Sajeevkumar, K. V. Ramana, R. Rajamanickam, V. Abhishek and S. Nadanasabapathy, Hybrid HPMC nanocomposites containing bacterial cellulose nanocrystals and silver nanoparticles, Carbohydr. Polym., 2014, 105, 285–292 CrossRef CAS PubMed.
- I. C. Chiang and D. H. Chen, Synthesis of monodisperse FeAu nanoparticles with tunable magnetic and optical properties, Adv. Funct. Mater., 2007, 17(8), 1311–1316 CrossRef CAS.
- J. Wang, X. Wu, C. Wang, Z. Rong, H. Ding, H. Li, S. Li, N. Shao, P. Dong and R. Xiao, Facile synthesis of Au-coated magnetic nanoparticles and their application in bacteria detection via a SERS method, ACS Appl. Mater. Interfaces, 2016, 8(31), 19958–19967 CrossRef CAS PubMed.
- D. Saha, K. Koga and H. Takeo, Stable icosahedral nanoparticles in an as-grown Au–Fe alloy, Eur. Phys. J. D, 1999, 9(1), 539–542 CrossRef CAS.
- D.-L. Lu, K. Domen and K.-I. Tanaka, Electrodeposited Au–Fe, Au–Ni, and Au–Co Alloy Nanoparticles from Aqueous Electrolytes, Langmuir, 2002, 18(8), 3226–3232 CrossRef CAS.
- J. Long, H. Yi, H. Li, Z. Lei and T. Yang, Reproducible ultrahigh SERS enhancement in single deterministic hotspots using nanosphere-plane antennas under radially polarized excitation, Sci. Rep., 2016, 6, 33218 CrossRef CAS PubMed.
- X. Qian, S. R. Emory and S. Nie, Anchoring molecular chromophores to colloidal gold nanocrystals: surface-enhanced Raman evidence for strong electronic coupling and irreversible structural locking, J. Am. Chem. Soc., 2012, 134(4), 2000–2003 CrossRef CAS PubMed.
- N. F. Vasconcelos, J. P. A. Feitosa, F. M. P. da Gama, J. P. S. Morais, F. K. Andrade, M. D. S. M. de Souza Filho and M. de Freitas Rosa, Bacterial cellulose nanocrystals produced under different hydrolysis conditions: properties and morphological features, Carbohydr. Polym., 2017, 155, 425–431 CrossRef CAS PubMed.
- M. Roman and W. T. Winter, Effect of sulfate groups from sulfuric acid hydrolysis on the thermal degradation behavior of bacterial cellulose, Biomacromolecules, 2004, 5(5), 1671–1677 CrossRef CAS PubMed.
- X. Wu, C. Lu, Z. Zhou, G. Yuan, R. Xiong and X. Zhang, Green synthesis and formation mechanism of cellulose nanocrystal-supported gold nanoparticles with enhanced catalytic performance, Environ. Sci.: Nano, 2014, 1(1), 71–79 RSC.
- M. Rashid, M. A. Gafur, M. K. Sharafat, H. Minami, M. A. J. Miah and H. Ahmad, Biocompatible microcrystalline cellulose particles from cotton wool and magnetization via a simple in situ co-precipitation method, Carbohydr. Polym., 2017, 170, 72–79 CrossRef CAS PubMed.
- F. He and D. Zhao, Preparation and characterization of a new class of starch-stabilized bimetallic nanoparticles for degradation of chlorinated hydrocarbons in water, Environ. Sci. Technol., 2005, 39(9), 3314–3320 CrossRef CAS PubMed.
- N. Lin, C. C. Bruzzese and A. Dufresne, TEMPO-oxidized nanocellulose participating as crosslinking aid for alginate-based sponges, ACS Appl. Mater. Interfaces, 2012, 4(9), 4948–4959 CrossRef CAS.
- A. M. Schwartzberg, C. D. Grant, A. Wolcott, C. E. Talley, T. R. Huser, R. Bogomolni and J. Z. Zhang, Unique gold nanoparticle aggregates as a highly active surface-enhanced Raman scattering substrate, J. Phys. Chem. B, 2004, 108(50), 19191–19197 CrossRef CAS.
- T. Deckert-Gaudig and V. Deckert, Ultraflat Transparent Gold Nanoplates—Ideal Substrates for Tip-Enhanced Raman Scattering Experiments, Small, 2009, 5(4), 432–436 CrossRef CAS PubMed.
- K.-H. Lin, D. Hu, T. Sugimoto, F.-C. Chang, M. Kobayashi and T. Enomae, An analysis on the electrophoretic mobility of cellulose nanocrystals as thin cylinders: relaxation and end effect, RSC Adv., 2019, 9(58), 34032–34038 RSC.
- N. S. Semenikhin, N. R. Kadasala, R. J. Moon, J. W. Perry and K. H. Sandhage, Individually dispersed gold nanoshell-bearing cellulose nanocrystals with tailorable plasmon resonance, Langmuir, 2018, 34(15), 4427–4436 CrossRef CAS PubMed.
- E. Csapó, D. Sebők, J. M. Babić, F. Šupljika, G. Bohus, I. Dékány, N. Kallay and T. Preočanin, Surface and structural properties of gold nanoparticles and their biofunctionalized derivatives in aqueous electrolytes solution, J. Dispersion Sci. Technol., 2014, 35(6), 815–825 CrossRef.
- H. B. Lueck, D. C. Daniel and J. L. McHale, Resonance Raman study of solvent effects on a series of triarylmethane dyes, J. Raman Spectrosc., 1993, 24(6), 363–370 CrossRef CAS.
- M. Li, J. Zhang, S. Suri, L. J. Sooter, D. Ma and N. Wu, Detection of adenosine triphosphate with an aptamer biosensor based on surface-enhanced Raman scattering, Anal. Chem., 2012, 84(6), 2837–2842 CrossRef CAS PubMed.
- H. Wei, W. Leng, J. Song, M. R. Willner, L. C. Marr, W. Zhou and P. J. Vikesland, Improved quantitative SERS enabled by surface plasmon enhanced elastic light scattering, Anal. Chem., 2018, 90(5), 3227–3237 CrossRef CAS PubMed.
- H. Wei, Q. Huang and P. J. Vikesland, The Aromatic Amine p K a Determines the Affinity for Citrate-Coated Gold Nanoparticles: In Situ Observation via Hot Spot-Normalized Surface-Enhanced Raman Spectroscopy, Environ. Sci. Technol. Lett., 2019, 6(4), 199–204 CrossRef CAS.
- H. Wei, W. Leng, J. Song, C. Liu, M. R. Willner, Q. Huang, W. Zhou and P. J. Vikesland, Real-time monitoring of ligand exchange kinetics on gold nanoparticle surfaces enabled by hot spot-normalized surface-enhanced Raman scattering, Environ. Sci. Technol., 2018, 53(2), 575–585 CrossRef PubMed.
- H. Wei, A. McCarthy, J. Song, W. Zhou and P. J. Vikesland, Quantitative SERS by hot spot normalization–surface enhanced Rayleigh band intensity as an alternative evaluation parameter for SERS substrate performance, Faraday Discuss., 2017, 205, 491–504 RSC.
- U. Dinish, G. Balasundaram, Y. T. Chang and M. Olivo, Sensitive multiplex detection of serological liver cancer biomarkers using SERS-active photonic crystal fiber probe, J. Biophotonics, 2014, 7(11–12), 956–965 CrossRef CAS PubMed.
- A. A. Kowalska, A. Kaminska, W. Adamkiewicz, E. Witkowska and M. Tkacz, Novel highly sensitive Cu-based SERS platforms for biosensing applications, J. Raman Spectrosc., 2015, 46(5), 428–433 CrossRef CAS.
- Z. Wu, Y. Liu, X. Zhou, A. Shen and J. Hu, A “turn-off” SERS-based detection platform for ultrasensitive detection of thrombin based on enzymatic assays, Biosens. Bioelectron., 2013, 44, 10–15 CrossRef CAS PubMed.
- Z. Y. Bao, X. Liu, Y. Chen, Y. Wu, H. L. Chan, J. Dai and D. Y. Lei, Quantitative SERS detection of low-concentration aromatic polychlorinated biphenyl-77 and 2, 4, 6-trinitrotoluene, J. Hazard. Mater., 2014, 280, 706–712 CrossRef CAS PubMed.
- S. Yang, X. Dai, B. B. Stogin and T.-S. Wong, Ultrasensitive surface-enhanced Raman scattering detection in common fluids, Proc. Natl. Acad. Sci. U. S. A., 2016, 113(2), 268–273 CrossRef CAS PubMed.
- A. Shrivastava and V. B. Gupta, Methods for the determination of limit of detection and limit of quantitation of the analytical methods, Chron. Young Sci., 2011, 2(1), 21 CrossRef.
- I. Robinson, L. D. Tung, S. Maenosono, C. Wälti and N. T. Thanh, Synthesis of core-shell gold coated magnetic nanoparticles and their interaction with thiolated DNA, Nanoscale, 2010, 2(12), 2624–2630 RSC.
Footnotes |
| † Electronic supplementary information (ESI) available. See DOI: 10.1039/d0an00711k |
| ‡ These authors made equal contributions to this work. |
| This journal is © The Royal Society of Chemistry 2020 |

