Exploring the microscopic mechanism of pseudocapacitance with electronic structures in monolayer 1T-MoS2 electrodes for supercapacitors†
Zhenzhou
Zhang
a,
Maokun
Wu
a,
Lijing
Wang
a,
Jin
Wang
a,
Yahui
Cheng
 a,
Luyan
Li
b,
Hong
Dong
a,
Hui
Liu
a,
Zhanglian
Hong
c,
Kyeongjae
Cho
a,
Luyan
Li
b,
Hong
Dong
a,
Hui
Liu
a,
Zhanglian
Hong
c,
Kyeongjae
Cho
 ad,
Feng
Lu
a,
Weichao
Wang
 *a and
Wei-Hua
Wang
 *a
*a
aDepartment of Electronic Science and Engineering, and Tianjin Key Laboratory of Photo-Electronic Thin Film Device and Technology, Nankai University, Tianjin, 300071, P. R. China. E-mail: whwangnk@nankai.edu.cn; weichaowang@nankai.edu.cn
bSchool of Science, Shandong Jianzhu University, Jinan, 250101, China
cState Key Laboratory of Silicon Materials, School of Materials Science and Engineering, Zhejiang University, Hangzhou, 310027, China
dDepartment of Material Science and Engineering, the University of Texas at Dallas, Richardson, 75080, USA
First published on 19th March 2019
Abstract
Quasi-two-dimensional 1T-MoS2 is a promising pseudocapacitance (Credox) electrode material due to its large specific surface area, superior electrical conductivity and mechanical stability. However, the microscopic mechanism of Credox and its further manipulation via modulating the structures and electronic structures are still unclear. Thus, the Credox of monolayer 1T-MoS2 has been explored based on first-principles calculations. For monolayer 1T-MoS2 adsorbed by H+ ions on one side or both sides, a band gap opens, decreases and even disappears with the coverage increase in H+ ions up to 100%. In this process, the charge transfer from the monolayer 1T-MoS2 to the adsorbed H+ ions almost linearly increases with the coverage increase in the H+ ions. In contrast, the potential change rate of the monolayer 1T-MoS2 reduces, resulting in the enhancement of Credox. Herein, the maximum values of Credox reached ∼76.7 μF cm−2 (252.8 F g−1) and ∼213.7 μF cm−2 (704.5 F g−1) for the 100% coverage of H+ ions on one side and both sides, respectively. Furthermore, the manipulation of Credox in the monolayer 1T-MoS2 could be realized through intrinsic defects engineering. Particularly, the Credox was greatly improved in the system with S vacancies. These results would provide significantly fundamental insights for understanding the correlation between the Credox and the electronic structures of 1T-MoS2 and other similar quasi-two dimensional materials.
Introduction
With the exhaustion of fossil resources and serious environmental pollution issues, exploiting environmentally friendly and renewable resources is an effective strategy to solve this problem. Among these solving schemes, it is significant to design highly efficient energy conversion and storage systems.1–6 Nowadays, lithium-ion batteries and supercapacitors are two types of energy storage systems widely applied in electrical/hybrid vehicles and portable devices. Lithium-ion batteries can provide large energy density, e.g. 120–170 W h kg−1, due to their high redox potential of Faraday energy storage mechanism. Nevertheless, lithium-ion batteries cannot provide huge energy in a short time to meet the demands of high power devices due to their slower kinetic Faraday process.7 In contrast, supercapacitors have been extensively studied due to their high power density, fast charging–discharging rate, long cyclic lifetime, low maintenance cost, etc.8–10 However, the current energy density of the supercapacitors is only limited to 5–10 W h kg−1.11 Therefore, it is required and currently urgent to improve the energy density of supercapacitors while maintaining their large power density output.In order to enhance the energy density of the supercapacitors, improving the specific capacitance of electrodes is one of the important routes. According to the energy storage mechanisms, the supercapacitors are generally divided into two types, namely electrical double layer capacitance (EDLC) and pseudocapacitance (Credox). Remarkably, it is pointed out that the Credox is one to two orders of magnitude higher than EDLCs in most of the present supercapacitors.12 As suitable electrode materials for supercapacitors, it is expected to possess large specific surface area, excellent electrical conductivity, mechanical stability and highly redox reaction activity. Since the discovery of graphene,13 graphene and graphene-like quasi-two-dimensional materials, such as transition metal dichalcogenides (TMDs), graphdiyne, transition metal carbides and carbonitrides (MXenes) have been widely used in electrode materials and photoelectrocatalysts due to their large specific surface area, superior electrical conductivity and good mechanical properties.14–18 It is noted that the Credox or electrochemical performance of graphene and its derivatives could be improved only after introducing intrinsic defects and external dopings, or by combining with transition metal compounds.19–24 The Credox of two-dimensional metal carbides or nitrides is also influenced by surface functional groups dependent on experimental conditions of etching preparations.25–28
Monolayer or few layers TMDs, represented by MoS2, have similar structures to graphene and can be well-prepared in experiments. Particularly, MoS2 with 1T structure is metallic and it has been applied as electrode materials. For instance, Zhu et al. demonstrated that the capacitance of multilayer 1T-MoS2 in aqueous condition is up to 380 F g−1 at a scan rate of 5 mV s−1.29 Chhowalla et al. displayed that the capacitance of exfoliated 1T-MoS2 nanosheets ranges from 400 F cm−3 to 700 F cm−3 in aqueous electrolytes.30 In fact, the adsorption of the ions on electrodes not only changes the charge filling of the energy bands but also influences the electronic structures of the electrodes.31,32 Although considerable experimental progress has been achieved for 1T-MoS2 as electrodes, the microscopic mechanism of the Credox and the manipulation of Credoxvia modulating the structures and electronic structures are still inaccessible.
In this study, the microscopic mechanism of Credox with the electronic structures was investigated. We found that the charge transfer almost linearly increased with the increase in the H+ ions coverage on one side and both sides of the monolayer 1T-MoS2. The Credox was dependent on the potential change to a large extent during the process of the H+ ions adsorption. The maximum Credox was achieved at the 100% H+ coverage and further improvements could be realized by introduction of the intrinsic S vacancies. These results clarified the correlation between the Credox and the electronic structures of monolayer 1T-MoS2 and would also provide fundamental insights for the further manipulation of Credox in 1T-MoS2 and other similar 2D materials.
Computational model and details
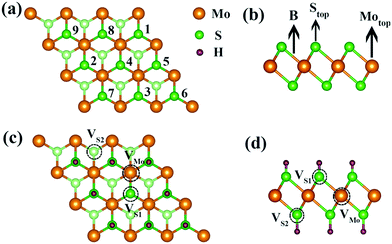
Our calculations were performed within the Vienna ab initio simulation package (VASP) based on the plane wave basis method.33 For the exchange correlation potential, generalized gradient approximation (GGA) with Perdew–Burke–Ernzerhof (PBE) functional was adopted.34 To simulate the Credox of 1T-MoS2, a 3 × 3 supercell was adopted, as shown in Fig. 1. The energy cutoff of plane wave was set to be 400 eV. The Monkhorst–Pack k-point grids of 5 × 5 × 1 and 9 × 9 × 1 were used for structural optimizations and self-consistent electronic structures, respectively. The optimized structure was obtained until the residual force on each atom converged to less than 0.02 eV Å−1. In the electronic structures steps, the energy was converged to less than 10−5 eV. In order to minimize the interaction between the vertically periodic layers, the thickness of the vacuum layer was set to be 20 Å along the z direction.Results and discussion
Structural configurations and stabilities of H+ ions adsorbed on monolayer 1T-MoS2
Monolayer 1T-MoS2 exhibits a sandwiched structure, where Mo atoms are sandwiched between two layers of S atoms, as shown in Fig. 1(b). The monolayer MoS2 has two different coordinated structures, namely trigonal phase (1T) and hexagonal phase (H).35,36 Compared with the H phase, the 1T-MoS2 prepared by the lithium ion intercalation and hydrothermal method exhibits superior electrical conductivity and structural stability even up to 100 °C.32,37,38 In this study, the monolayer 1T-MoS2 is our focus. The optimized lattice constant of 1T-MoS2 unit cell is 3.18 Å and the bond length of Mo–S is 2.42 Å, which is well consistent with the experimental data and previous reports.39–41In order to unveil the mechanism of Credox in aqueous conditions, the model system of H+ ions adsorbed on the surface of monolayer 1T-MoS2 was adopted. The total adsorbed system was in the neutral state since the equally additional number of electrons supplied to 1T-MoS2 would compensate the H+ ions in the charging state of supercapacitors. The adsorption energy (Ead) of H+ ions on 1T-MoS2 is defined as:
| Ead = (Etot − Epristine − nEH)/n | (1) |
For one specific H+ ion adsorbed on monolayer 1T-MoS2, three configurations of top site above S atom (Stop), top site above Mo atom (Motop) and bridge site above S–Mo bond (B) are displayed in Fig. 1(b). The adsorption energies of Stop, Motop and B site are −4.13 eV, −2.41 eV and −3.75 eV, respectively, indicating the favourable Stop adsorption for H+ ions. For two H+ ions adsorbed on one side of monolayer 1T-MoS2, two possible configurations of the nearest neighbouring (NN) and next nearest neighbouring adsorptions existed based on the distance between these two H+ ions. Through comparing the Ead of the NN and NNN configurations, we found that the NNN adsorption was more stable with an energy difference of 0.15 eV. With the increase in the adsorbed H+ ions, the possible configurations and the Ead were also examined, as shown in Table S1 of the ESI.† The most stable adsorbed sites are labelled by numbers in Fig. 1(a) according to the coverage increase in the H+ ions. It can be seen that the H+ ions tend to distribute away from each other to minimize the coulomb repulsions among them when the coverage is not large. To provide references for experiments, the coverage is used and defined as the ratio of the adsorbed H+ ions amount to the total active Stop sites. As the coverage increases, the absolute values of Ead gradually decrease but always with negative values in Fig. 2, implying the stable adsorbed state up to 100% coverage.
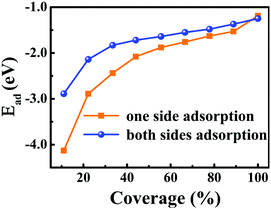 | ||
| Fig. 2 Dependence of the adsorption energies of H+ ions on one side and both sides of 1T-MoS2 on the H+ ions coverage. The corresponding relationship between the coverage and the number of the adsorbed H+ ions are listed in Table S1 of ESI.† | ||
Besides the one side adsorption of H+ ions on 1T-MoS2, both sides adsorption is reasonable to improve the Credox in practical nano array electrodes.42–46 Through comparing the Ead for different adsorbed configurations, it is seen that the symmetrically adsorbed configurations between the top and the bottom S layers are favourable. As displayed in Fig. 2, the Ead of H+ ions on both sides also follows the similar character except for slightly weaker than that of the one side adsorption, which is basically induced by the stronger coulomb repulsions among more adsorbed H+ ions.
Electronic structures of the H+ ions adsorption on monolayer 1T-MoS2
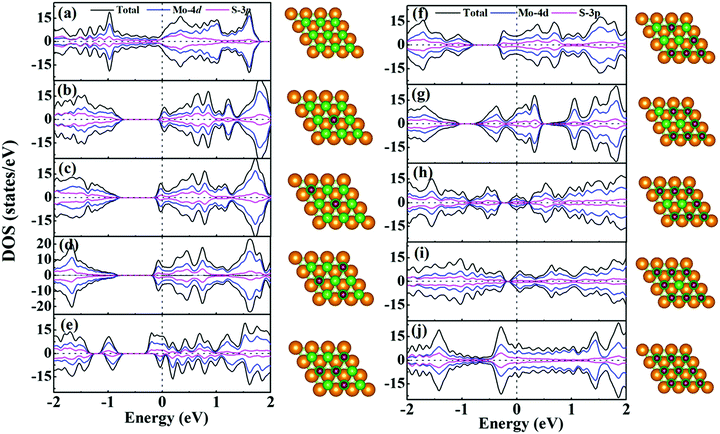
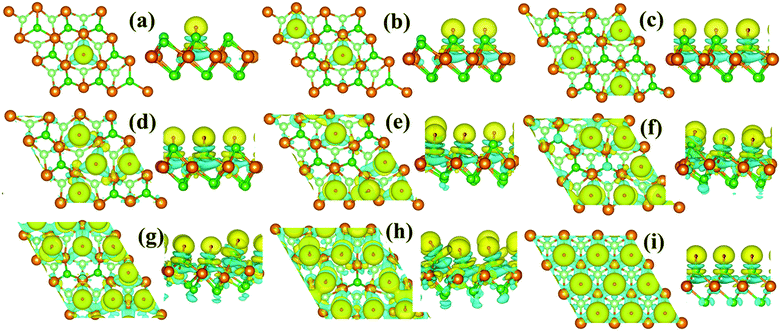
For supercapacitor electrodes, the fast charge/discharge rate is closely related to the carrier conductivity, which is reflected by the electronic structures of the electrode materials. For one side H+ adsorption of monolayer 1T-MoS2, the density of states (DOS) and partial DOS (PDOS) of monolayer 1T-MoS2 under the different adsorption coverages of H+ ions are presented in Fig. 3. The evolution of band structures with the H+ coverage is also provided in Fig. S1 of ESI.† In Fig. 3(a), the pristine monolayer 1T-MoS2 shows metallic character, which is consistent with the previous report.39 The states near the Fermi level (EF) are basically contributed by Mo-4d and S-3p orbitals due to the p–d hybridizations. When the active Stop sites on one side of monolayer 1T-MoS2 partially adsorb the H+ ions, the monolayer 1T-MoS2 opens one band gap and the band gap value decreases with the increment in the H+ coverage in Fig. 3(b–i). Under these situations, the EF is located within the conduction band, and the monolayer 1T-MoS2 still displays the metallic-like character. It is noted that the monolayer 1T-MoS2 demonstrates excellent metallic properties under the full coverage of H+ ions in Fig. 3(j) and Fig. S1(i) (ESI†). For monolayer 1T-MoS2 with H+ ions adsorbed on both sides, the DOS, PDOS and band structures of the 1T-MoS2 under different adsorption coverages are shown in Fig. S2 and S3 (ESI†). It is found that the monolayer 1T-MoS2 with both sides adsorption also shares the similar character to that with one side adsorption. Particularly, the metallic band structures of monolayer 1T-MoS2 are well preserved at 100% coverage of H+ ions in Fig. S3(i) (ESI†). Combined with the practical applications, the larger adsorption coverage of H+ ions and the excellent electrical conductivity are desirable to induce the promising large Credox for monolayer 1T-MoS2.Since the Credox is associated with the charge transfer between the adsorbed ions and the electrode, the charge density difference Δρ is presented in Fig. 4 to more vividly observe the charge transfer between the H+ ions and the charging monolayer 1T-MoS2. Δρ is expressed as
| Δρ = ρ(MoS2–nH) − ρ(MoS2n−) − ρ(nH+) | (2) |
As shown in Fig. 4, the monolayer 1T-MoS2 donates electrons to H+ ions in all coverage cases. In detail, the localized charge transfer basically occurs between the H+ ions and adjacent Mo atoms in the lower coverage systems. With the coverage increase in the H+ ions, the charge density difference distribution tends to be delocalized within 2D sheet of 1T-MoS2, indicating the improvement in the metallic properties for monolayer 1T-MoS2. In particular, the charge density difference in Fig. 4(i) is almost uniformly distributed in the 2D plane of the monolayer 1T-MoS2, consistent with the metallic band structures of 1T-MoS2 with 100% coverage of H+ ions in Fig. 3(j).
Pseudocapacitance of H+ ions adsorption on monolayer 1T-MoS2
Due to the fast reversible adsorption/desorption process of H+ ions in supercapacitors, the electrode of monolayer 1T-MoS2 would gain electrons to saturate the positive charges of H+ ions in the charging state. The Credox induced in this process can be calculated by| Credox = ΔQ/ΔV | (3) |
| ΔV = ΔWF/e | (4) |
 | (5) |
 are the work functions of the monolayer 1T-MoS2 adsorbed H+ ions at neutral state and the charged monolayer 1T-MoS2 with negative charge of ΔQ, respectively. For monolayer 1T-MoS2 itself, its EF crosses the energy bands and it is metallic whether in the pristine state or in charging state with additional negative charges through external circuit, as demonstrated by the uniformly distributed charges on the 2D plane of 1T-MoS2 in Fig. S4 of ESI.† Thus, the WF of monolayer 1T-MoS2 in charging state is accessible via the shift of EF (ΔEF) relative to pristine 1T-MoS2 according to the rigid-band approximation, which is presented in Fig. S5 of ESI.†
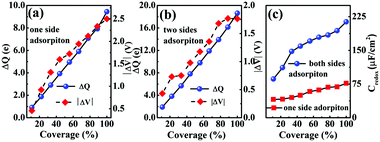
In Fig. 5(a and b), it is seen that the charge transfer, ΔQ, from the charged electrode to the H+ ions increases almost linearly with the increase in the coverage of H+ ions on one side or both sides of monolayer 1T-MoS2. At the same time, the WF values of monolayer 1T-MoS2 adsorbed by H+ ions at neutral state, WFMoS2–nH, and monolayer 1T-MoS2 with negatively charges,  , gradually decrease, which are listed in Table S2 of ESI.† The former is associated with the charge transfer and the surface electrical dipole,47 and the latter is related to ΔEF of the charged 1T-MoS2 relative to pristine 1T-MoS2. Due to the extended DOS near the EF of monolayer 1T-MoS2, ΔEF slightly increases with the increase in the electrons gain, leading to a slow reduction in
  . Hence, the potential change is related to the work function variation of monolayer 1T-MoS2 after adsorption by H+ ions. As the rate of decrease in WFMoS2–nH gets slower with the increase in the H+ ions coverage, particularly close to the complete coverage, the maximum values of the Credox, ∼76.67 μF cm−2 (∼252.81 F g−1) for one side adsorption and ∼213.67 μF cm−2 (704.53 F g−1) for two sides adsorption, respectively, have been obtained in Fig. 5(c). Our theoretically obtained Credox is higher than the reported experimental data, and further improvement of Credox would be expected and promising in experiments.29,48,49
Pseudocapacitance manipulation of monolayer 1T-MoS2 by intrinsic defects
The maximum Credox of monolayer 1T-MoS2 is achieved at full coverage of H+ ions due to the well-preserved structures and metallic electronic structures of monolayer 1T-MoS2. Combined with the experiments, the intrinsic defects of S vacancies or Mo vacancies possibly exist in the growth process due to different preparation conditions.50–53 To illustrate the influence of the defects on the Credox and to further manipulate Credox through introducing defects conversely, the effects of possible vacancies are explored in 100% coverage of H+ ions on monolayer 1T-MoS2. As shown in Fig. 1(c and d), for the 3 × 3 supercell with 100% coverage of H+ ions on one side and on both sides, one Mo vacancy (VMo), one S vacancy (VS1), and two S vacancies in top and bottom layers (VS1 + VS2) are considered. Under this situation, the Ead of H+ ions is expressed as,| Ead = (Etot − Edefect − nEH)/n | (6) |
With the intrinsic defects in 1T MoS2–nH system, the Ead of H+ ions is still negative for one side and both sides adsorption cases in Fig. 6(a), implying the energetically stable adsorption of H+ ions on defect monolayer 1T-MoS2. Moreover, the adsorption of H+ ions on 1T-MoS2 in the presence of VS1, VMo, or VS1+S2 gets slightly stronger than that on pristine 1T-MoS2, which is resulted from the nearest H+ moving closer to the vacancy site and the enhanced interaction between the H+ and the 1T-MoS2. In Fig. 6(a), it is also found that the adsorption of H+ ions on one side is more stable than that on both sides owing to the stronger Coulomb repulsion interaction between more H+ ions adsorbed on both sides of monolayer 1T-MoS2. In terms of the DOS in Fig. S6 of ESI,† all the above-mentioned systems demonstrate metallic characters, which could ensure the defective monolayer 1T-MoS2 possesses the well rate performance as an electrode.
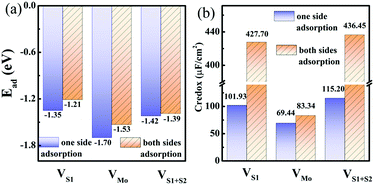 | ||
| Fig. 6 (a) Adsorption energies and (b) pseudocapacitance of monolayer 1T-MoS2 with 100% coverage of H+ ions on one side and both sides under different intrinsic defect states. | ||
In the presence of S vacancies, the Credox is increased to 101.93 μF cm−2 (336.09 F g−1) and 115.20 μF cm−2 (379.83 F g−1) in 100% coverage of H+ ions on one side of monolayer 1T-MoS2 with VS1 and VS1+S2, respectively, as shown in Fig. 6(b). Furthermore, the Credox in 100% coverage of H+ ions on both sides of monolayer 1T-MoS2 system is enhanced to 427.70 μF cm−2 (1410.24 F g−1) and 436.45 μF cm−2 (1439.08 F g−1) when VS1 and VS1+S2 are included. It is observed from Table S4 (ESI†) that the WFMoS2–nH of the system with S vacancies with respect to that of the intrinsic system is increased, which is induced by more electrons transfer from the defect 1T-MoS2 to H+ ions. At the same time,  of monolayer 1T-MoS2 with S vacancies at charging state is suppressed relative to that of the pristine 1T-MoS2 since the S vacancies contribute more electrons to facilitate the electrons emission. Thus, the potential difference, ΔV, is also suppressed, leading to an increased Credox in Fig. 6(b).
In contrast, the presence of the VMo reduces the Credox of monolayer 1T-MoS2. For instance, the Credox of the systems with one-side adsorption and two-side adsorption of H+ ions are 69.44 μF cm−2 and 83.34 μF cm−2, respectively, while the corresponding values are 76.67 μF cm−2 and 213.67 μF cm−2 in pristine systems with the same H+ ion coverage. As indicated in Table S4 (ESI†), the VMo lifts the WF of pristine monolayer 1T-MoS2 and simultaneously suppresses the WF of the total system (WFMoS2–nH), generating a larger potential difference between them and a decreased Credox. Through looking into the effects of the intrinsic defects on the Credox of monolayer 1T-MoS2, the Credox would be manipulated and improved to a large extent by controlling the experimental growth conditions in S poor environment to produce S vacancies.
In addition, about the approach to calculate the Credox, Credox is directly dependent on ΔQ and ΔV, which can be applied in other 2D materials and oxides. ΔQ is acquired by the charge transfer based on Bader charge analysis, and ΔV is obtained by the work function change of the electrode material. In other electrodes materials, the stability of the adsorbed systems, the charge transfer between the electrodes and the adsorbed ions, and the work function change are possibly different from monolayer 1T-MoS2 system. Particularly, the optimal performance of Credox and the favourable coverage of H+ ions need to be further examined.
Conclusions
In summary, the correlation between the Credox and the microscopic electronic structures was examined based on the DFT calculations. One factor determining the Credox is the charge transfer from the electrode to the adsorbed H+ ions. The other is the potential change of the electrode due to the H+ ions adsorption. For pristine monolayer 1T-MoS2, the amount of the charge transfer increases almost linearly with the increase in the H+ ion coverage. Thus, the Credox is mainly dependent on the potential change of the monolayer 1T-MoS2. The smaller decrease rate of the potential change in monolayer 1T-MoS2 with fully coverage of H+ ions on both sides results in a higher Credox of 213 μF cm−2 (704 F g−1). Moreover, the Credox is much improved after introducing S vacancies. These results would provide theoretical guidance in understanding and manipulating the pseudocapacitance properties of 1T-MoS2 or other similar quasi-two-dimensional materials for further experimental explorations.Author contributions
Wei-Hua Wang and Weichao Wang proposed the research idea, wrote and reviewed the manuscript. Zhenzhou Zhang performed the calculations and wrote the draft. Maokun Wu, Lijing Wang and Jin Wang did part of calculations. All the authors devoted to the discussions and revised the manuscript.Conflicts of interest
There are no conflicts to declare.Acknowledgements
This work was supported by National Key Research and Development Program of China with No. 2016YFB0901600 and National Natural Science Foundation of China with No. 11874223, 51871121, 51671108 and 51571123.References
- L. F. Chen, Y. Feng, H. W. Liang, Z. Y. Wu and S. H. Yu, Adv. Energy Mater., 2017, 7, 1700826 CrossRef.
- C. P. Grey and J. M. Tarascon, Nat. Mater., 2017, 16, 45–56 CrossRef PubMed.
- G. Zhang, Y. Han, C. Shao, N. Chen, G. Sun, X. Jin, J. Gao, B. Ji, H. Yang and L. Qu, Mater. Chem. Front., 2018, 2, 1750 RSC.
- N. Choudhary, M. A. Islam, J. H. Kim, T. J. Ko, A. Schropp, L. Hurtado, D. Weitzman, L. Zhai and Y. Jung, Nano Today, 2018, 19, 16–40 CrossRef CAS.
- N. Yang, Y. Zhang, J. E. Halpert, J. Zhai, D. Wang and L. Jiang, Small, 2012, 8, 1762–1770 CrossRef CAS PubMed.
- Y. Zhao, H. Tang, N. Yang and D. Wang, Adv. Sci., 2018, 5, 1800959 CrossRef PubMed.
- F. Wang, X. Wu, X. Yuan, Z. Liu, Y. Zhang, L. Fu, Y. Zhu, Q. Zhou, Y. Wu and W. Huang, Chem. Soc. Rev., 2017, 46, 6816–6854 RSC.
- R. Li, Y. Wang, C. Zhou, C. Wang, X. Ba, Y. Li, X. Huang and J. Liu, Adv. Funct. Mater., 2015, 25, 5384–5394 CrossRef CAS.
- F. Yu, T. Wang, Z. Wen and H. Wang, J. Power Sources, 2017, 364, 9–15 CrossRef CAS.
- H. Wang, C. M. B. Holt, Z. Li, X. Tan, B. S. Amirkhiz, Z. Xu, B. C. Olsen, T. Stephenson and D. Mitlin, Nano Res., 2012, 5, 605–617 CrossRef CAS.
- C. Liu, Z. Yu, D. Neff, A. Zhamua and B. Z. Jang, Nano Lett., 2010, 10, 4863–4868 CrossRef CAS PubMed.
- B. E. Conway, J. Electrochem. Soc., 1991, 138, 1539 CrossRef CAS.
- K. S. Novoselov, A. K. Geim, S. V. Morozov, D. Jiang, Y. Zhang, S. V. Dubonos, I. V. Grigorieva and A. A. Firsov, Science, 2004, 306, 666–669 CrossRef CAS PubMed.
- N. Yang, J. Zhai, D. Wang, Y. Chen and L. Jiang, ACS Nano, 2010, 2, 887–894 CrossRef PubMed.
- H. Ren, H. Shao, L. Zhang, D. Guo, Q. Jin, R. Yu, L. Wang, Y. Li, Y. Wang, H. Zhao and D. Wang, Adv. Energy Mater., 2015, 5, 1500296 CrossRef.
- Y. Zhao, J. Wan, H. Yao, L. Zhang, K. Lin, L. Wang, N. Yang, D. Liu, L. Song, J. Zhu, L. Gu, L. Liu, H. Zhao, Y. Li and D. Wang, Nat. Chem., 2018, 10, 924–931 CrossRef CAS PubMed.
- N. Yang, Y. Liu, H. Wen, Z. Tang, H. Zhao, Y. Li and D. Wang, ACS Nano, 2013, 7, 1504–1512 CrossRef CAS PubMed.
- J. Yan, C. E. Ren, K. Maleski, C. B. Hatter, B. Anasori, P. Urbankowski, A. Sarycheva and Y. Gogotsi, Adv. Funct. Mater., 2017, 27, 1701264 CrossRef.
- H. Wang, T. Maiyalagan and X. Wang, ACS Catal., 2012, 2, 781–794 CrossRef CAS.
- T. Akhter, M. M. Islam, S. N. Faisal, E. Haque, A. I. Minett, H. K. Liu, K. Konstantinov and S. X. Dou, ACS Appl. Mater. Interfaces, 2016, 8, 2078–2087 CrossRef CAS PubMed.
- T. Lin, I.-W. Chen, F. Liu, C. Yang, H. Bi, F. Xu and F. Huang, Science, 2015, 350, 6267 Search PubMed.
- Y. Xu, C. Y. Chen, Z. Zhao, Z. Lin, C. Lee, X. Xu, C. Wang, Y. Huang, M. I. Shakir and X. Duan, Nano Lett., 2015, 15, 4605–4610 CrossRef CAS PubMed.
- Z. Teng, N. Yang, H. Lv, S. Wang, M. Hu, C. Wang, D. Wang and G. Wang, Chem, 2019, 5, 1–17 Search PubMed.
- N. Yang and D. Wang, Chem, 2018, 4, 2260–2277 Search PubMed.
- Q. Tang, Z. Zhou and P. Shen, J. Am. Chem. Soc., 2012, 134, 16909–16916 CrossRef CAS PubMed.
- M. Naguib, M. Kurtoglu, V. Presser, J. Lu, J. J. Niu, M. Heon, L. Hultman, Y. Gogotsi and M. W. Barsoum, Adv. Mater., 2011, 23, 4248–4253 CrossRef CAS PubMed.
- H. W. Wang, M. Naguib, K. Page, D. J. Wesolowski and Y. Gogotsi, Chem. Mater., 2016, 28, 349–359 CrossRef CAS.
- B. Anasori, M. R. Lukatskaya and Y. Gogotsi, Nat. Rev. Mater., 2017, 2, 16098 CrossRef CAS.
- X. Geng, Y. Zhang, Y. Han, J. Li, L. Yang, M. Benamara, L. Chen and H. Zhu, Nano Lett., 2017, 17, 1825–1832 CrossRef CAS PubMed.
- M. Acerce, D. Voiry and M. Chhowalla, Nat. Nanotechnol., 2015, 10, 313–317 CrossRef CAS PubMed.
- X. Cong, C. Cheng, Y. Liao, Y. Ye, C. Dong, H. Sun, X. Ji, W. Zhang, P. Fang, L. Miao and J. Jiang, J. Phys. Chem. C, 2015, 119, 20864–20870 CrossRef CAS.
- Q. Tang and D. Jiang, Chem. Mater., 2015, 27, 3743–3748 CrossRef CAS.
- G. Kresse and J. Furthmüller, Phys. Rev. B: Condens. Matter Mater. Phys., 1996, 54, 11169–11186 CrossRef CAS.
- J. P. Perdew, K. Burke and M. Ernzerhof, Phys. Rev. Lett., 1996, 77, 3865 CrossRef CAS PubMed.
- M. Calandra, Phys. Rev. B: Condens. Matter Mater. Phys., 2013, 88, 245428 CrossRef.
- J. Heising and M. G. Kanatzidis, J. Am. Chem. Soc., 1999, 121, 638–643 CrossRef CAS.
- H. L. Tsai, J. Heising, J. L. Schindler, C. R. Kannewurf and M. G. Kanatzidis, Chem. Mater., 1997, 9, 879–882 CrossRef CAS.
- F. Wypych and R. Schollhorn, J. Chem. Soc., Chem. Commun., 1992, 19, 1386–1388 RSC.
- T. Hu, R. Li and J. Dong, J. Chem. Phys., 2013, 139, 174702 CrossRef PubMed.
- M. Kan, J. Y. Wang, X. W. Li, S. H. Zhang, Y. W. Li, Y. Kawazoe, Q. Sun and P. Jena, J. Phys. Chem. C, 2014, 118, 1515–1522 CrossRef CAS.
- K. E. Dungey, M. D. Curtis and J. E. P. Hahn, Chem. Mater., 1998, 10, 2152–2161 CrossRef CAS.
- X. Yang, L. Zhao and J. Lian, J. Power Sources, 2017, 343, 373–382 CrossRef CAS.
- M. Wang, L. Fan, D. Tian, X. Wu, Y. Qiu, C. Zhao, B. Guan, Y. Wang, N. Zhang and K. Sun, ACS Energy Lett., 2018, 3, 1627–1633 CrossRef CAS.
- L. Wang, X. Zhang, Y. Ma, M. Yang and Y. Qi, J. Phys. Chem. C, 2017, 121, 9089–9095 CrossRef CAS.
- J. Wang, D. Chao, J. Liu, L. Li, L. Lai, J. Lin and Z. Shen, Nano Energy, 2014, 7, 151–160 CrossRef CAS.
- W. J. Tang, X. L. Wang, D. Xie, X. H. Xia, C. D. Gu and J. P. Tu, J. Mater. Chem. A, 2018, 6, 18318–18324 RSC.
- M. Khazaei, M. Arai, T. Sasaki, A. Ranjbar, Y. Liang and S. Yunoki, Phys. Rev. B: Condens. Matter Mater. Phys., 2015, 92, 075411 CrossRef.
- N. Joseph, P. M. Shafi and A. C. Bose, New J. Chem., 2018, 42, 12082–12090 RSC.
- C. Y. Zhao, J. M. Ang, Z. L. Liu and X. Lu, Chem. Eng. J., 2017, 330, 462–469 CrossRef CAS.
- R. Addou, L. Colombo and R. M. Wallace, ACS Appl. Mater. Interfaces, 2015, 7, 11921–11929 CrossRef CAS PubMed.
- Z. Q. Fan, X. W. Jiang, J. W. Luo, L. Y. Jiao, R. Huang, S. S. Li and L. W. Wang, Phys. Rev. B, 2017, 96, 165402 CrossRef.
- W. Zhou, X. L. Zou, S. Najmaei, Z. Liu, Y. Shi, J. Kong, J. Lou, P. M. Ajayan, B. I. Yakobson and J. C. Idrobo, Nano Lett., 2013, 13, 2615–2622 CrossRef CAS PubMed.
- J. Hong, Z. Hu, M. Probert, K. Li, D. Lv, X. Yang, L. Gu, N. Mao, Q. Feng, L. Xie, J. Zhang, D. Wu, Z. Zhang, C. Jin, W. Ji, X. Zhang, J. Yuan and Z. Zhang, Nat. Commun., 2015, 6, 6293 CrossRef CAS PubMed.
Footnote |
| † Electronic supplementary information (ESI) available. See DOI: 10.1039/c9qm00060g |
| This journal is © the Partner Organisations 2019 |

