
A sandwich-type sulfur cathode based on multifunctional ceria hollow spheres for high-performance lithium–sulfur batteries†
Jianwei
Wang
ab,
Bo
Zhou
 c,
Hongyang
Zhao
b,
Miaomiao
Wu
b,
Yaodong
Yang
b,
Xiaolei
Sun
a,
Donghai
Wang
d and
Yaping
Du
*ab
c,
Hongyang
Zhao
b,
Miaomiao
Wu
b,
Yaodong
Yang
b,
Xiaolei
Sun
a,
Donghai
Wang
d and
Yaping
Du
*ab
aSchool of Materials Science and Engineering & National Institute for Advanced Materials, Tianjin Key Lab for Rare Earth Materials and Applications, Centre for Rare Earth and Inorganic Functional Materials, Nankai University, Tianjin 300350, China. E-mail: ypdu@nankai.edu.cn
bFrontier Institute of Science and Technology, Xi’an Jiaotong University, Xi’an 710054, China
cInstitute of Modern Physics, Shaanxi Key Laboratory for Theoretical Physics Frontiers, Northwest University, Xi’an 710069, China
dDepartment of Mechanical and Nuclear Engineering, Pennsylvania State University, University Park, PA 16802, USA
First published on 11th March 2019
Abstract
Despite prominent research efforts towards developing cathode materials for lithium–sulfur batteries, relatively little emphasis has been placed on constructing functional cathode architectures. Herein, ceria (CeO2) hollow spheres are prepared to fabricate the inside and outside structures of cathodes. A sandwich-type sulfur cathode, namely, a h-CeO2/sulfur-x-CNT/h-CeO2 cathode, is designed and fabricated by a simple layer-by-layer process. Due to its unique structural and compositional features, the h-CeO2/sulfur-0.8-CNT/h-CeO2 cathode delivers high specific capacities of 876, 761, and 644 mA h g−1 at 1C, 2C and 5C rates, and the capacity retentions are 85.7%, 87.8%, and 92.4%, respectively. During 100 test cycles, the material displays high coulombic efficiencies (above 99%) after the first cycle. More importantly, the cathode with a sulfur loading of 1.8 mg cm−2 also exhibits a stable cycling life up to 500 cycles at 1C with a capacity decay as low as 0.073% per cycle.
1. Introduction
The requirement for the rapid development of advanced energy storage systems has intensified worldwide the focus on lithium–sulfur (Li–S) batteries, due to their high theoretical capacity (1672 mA h g−1) and energy density (2600 W h kg−1).1–3 Compared to currently used cathode materials, sulfur has the advantages of natural abundance (260 ppm in the earth's crust), low cost ($0.15 kg−1), and environmental benignity.4–6 Li–S batteries are considered to be one of the most promising candidates for next-generation high energy storage devices.7,8 In spite of their great achievements in recent years, several obstacles to their commercialization still exist:9,10 (a) the poor electrical conductivity of sulfur (5 × 10⁻³⁰ S cm−1) and the discharge products (Li2S2/Li2S), (b) the large volume expansion upon lithiation (∼80%, which would inevitably cause collapse of the electrode structure), (c) the sluggish kinetics of polysulfide redox reactions, (d) the high solubility and diffusion of intermediate lithium polysulfides in organic electrolytes (which would lead to irreversible loss of active materials, rapid capacity fading and low coulombic efficiency), and (e) the low electrode loading and low energy density of batteries.To address the aforementioned drawbacks, strenuous efforts have been made towards developing new conductive composite cathode materials, modifying electrolytes, designing multifunctional binders and suppressing the formation of lithium dendrites in anodes.11–13 Up to now, rechargeable Li–S batteries have made remarkable progress in all directions, but the research fields of electrolytes, binders and anodes are still in infancy. The main strategy for improving electrochemical performance still concentrates on constructing functional cathode architectures.14,15 The mainstream of research on sulfur cathodes is divided into two parts: interior modification and external structural design. To date, various materials have been applied to interior modification of cathodes including graphene and its derivatives,16–18 metal oxides,19,20 porous carbon,21 conducting polymers,22 and carbon fibers.23 These effective tactics are used to physically trap and chemically adsorb sulfur and polysulfide species, resulting in excellent electrochemical performance. In addition, the external structure is fabricated by adding an interlayer between the cathode and separator, such as microporous carbon paper,24 porous metal foam,25 or TiO2/graphene.26 The results demonstrated that the interlayer could effectively suppress the shuttle effect of polysulfides and reutilize the captured active materials.
In general, nonpolar carbon materials absorb sulfur but repel polar polysulfides. Numerous reports have proved that polar metal oxides have strong affinity to polysulfides.27,28 The larger the difference in electronegativity between metal and oxygen, the stronger the polarity. Compared to the electronegativities of Ti (1.54), Al (1.61), Mg (1.31), Mn (1.55), Zr (1.33) and V (1.63), Ce (1.12) has a larger difference with respect to O (3.44), indicating a stronger polarity of ceria. Besides, CeO2 exhibits unique properties of rich oxygen vacancies,29 high catalytic activity30 and strong absorption of lithium polysulfides.31 After electrochemical lithiation, its ionic and electronic transport properties could be further improved.32 Moreover, building hollow structures has been proved to be an effective strategy to shorten transport length for both ions and electrons.33–38 Simultaneously, well-designed electrode structures use simple preparation processes and are beneficial for future commercialization.39–43
Based on the above comprehension, in this study, we selected CeO2 hollow spheres to fabricate the inside and outside structures of cathodes (Fig. 1). The sandwich-type architecture contained h-CeO2/sulfur and CNT/h-CeO2 interlayers, simply by coating the surface of h-CeO2/sulfur with a CNT/h-CeO2 interlayer. This novel architecture exhibits multifold features: (i) hollow spheres can not only provide a large inner void space for loading sulfur but also tolerate the volume expansion of sulfur during cycling; (ii) strongly polar CeO2 with abundant oxygen vacancies can effectively suppress polysulfide diffusion and accelerate lithium ion transport; (iii) the initial conductivity of CeO2 was improved by coating with a carbon layer, resulting in high transport of electrons; (iv) by introducing the CNT/h-CeO2 interlayer, the unique features of CeO2 are fully reused during electrochemical cycling. With these desired properties, a novel h-CeO2/sulfur-0.8-CNT/h-CeO2 cathode was achieved.
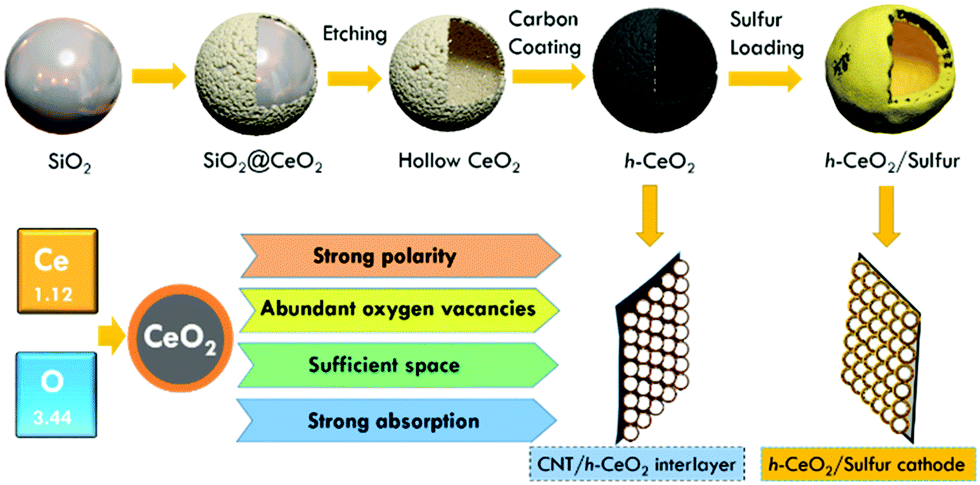 | ||
| Fig. 1 Illustration of synthetic procedures of a h-CeO2/sulfur cathode and a CNT/h-CeO2 interlayer for Li–S batteries. | ||
2. Results and discussion
Transmission electron microscopy (TEM) and scanning electron microscopy (SEM) were used to analyze the microstructures and components of the as-prepared samples. As shown in Fig. 2a, the SiO2 templates were uniform nanospheres with diameters of about 200 nm. After chemical etching, hollow CeO2 was obtained and showed a hollow interior (Fig. 2b and c), whose inner diameter was in good accordance with the size of the SiO2 template. Fig. 2d reveals that carbon was uniformly coated on the surface of hollow CeO2. The BET surface area of h-CeO2 was about 47.72 m2 g−1 (Fig. S1, ESI†) and a HRTEM image was recorded on the surface of h-CeO2 (Fig. 2e). The measured interplanar spacing of 0.31 nm was indexed well to the CeO2(111) plane. The high-angle annular dark-field (HAADF) TEM image (Fig. 2f) and EDS elemental mapping (Fig. 2g) demonstrated the homogeneous distribution of Ce, S and C within h-CeO2/sulfur composites. Since electrochemical redox reaction mainly took place at the interface of host materials, the highly uniform dispersion of sulfur at the nanoscale could fully utilize the active and adsorptive sites of CeO2. h-CeO2/sulfur-x (x = 0.7, 0.8, and 0.9), where x is the initial weight proportion of sulfur, were prepared by tuning the initial weight ratio between h-CeO2 and sulfur. The practical weight proportions of sulfur in the h-CeO2/sulfur-x samples were determined using TGA measurements (Fig. S2, ESI†). As shown in Fig. 2h, typical peaks are located at 28.8°, 33.4°, 47.8° and 56.6°, corresponding to the (111), (200), (220) and (311) planes of the cubic phase (CeO2, JCPDS 34-0394). In addition, the strong peaks at 23.0°, 25.8°and 27.7° can be indexed to the (222), (026) and (040) planes, respectively, which accorded well with the characteristic diffraction peaks of pure sulfur.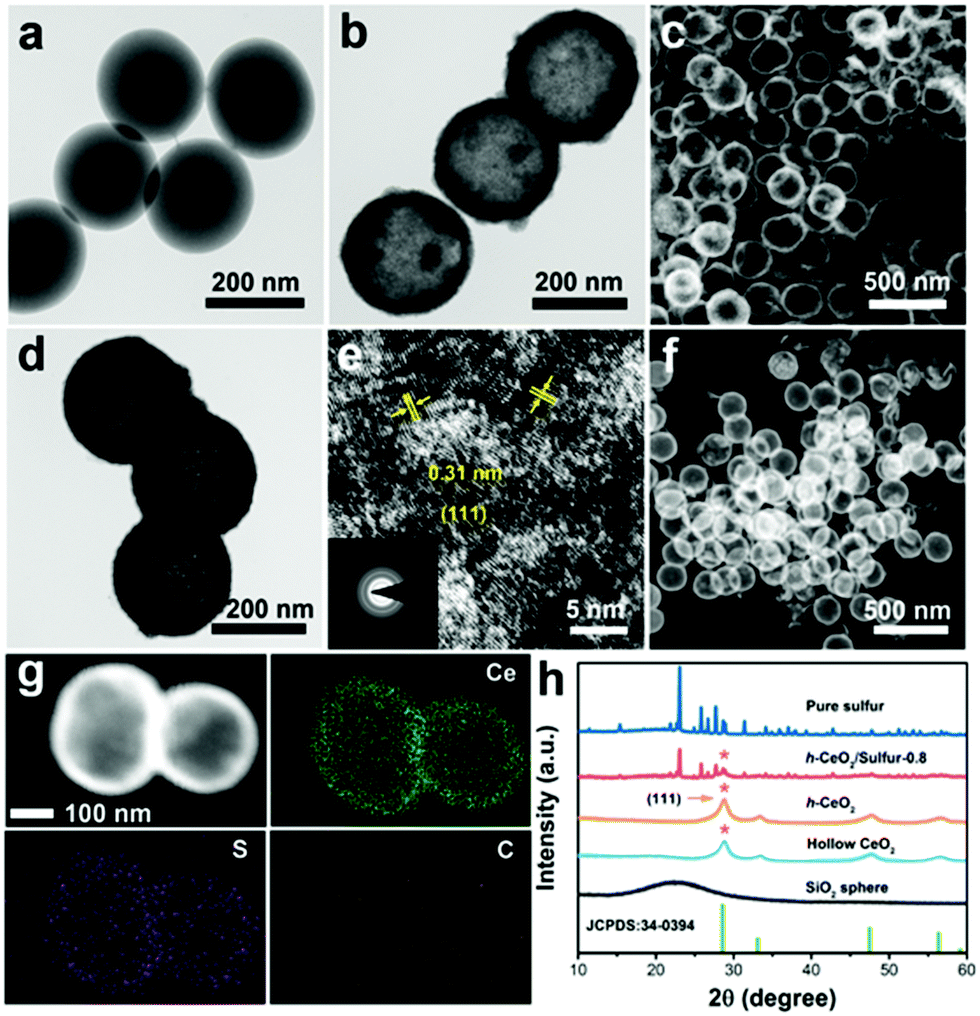 | ||
| Fig. 2 TEM images of (a) SiO2 and (b) hollow CeO2. (c) SEM image of hollow CeO2. (d) TEM image and (e) HRTEM image of h-CeO2 (the inset shows a SAED pattern). (f) HAADF-TEM image and (g) EDS elemental mapping of h-CeO2/sulfur-0.8. (h) XRD patterns. | ||
To understand the strong interactions, density functional theory (DFT) calculation was implemented in the Vienna ab initio simulation package (VASP). Fig. 3a and Fig. S3 (ESI†) show the optimized geometries of S8 and lithium polysulfides adsorbed on the surface of CeO2, respectively. The calculated adsorption energies (Fig. 3b) were −1.337 eV for S8, −1.302 eV for Li2S8, −1.589 eV for Li2S6, −1.870 eV for Li2S4, −0.736 eV for Li2S2 and −2.098 eV for Li2S. The calculated values were significantly higher than those for nonpolar carbon materials,44,45 suggesting strong binding between CeO2 and polysulfides. The strong binding was conducive to immobilizing lithium polysulfides and preventing them from dissolving into electrolyte, resulting in improved performance of Li–S batteries.
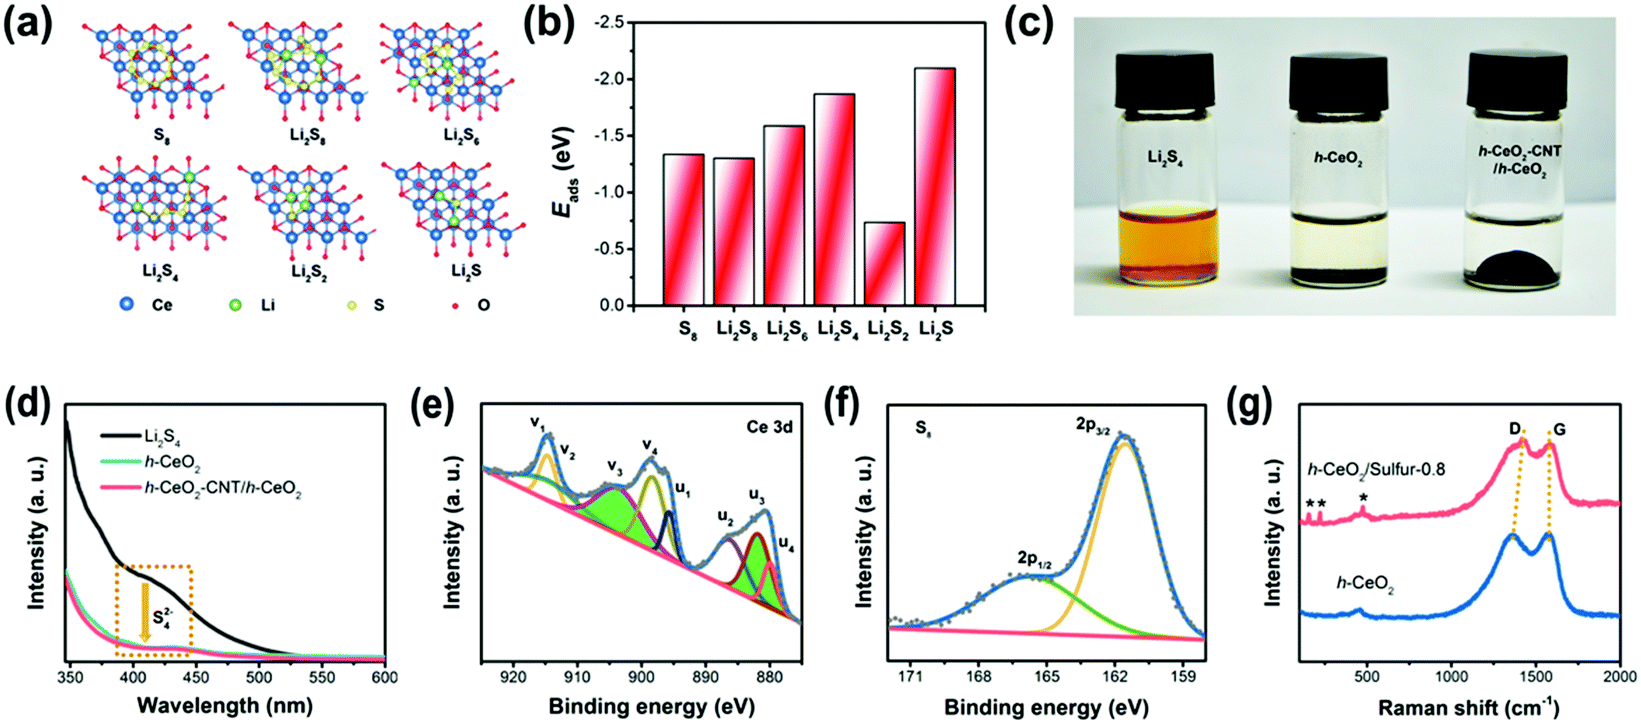 | ||
| Fig. 3 (a) Optimized geometries and (b) adsorption energies of S8 and polysulfides on ceria surfaces; (c) digital photographs showing the adsorption ability of Li2S4 after 12 h; (d) UV/vis absorption spectra of lithium polysulfide (Li2S4/DME) solution before and after adding h-CeO2 and h-CeO2-CNT/h-CeO2 interlayers; (e) and (f) high-resolution XPS spectra of h-CeO2/sulfur-0.8; and (g) Raman spectra of h-CeO2 and h-CeO2/sulfur-0.8. | ||
In order to further assess the adsorption ability of h-CeO2 and h-CeO2-CNT/h-CeO2 interlayers, polysulfide adsorption measurements and UV/vis absorption tests were performed in Li2S4/DME solutions. As shown in Fig. 3c, the initial Li2S4/DME solution was transparent orange, and then its color changed from orange to colorless after adding the two samples, respectively. Fig. 3d shows a characteristic absorption region around 420 nm, which could be ascribed to S42− species.46 It was clearly observed that the peak intensities of the Li2S4 solutions with the two samples significantly decreased, indicating the higher affinity to and strong adsorption of S42− species. As shown in Fig. 3e, the complex Ce 3d spectra were fitted with eight peaks, labeled v1 (914.8), v2 (912.5), v3 (903.7), v4 (898.4), u1 (895.7), u2 (886.3), u3 (881.8), and u4 (880.0), respectively. The peaks labeled with v3 and u3 represented the 3d104f1 electronic state of Ce3+, and the other peaks (v1, v2, v4, u1, u2 and u4) represented the 3d104f0 electronic state of Ce4+. The results revealed both Ce3+ and Ce4+ species in the sample. As is known to all, the presence of Ce3+ ions could lead to charge imbalance, creating oxygen vacancies and unsaturated chemical bonds in the CeO2 lattice, which is dependent on the concentration of Ce3+ ions.47 The concentration of Ce3+ ions was estimated from the ratio of the integrated Ce3+ peaks to the sum of the Ce3+ and Ce4+ peaks, as follows: ρ(Ce3+) = [A(Ce3+)]/[A(Ce3+) + A(Ce4+)].
According to the calculation, the concentration of Ce3+ ions in the h-CeO2/sulfur sample was ∼0.38, indicating abundant oxygen vacancy defects. Fig. 3f shows the S 2p spectrum has two typical peaks at 161.5 (2p3/2) and 165.6 (2p1/2) eV, due to their spin–orbit coupling. Furthermore, the bonding energy of 161.5 (2p3/2) eV was lower than that of elemental sulfur (163.8 eV), which indicated the possible presence of C–S or O–S species.48 They can effectively anchor the polysulfides onto the surface during the electrochemical process. C 1s, O 1s and N 1s spectra are displayed in Fig. S4 (ESI†). In Fig. 3g, the Raman spectra of h-CeO2 and h-CeO2/sulfur-0.8 displayed typical features of the carbon layer, D and G peaks at 1368 and 1578 cm−1. The high intensity ratio of the D to G band (ID/IG = 0.97) confirmed the existence of graphitic structure.49 The sulfur of the h-CeO2/sulfur-0.8 composite showed the characteristic peaks at 155.9, 221.7 and 473.4 cm−1, respectively.
The cycling performance and rate capabilities of h-CeO2/sulfur-x at 0.2C are presented in Fig. 4a and Fig. S5 (ESI†), respectively. The h-CeO2/sulfur-0.8 cathode exhibited excellent stability and the capacity retention was as high as 92.3%. However, the capacity retentions of h-CeO2/sulfur-0.7 and h-CeO2/sulfur-0.9 were 68.7% and 57.3%, respectively. For rate capability, the h-CeO2/sulfur-0.8 cathode also displayed the best rate capability at each current density. The typical charge/discharge profiles and cyclic voltammograms (CV) of h-CeO2/sulfur-x (x = 0.7, 0.8 and 0.9) cathodes in the range of 1.7–2.6 V vs. Li/Li+ are shown in Fig. S6 (ESI†). With the increase of sulfur content in cathode materials, h-CeO2/sulfur-0.8 showed almost the same small polarization as h-CeO2/sulfur-0.7 and the polarization of h-CeO2/sulfur-0.9 was extremely remarkable. The charge/discharge profiles of the initial four cycles showed similar features and were well consistent with the CV curves, respectively. h-CeO2/sulfur-0.8 exhibited excellent capacity retention and rate capability due to the optimal proportion of sulfur, which fully utilized the redox reaction of sulfur in cathode material. Consequently, the h-CeO2/sulfur-0.8 cathode was chosen to study the effects of different interlayers in cells. Fig. 4b shows the cycling capability of the three samples at 0.5C, wherein the h-CeO2/sulfur-0.8-CNT/h-CeO2 interlayer electrode exhibited superior cycling stability to h-CeO2/sulfur-0.8-CNT. In order to demonstrate the rate performance of the three samples, the current density was changed from 0.5 to 2.0C, as shown in Fig. 4c. The h-CeO2/sulfur-0.8-CNT/h-CeO2 electrode displayed discharge capacities of 884, 808 and 736 mA h g−1 at 0.5, 1.0, and 2.0C, respectively. Compared with h-CeO2/sulfur-0.8 and h-CeO2/sulfur-0.8-CNT, h-CeO2/sulfur-0.8-CNT/h-CeO2 showed the best rate capability, due to the synergistic effect of CNTs and CeO2 hollow spheres. CNTs boosted electronic conductivity and CeO2 hollow spheres led to higher chemisorption and physical confinement to sulfur species. The volumetric capacities of the h-CeO2/sulfur-0.8 and h-CeO2/sulfur-0.8-CNT/h-CeO2 cathodes at 0.5C are shown in Fig. S7 (ESI†). The CV curves of the h-CeO2/sulfur-0.8-CNT/h-CeO2 cathode for the first four cycles were obtained at a scan rate of 0.2 mV s−1. Two distinctive reduction peaks at 2.32 and 2.02 V are observed in Fig. 4d. The broad reduction peak at 2.32 V can be attributed to the reduction of elemental sulfur to intermediate polysulfides (Li2Sx, 4 ≤ x ≤ 8), while the second reduction peak at 2.02 V can be ascribed to the further reduction to short-chain insoluble Li2S/Li2S2. A strong and broad oxidation peak centered at 2.39 V corresponded to the reverse processes from Li2S/Li2S2 to Li2Sx and eventually to S8. In addition, the CV curves of h-CeO2/sulfur-0.8 and h-CeO2/sulfur-0.8-CNT were also recorded (Fig. S6c and S8, ESI†). Moreover, comparing both curves, we found that the subsequent cycles of h-CeO2/sulfur-0.8-CNT/h-CeO2 nearly overlapped each other, implying a minimal polarization and good electrochemical stability. The electrochemical impedance spectroscopy (EIS) measurements were carried out for three fresh cathodes (Fig. S9, ESI†). The Nyquist plots were composed of two semicircles and a slope line. The EIS fitting results (Table S1, ESI†) showed that the three curves exhibited slight change in the high and low frequency ranges, suggesting similar charge transfer resistances and Warburg impedances.
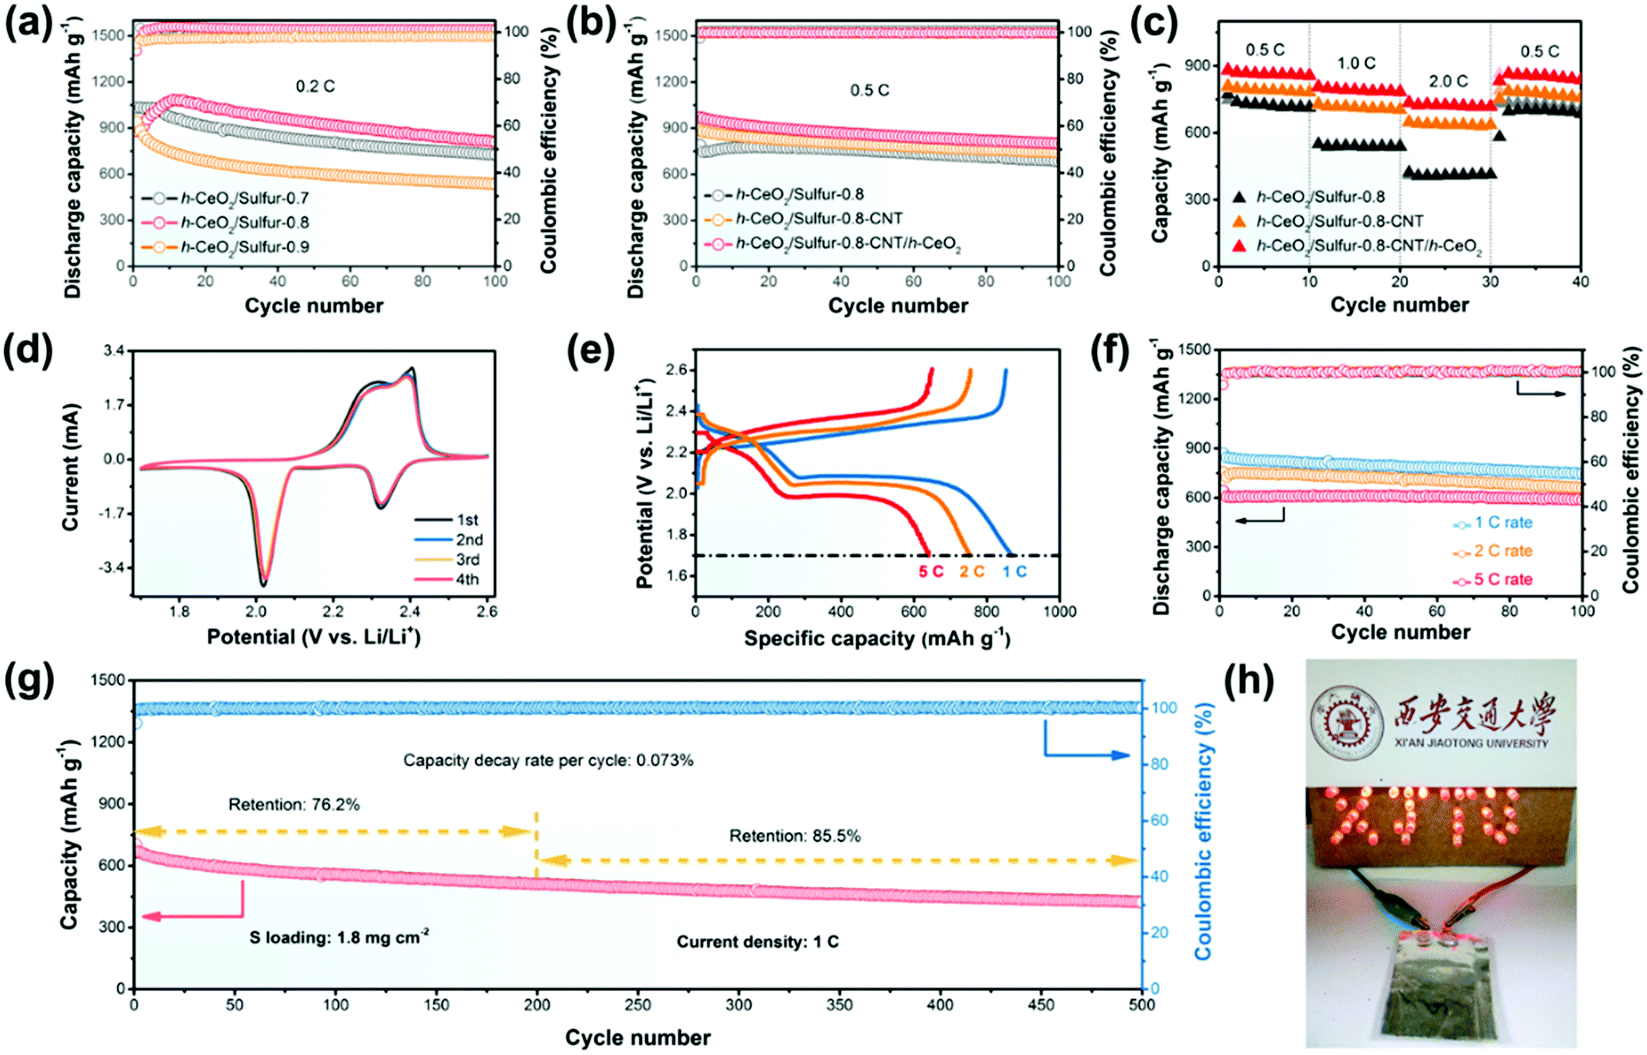 | ||
| Fig. 4 (a) Cycling performances of h-CeO2/sulfur-0.7, h-CeO2/sulfur-0.8 and h-CeO2/sulfur-0.9 at 0.2C; (b) cycling performances and (c) rate capabilities of h-CeO2/sulfur-0.8, h-CeO2/sulfur-0.8-CNT and h-CeO2/sulfur-0.8-CNT/h-CeO2 interlayers; (d) CV profiles of a h-CeO2/sulfur-0.8-CNT/h-CeO2 interlayer at a scan rate of 0.2 mV s−1; (e) voltage profiles; (f) discharge capacities and coulombic efficiencies at various current densities; (g) long-term cycling properties at 1C for 500 cycles and (h) a soft-packaged Li–S battery with the h-CeO2/sulfur-0.8-CNT/h-CeO2 interlayer electrode. | ||
Fig. 4e exhibits the charge/discharge profiles of the h-CeO2/sulfur-0.8-CNT/h-CeO2 cathode at various rates. All of them displayed two well-defined plateaus in accordance with the CV results. At 1C, 2C and 5C rates, the h-CeO2/sulfur-0.8-CNT/h-CeO2 cathode still showed excellent cycling performance and high coulombic efficiencies above 99% except for the first cycle (Fig. 4f). Their initial capacities were 876, 761, and 644 mA h g−1 and the capacity retentions were 85.7%, 87.8%, and 92.4% after 100 cycles, respectively. The results better showed the advantage of the functional cathode architecture with CeO2 hollow spheres in Li–S batteries. Compared with previously reported studies on metal oxides (Table S2, ESI†), the h-CeO2/sulfur-0.8-CNT/h-CeO2 cathode showed higher rate capability and better cycling stability. In order to further demonstrate its superiority, a long-term cycle test with a sulfur loading of 1.8 mg cm−2 was carried out at a rate of 1C. As shown in Fig. 4g, the cathode maintained a capacity of 511 mA h g−1 and achieved a capacity retention of 76.2% in the 200th cycle. Then, the capacity rentention was 85.5% from the 200th to 500th cycle. More importantly, the capacity decay rate of 0.073% per cycle was very small during the 500 cycles, representing little shuttle effect of polysulfides.
As a proof-of-concept demonstration, a soft-packaged Li–S battery was assembled with the h-CeO2/sulfur-0.8-CNT/h-CeO2 as the cathode. The charge and discharge capacities of the battery are shown in Fig. S10 (ESI†). As shown in Fig. 4h, the soft-packaged battery could light up a visual XJTU model, which was made up of 30 red light-emitting diodes.
To better understand its excellent electrochemical performance, SEM images of the CNT/h-CeO2 interlayer were compared before and after 500 cycles (Fig. 5a and b). In the pristine CNT/h-CeO2 interlayer, h-CeO2 nanoparticles were uniformly embedded in the upper, middle and lower positions of the layer structure. After 500 cycles, although the hollow spherical structure was still maintained, the glue-like morphology indicated that the dissolved polysulfides were mainly absorbed by polar CeO2 in the interlayer. The elemental mapping results after cycling are shown in Fig. 5c–h, and the sulfur signal was also intensively distributed over and around CeO2, proving good adsorption on sulfur species and ensuring superior reutilization and reversibility. It was clearly observed that the carbon signal was stronger than the cerium and oxygen signals, implying good conductivity even for long cycles. The mapping image of fluorine confirmed that an effective barrier was developed in fluorinated electrolyte, which could mitigate polysulfide transport and allowed lithium ion transport.50 All the above results further demonstrated that the CeO2-containing interlayer in this cell architecture was very important to mitigate the shuttling effect and improve the cycling stability. To elaborate the advantages of functional cathode architecture, a schematic illustration of Li–S batteries is shown in Fig. S11 (ESI†). The results demonstrated that this architecture could further efficiently intercept the migrating polysulfides and reutilize the trapped active material, leading to a better electrochemical performance.
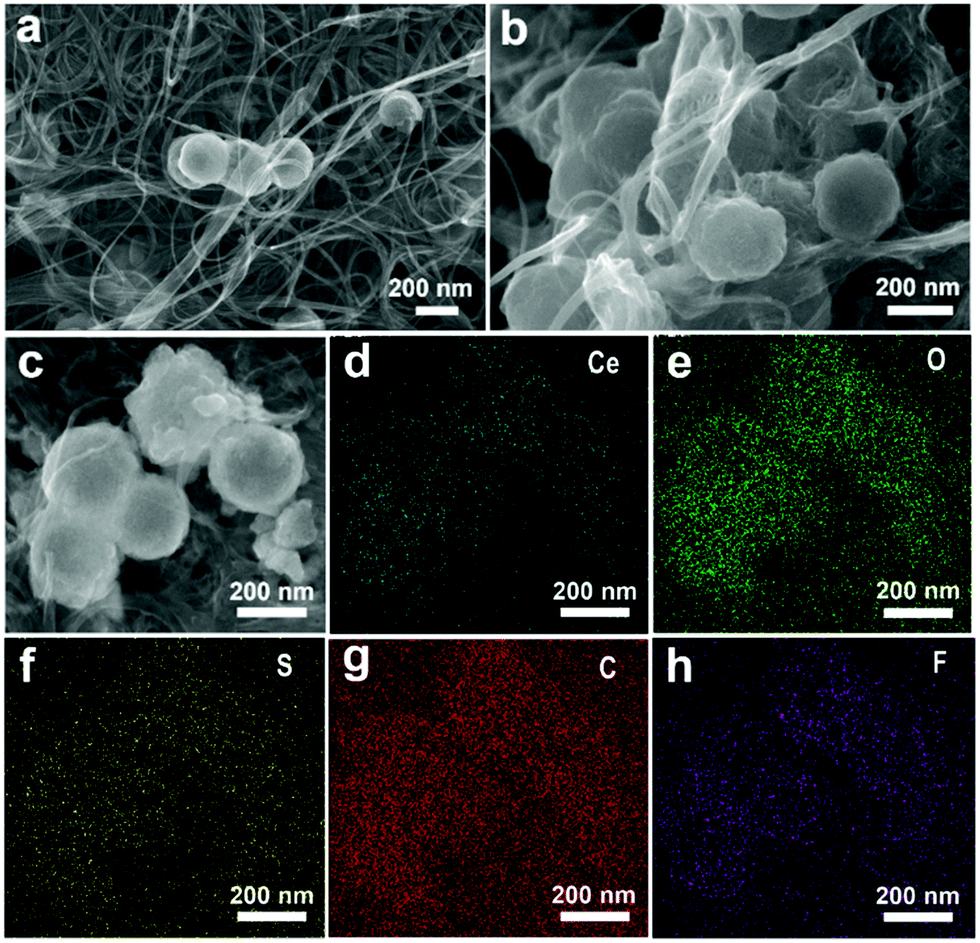 | ||
| Fig. 5 (a) Initial CNT/h-CeO2 interlayer; (b) CNT/h-CeO2 interlayer after 500 cycles; and (c–h) the images of SEM and EDX elemental mapping. | ||
3. Conclusions
In summary, a multifunctional h-CeO2/sulfur-x-CNT/h-CeO2 cathode was designed and synthesized by a simple layer-by-layer procedure. The functional cathode architecture with CeO2 benefits from strong physical adsorption and chemical binding with the lithium polysulfides, and also well tolerates volumetric expansion of sulfur upon lithiation. More importantly, this architecture could make full use of the unique features of CeO2 and reutilize the active materials during electrochemical cycling. The h-CeO2/sulfur-0.8-CNT/h-CeO2 cathode showed high rate capability and long-term cycling stability of 500 cycles with a low capacity decay of 0.073% at 1C. We believe that this study may offer an instructive strategy of rational structural construction for advanced Li–S battery cathodes.Conflicts of interest
There are no conflicts to declare.Acknowledgements
We gratefully acknowledge the support from the China National Funds for Excellent Young Scientists (21522106) and the National Key R&D Program of China (2017YFA0208000). We also acknowledge Prof. Chunhua Yan for his kind support and suggestions.Notes and references
- A. Manthiram, Y. Fu, S.-H. Chung, C. Zu and Y.-S. Su, Chem. Rev., 2014, 114, 11751–11787 CrossRef CAS PubMed
.
- J. Y. Hwang, H. M. Kim, S. K. Lee, J. H. Lee, A. Abouimrane, M. A. Khaleel, I. Belharouak, A. Manthiram and Y. K. Sun, Adv. Energy Mater., 2016, 6, 1501480 CrossRef
- S. Evers and L. F. Nazar, Acc. Chem. Res., 2013, 46, 1135–1143 CrossRef CAS PubMed
- S. H. Chung, C. H. Chang and A. Manthiram, Adv. Funct. Mater., 2018, 1801188 CrossRef
- L. Hu, C. Dai, H. Liu, Y. Li, B. Shen, Y. Chen, S. J. Bao and M. Xu, Adv. Energy Mater., 2018, 1800709 CrossRef
- Y. S. Su and A. Manthiram, Chem. Commun., 2012, 48, 8817–8819 RSC
- M. Wild, L. O’neill, T. Zhang, R. Purkayastha, G. Minton, M. Marinescu and G. Offer, Energy Environ. Sci., 2015, 8, 3477–3494 RSC
- S. Xin, L. Gu, N. H. Zhao, Y. X. Yin, L. J. Zhou, Y. G. Guo and L. J. Wan, J. Am. Chem. Soc., 2012, 134, 18510–18513 CrossRef CAS PubMed
- R. Fang, S. Zhao, Z. Sun, D. W. Wang, H. M. Cheng and F. Li, Adv. Mater., 2017, 29, 1606823 CrossRef PubMed
- M. K. Song, Y. Zhang and E. J. Cairns, Nano Lett., 2013, 13, 5891–5899 CrossRef CAS PubMed
- E. Cha, M. D. Patel, J. Park, J. Hwang, V. Prasad, K. Cho and W. Choi, Nat. Nanotechnol., 2018, 13, 337–344 CrossRef CAS PubMed
- L. Fan, S. Chen, J. Zhu, R. Ma, S. Li, R. Podila, A. M. Rao, G. Yang, C. Wang, Q. Liu, Z. Xu, L. Yuan, Y. Huang and B. Lu, Adv. Sci., 2018, 5, 1700934 CrossRef PubMed
- L. Ma, R. Chen, G. Zhu, Y. Hu, Y. Wang, T. Chen, J. Liu and Z. Jin, ACS Nano, 2017, 11, 7274–7283 CrossRef CAS PubMed
- Q. Pang, X. Liang, C. Y. Kwok and L. F. Nazar, Nat. Energy, 2016, 1, 16132 CrossRef CAS
- W. Kong, L. Yan, Y. Luo, D. Wang, K. Jiang, Q. Li, S. Fan and J. Wang, Adv. Funct. Mater., 2017, 27, 1606663 CrossRef
- W. Wu, J. Pu, J. Wang, Z. Shen, H. Tang, Z. Deng, X. Tao, F. Pan and H. Zhang, Adv. Energy Mater., 2018, 8, 1702373 CrossRef
- Z. Zhang, L. L. Kong, S. Liu, G. R. Li and X. P. Gao, Adv. Energy Mater., 2017, 7, 1602543 CrossRef
- Z. Li, Y. Jiang, L. Yuan, Z. Yi, C. Wu, Y. Liu, P. Strasser and Y. Huang, ACS Nano, 2014, 8, 9295–9303 CrossRef CAS PubMed
- Z. Wei Seh, W. Li, J. J. Cha, G. Zheng, Y. Yang, M. T. McDowell, P. C. Hsu and Y. Cui, Nat. Commun., 2013, 4, 1331 CrossRef PubMed
- D. Xiao, C. Lu, C. Chen and S. Yuan, Energy Storage Mater., 2018, 10, 216–222 CrossRef
- G. Li, J. Sun, W. Hou, S. Jiang, Y. Huang and J. Geng, Nat. Commun., 2016, 7, 10601 CrossRef CAS PubMed
- A. G. Simmonds, J. J. Griebel, J. Park, K. R. Kim, W. J. Chung, V. P. Oleshko, J. Kim, E. T. Kim, R. S. Glass, C. L. Soles, Y. E. Sung, K. Char and J. Pyun, ACS Macro Lett., 2014, 3, 229–232 CrossRef CAS
- H. Wang, C. Zhang, Z. Chen, H. K. Liu and Z. Guo, Carbon, 2015, 81, 782–787 CrossRef CAS
- Y. S. Su and A. Manthiram, Nat. Commun., 2012, 3, 1166 CrossRef PubMed
- X. Li, S. Chen, J. Fan, Z. Hu and S. Zhang, Ind. Eng. Chem. Res., 2018, 57, 4880–4886 CrossRef CAS
- Z. Xiao, Z. Yang, L. Wang, H. Nie, M. Zhong, Q. Lai, X. Xu, L. Zhang and S. Huang, Adv. Mater., 2015, 27, 2891–2898 CrossRef CAS PubMed
- X. Liu, J. Q. Huang, Q. Zhang and L. Mai, Adv. Mater., 2017, 29, 1601759 CrossRef PubMed
- G. Zhou, Y. Zhao, C. Zu and A. Manthiram, Nano Energy, 2015, 12, 240–249 CrossRef CAS
- L. Lv, D. Zha, Y. Ruan, Z. Li, X. Ao, J. Zheng, J. Jiang, H. M. Chen, W. H. Chiang, J. Chen and C. Wang, ACS Nano, 2018, 12, 3042–3051 CrossRef CAS PubMed
- Z. Liu, J. Zhu, J. Li, L. Ma and S. I. Woo, ACS Appl. Mater. Interfaces, 2014, 6, 14500–14508 CrossRef CAS PubMed
- X. Tao, J. Wang, C. Liu, H. Wang, H. Yao, G. Zheng, Z. W. Seh, Q. Cai, W. Li, G. Zhou, C. Zu and Y. Cui, Nat. Commun., 2016, 7, 11203 CrossRef CAS PubMed
- K. Li, X. Zhou, A. Nie, S. Sun, Y. B. He, W. Ren, B. Li, F. Kang, J. K. Kim and T. Y. Zhang, Nano Lett., 2017, 17, 1282–1288 CrossRef CAS PubMed
- J. Wang, H. Tang, L. Zhang, H. Ren, R. Yu, Q. Jin, J. Qi, D. Mao, M. Yang, Y. Wang, P. Liu, Y. Zhang, Y. Wen, L. Gu, G. Ma, Z. Su, Z. Tang, H. Zhao and D. Wang, Nat. Energy, 2016, 1, 16050 CrossRef CAS
- F. Wang, J. Wang, H. Ren, H. Tang, R. Yu and D. Wang, Inorg. Chem. Front., 2016, 3, 365–369 RSC
- J. Wang, H. Tang, H. Wang, R. Yu and D. Wang, Mater. Chem. Front., 2017, 1, 414–430 RSC
- X. Zhao, J. Wang, R. Yu and D. Wang, J. Am. Chem. Soc., 2018, 140, 17114–17119 CrossRef CAS PubMed
- H. Ren, R. Yu, J. Wang, Q. Jin, M. Yang, D. Mao, D. Kisailus, H. Zhao and D. Wang, Nano Lett., 2014, 14, 6679–6684 CrossRef CAS PubMed
- S. Xu, C. M. Hessel, H. Ren, R. Yu, Q. Jin, M. Yang, H. Zhao and D. Wang, Energy Environ. Sci., 2014, 7, 632–637 RSC
- J. Qi, X. Lai, J. Wang, H. Tang, H. Ren, Y. Yang, Q. Jin, L. Zhang, R. Yu, G. Ma, Z. Su, H. Zhao and D. Wang, Chem. Soc. Rev., 2015, 44, 6749–6773 RSC
- J. Wang, Y. Cui and D. Wang, Adv. Mater., 2018, 1801993 CrossRef PubMed
- J. Wang, L. Liao, Y. Li, J. Zhao, F. Shi, K. Yan, A. Pei, G. Chen, G. Li, Z. Lu and Y. Cui, Nano Lett., 2018, 18, 7060–7065 CrossRef CAS PubMed
- D. Mao, J. Wan, J. Wang and D. Wang, Adv. Mater., 2018, 1802874 CrossRef PubMed
- J. Wang, N. Yang, H. Tang, Z. Dong, Q. Jin, M. Yang, D. Kisailus, H. Zhao, Z. Tang and D. Wang, Angew. Chem., Int. Ed., 2013, 52, 6417–6420 CrossRef CAS PubMed
- C. Zheng, S. Niu, W. Lv, G. Zhou, J. Li, S. Fan, Y. Deng, Z. Pan, B. Li, F. Kang and Q. H. Yang, Nano Energy, 2017, 33, 306–312 CrossRef CAS
- G. Li, X. Wang, M. H. Seo, M. Li, L. Ma, Y. Yuan, T. Wu, A. Yu, S. Wang, J. Lu and Z. Chen, Nat. Commun., 2018, 9, 705 CrossRef PubMed
- C. Barchasz, F. Molton, C. Duboc, J.-C. Leprêtre, S. Patoux and F. Alloin, Anal. Chem., 2012, 84, 3973–3980 CrossRef CAS PubMed
- S. Putla, M. H. Amin, B. M. Reddy, A. Nafady, K. A. Al Farhan and S. K. Bhargava, ACS Appl. Mater. Interfaces, 2015, 7, 16525–16535 CrossRef CAS PubMed
- K. Mi, S. Chen, B. Xi, S. Kai, Y. Jiang, J. Feng, Y. Qian and S. Xiong, Adv. Funct. Mater., 2017, 27, 1604265 CrossRef
- G. Li, W. Lei, D. Luo, Y. Deng, Z. Deng, D. Wang, A. Yu and Z. Chen, Energy Environ. Sci., 2018, 11, 2372–2381 RSC
- G. Xu, A. Kushima, J. Yuan, H. Dou, W. Xue, X. Zhang, X. Yan and J. Li, Energy Environ.
Sci., 2017, 10, 2544–2551 RSC
Footnote |
| † Electronic supplementary information (ESI) available: Preparation of materials, electrochemical and structure characterization, computational method, optimized geometries, and schematic illustration of the cathode configuration. See DOI: 10.1039/c9qm00024k |
| This journal is © the Partner Organisations 2019 |