 Open Access Article
Time-resolved confocal microscopy using lanthanide centred near-IR emission†
Zhiyu Liaoa,
Manuel Tropianob,
Stephen Faulknerb,
Tom Vosch*a and
Thomas Just Sørensen*a
aNano-Science Center & Department of Chemistry, University of Copenhagen, Universitetsparken 5, 2100 København Ø, Denmark. E-mail: tom@chem.ku.dk; TJS@chem.ku.dk
bChemistry Research Laboratory, Oxford University, 12 Mansfield Road, Oxford OX1 3TA, UK
First published on 17th August 2015
Abstract
A method to uniquely identify signals originating from probes with different emission decay times in luminescence imaging has been developed. By using scanning confocal microscopy in combination with time-correlated single photon counting (TCSPC), Photon Arrival Time Imaging (PArTI) has been realised through off-line plotting of images using the photon arrival times. PArTI is the time-equivalent to spectrally resolved imaging, replacing the energy axis with a photon arrival time axis. Here, lanthanide probes were used to demonstrate the key advantages of the method. PArTI uses TCSPC data, involves no fitting, uses a single pulsed laser line for multicolour imaging, and can be used with a 100 millisecond dwell time per pixel.
In cells and tissue, autofluorescence and scattering remain an issue that can limit the sensitivity of imaging microscopy.1,2 Time-resolved microscopy and time-gated microscopy are ideally suited to remove these contributions.3–13 Fluorescence/phosphorescence lifetime imaging (FLIM/PLIM) measures and creates an image of the luminescence decay time of a given molecular probe by fitting the emission decay profile for each pixel,3,6–8,13–18 while time-gated microscopy exploits molecular probes with a decay time significantly longer than the background in order to electronically or mechanically gate the light and thus completely remove background emission without fitting the emission decay curve.3–5,19–37 In some applications, multiple hardware time-gates in combination with a fitting routine have been used previously.38 With lanthanide based probes, time-gated microscopy has been used extensively,3,4,19–22 and examples of FLIM/PLIM images have also been published.21
Lanthanide luminescence is unique as it is well-defined in energy, when compared to transition metals or organic emitters.39–45 Lanthanide centred luminescence is structured in narrow emission bands and a lanthanide complex will have a characteristic, although medium specific, luminescence decay time (τ).46,47 We have recently shown that it is possible to resolve lanthanide luminescence spectrally in order to achieve background free energy-resolved images.25
We now demonstrate a variation on the two time-resolved imaging methods mentioned above, which we have named photon arrival time imaging or PArTI. The method allows us to obtain resolved images by using the differences in emission decay time by applying a procedure where photons in specific arrival time intervals are assigned a colour and then integrated to provide a probe specific contrast. In the example presented here, lanthanide centred luminescence with two different decay times and emission in the near-IR (NIR) was used, though further multiplexing of the technique is readily achievable.
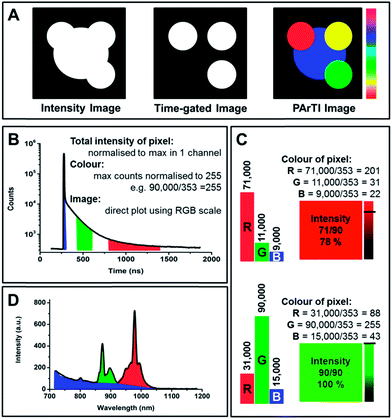
PArTI is explained in detail in Fig. 1, which shows how signals from different probes can be separated on the basis of their emissive lifetimes, since the contribution from each probe will vary depending on the time at which the intensity of emission in measured. Sampling at three time intervals will be sufficient to resolve the nature of the emissive species present. When considering the theoretical example in Fig. 1, it is clear that the long decay time emitter always will have a contribution in all three channels, and pixels where this emitter dominates will never be pure red. If two emitters are present in the same pixel the colour will be close to yellow (depending on the selected arrival time intervals), and with all three emitters the pixel will be shown as white (the arrival time intervals must be optimised accordingly). The amount of light emitted at a given pixel is shown on a percentage scale (Fig. 1). That is every pixel will not only have a specific colour (related only to the arrival times detected in the pixel), but also an intensity, which ranges from the specific colour (100%) to black (0%, no emission).
Lanthanide centred emission offers unique possibilities in both spectrally resolved imaging and PArTI. Narrow and distinct emission bands in a wide range of the visible and NIR spectrum enable the former, while distinct luminescence decay times (from 0.1 to 4000 μs) of the many emission bands resulting from the numerous and widely tunable radiative transitions in the excited state manifold of the trivalent lanthanide ions enable the latter.47
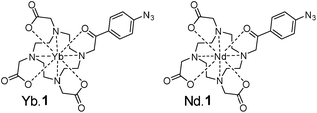
Here, PArTI is demonstrated using silica particle dyed with the neodymium and the ytterbium complex of 1 (Scheme 1), a DO3A ligand with a 4-azidophenacyl antenna chromophore.23,48 While 1 is a good choice for sensitizing terbium and europium, both Eu, Tb and in particular the NIR emitting lanthanides can be sensitised by much more brightly emissive dyes.21,37,49–51 The scope of the PArTI method for time-resolved imaging, as presented below, is readily expanded using stronger chromophores and other emissive lanthanide ions.
Using PArTI has multiple implications: the procedure generates multicolour images without involved fitting protocols, it can be performed with just one pulsed laser source, and the image acquisition is significantly faster than other techniques such as spectrally resolving lanthanide centred emission.25 However, the procedure has one key requirement; the probes must have constant yet significantly different decay times. Here, we chose neodymium and ytterbium based probes. The intrinsic luminescence decay times for these are 0.2 μs and 2.2 μs, respectively, while the background emission from the silica particles and antenna chromophore has a decay time of less than 10 ns. Depending on the TCSPC electronics used, probes with significantly longer lifetimes may be added. The hardware used in this work limits the detection to maximum 5 μs.
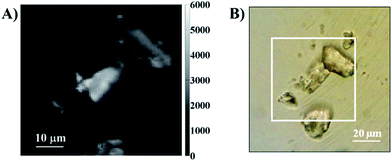
To test the PArTi methodology as outlined in Fig. 1, we dyed silica particles with Yb.1 and Nd.1 (see ESI for details†).23,25 Fig. 2 shows an optical transmission image and a fluorescence intensity image of a random mixture of silica particles dyed with either Yb.1 or Nd.1. The luminescence decay and spectra of the complexes on silica particles are shown in the ESI (Fig. S7 and S8†). The luminescence decay time of the neodymium complex was determined to be τNd = 0.203 μs originating in the 880 nm 4F3/2 – 4I9/2 transition, while that of the ytterbium complex was τYb = 2.24 μs for the 980 nm 2F5/2 – 2F7/2 transition. These decay times are sufficiently different that the ratios of the photons detected in specific arrival time intervals can be used to identify the specific species used to label each particle (Fig. 1).
The samples investigated here all exhibited significant fluorescent background coming from the silica particles and the organic chromophore in the lanthanide complexes.25 The background emission has a nanosecond luminescence decay time and can be imaged and removed using simple time gating. Fig. 3 shows two silica particles imaged using either photons primarily originating from the fluorescent background (Fig. 3A and C blue interval) or the photons arriving in a time interval corresponding to lanthanide centered emission from neodymium and ytterbium (Fig. 3B and C red interval). The images show a strong contribution from background in the total intensity image, and that only approximately 20% of the photons recorded in the image arise from probe emission. If a time gate is applied such that only photons from probe luminescence are detected, the background emission can be removed (Fig. 3B). The remaining background in the image is defined by the dark counts of the detector. In the set-up used here, the background amounts to 20 counts per pixel in the total intensity image (for a 100 ms dwell time). Since these dark counts are distributed over 4096 time-channels, the background is thus limited to about 0.25 counts per pixel for an arrival time interval of 100 channels. This is the strength of time-gated imaging and also the PArTI method.
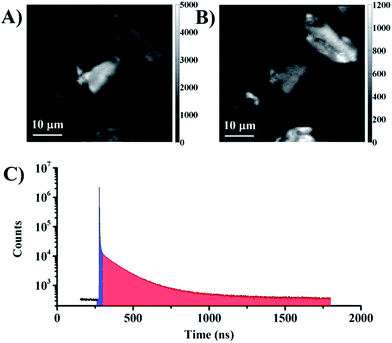 | ||
| Fig. 3 (A) Background emission: intensity image based on the photons with arrival times corresponding to the blue interval in C. (B) Time-gated image: intensity image based on the photons with arrival times corresponding to the red interval in C. (C) Time-resolved emission profile from the whole image (Fig. 2A, total integrations time 1000 s). | ||
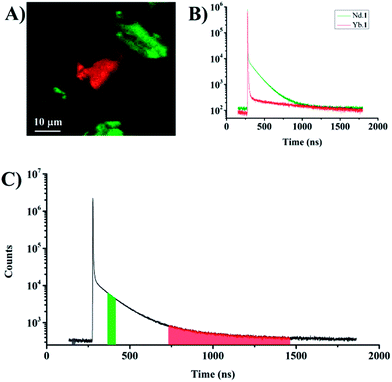
In order to perform PArTI, images are recorded as a TCSPC photon stream using the FIFO mode.52 The TCSPC photon stream contains the information related to the photon arrival time with respect to the start of the experiment (macrotime) and the arrival time of each photon to the next excitation pulse (microtime).52 The macrotime is used to allocate to which pixel in the image each photon belongs (Fig. S4†). The microtime information is commonly used to generate and fit a fluorescence decay curve at each pixel (FLIM), and it can be used to display photons that arrive after a specific time only as in time-gating. The PArTI approach uses specific arrival time intervals to resolve the image using microtime. The procedure operates just like spectrally resolved imaging, where wavelength intervals are selected directly in the experiment using filters or using software in the data when a spectrometer is used (Fig. 1). Fig. 3 was made using the PArTI method to emulate time-gated imaging by choosing the photon arrival time intervals on the full time-resolved emission profile that correspond to background (Fig. 3C blue interval) and probe emission (Fig. 3C red interval). Going from simple time-gating to PArTI allows the images to be resolved (Fig. 1). By selecting specific arrival time intervals we can identify which particle is dyed with which probe, and emission originating from probes such as Yb.1 and Nd.1 is readily separated and identified by using the RGB color scale that is applied to each pixel (Fig. 1). Fig. 4A demonstrates that PArTI can generate multicolour images using lanthanide based probes following excitation by a single laser line.
Fig. 4 shows the PArTI images corresponding to the intensity image in Fig. 2. The figure includes the time-resolved emission profiles from particles dyed with either neodymium or ytterbium containing dyes. Although FLIM may produce lifetime maps that would allow separating the two lanthanides based on their specific decay time, a good fit requires a certain number of photons to be detected in each pixel. With PArTI very few photon are required to obtain resolved images (see Fig. S15†), the total photon count in the brightest pixels is in this example in the range of 2000–3000. In the investigated system this corresponds to ∼150 photons in the selected arrival time intervals used to generate the PArTI image. It may be challenging to use FLIM to create reliable images with such a limited number of detected photons. Rather than a fitting procedure, PArTI relies on the fact that the ratio of photons arriving in given time intervals, following excitation with a specific laser line, is constant. The premise is that the identified photons are very likely to arise from emission from a given probe.‡ Additionally, PArTI has the flexibility to change the specific width of the arrival time intervals to modulate the contrast, this can be done at will from the experimental data. Furthermore, PArTI can, with probes based on lanthanide centred emission, fully suppress the nanosecond background in the sample. Thus the signal to noise is here only defined by the detector dark counts. Here, we have used a single example to demonstrate PArTI in Fig. 4, four additional examples have been included in the ESI.†
To conclude, a method for Photon Arrival Time Imaging (PArTI) has been presented. PArTI can be used to resolve microscopy images using the arrival time of the individual photon, and is different from FLIM and time-gated imaging. The method requires TCSPC and probes with constant but significantly different luminescence decay times, but allows for multicolour auto-fluorescence free images to be recorded and displayed using a RGB colour scale for up to three co-localising probes in a single image. Probes based on kinetically stable lanthanide complexes readily fulfil the PArTI requirements and the next step is to make probes with relevant vectors that allow for the method to be tested in biological systems. Furthermore, the microscopy set-up may be expanded to allow for two-photon excitation of the probes, so that excitation and emission both occur in the biological transparent NIR window.
Acknowledgements
We thank the Universities of Oxford and Copenhagen for support and the Carlsberg Foundation (TJS), the Villum foundation (TV), the “Center for Synthetic Biology” at Copenhagen University funded by the UNIK research initiative of the Danish Ministry of Science, Technology and Innovation (Grant 09-065274, TV, ZL), bioSYNergy (University of Copenhagen's Excellence Programme for Interdisciplinary Research, TV), Christ Church College (MT), and Keble College (TJS, SF) for financial support. We thank Claus Juul Løland and Jesper Nygård for use of equipment.Notes and references
- J. E. Aubin, J. Histochem. Cytochem., 1979, 27, 36–43 CrossRef CAS PubMed.
- H. Andersson, T. Baechi, M. Hoechl and C. Richter, J. Microsc., 1998, 191, 1–7 CrossRef CAS.
- L. Zhang, X. Zheng, W. Deng, Y. Lu, S. Lechevallier, Z. Ye, E. M. Goldys, J. M. Dawes, J. A. Piper, J. Yuan, M. Verelst and D. Jin, Sci. Rep., 2014, 4, 6597 CrossRef CAS PubMed.
- A. Beeby, S. W. Botchway, I. M. Clarkson, S. Faulkner, A. W. Parker, D. Parker and J. A. G. Williams, J. Photochem. Photobiol., B, 2000, 57, 83–89 CrossRef CAS.
- S. Gai, C. Li, P. Yang and J. Lin, Chem. Rev., 2014, 114, 2343–2389 CrossRef CAS PubMed.
- S. W. Botchway, A. W. Parker, R. H. Bisby and A. G. Crisostomo, Microsc. Res. Tech., 2008, 71, 267–273 CrossRef CAS PubMed.
- E. Baggaley, S. W. Botchway, J. W. Haycock, H. Morris, I. V. Sazanovich, J. A. G. Williams and J. A. Weinstein, Chem. Sci., 2014, 5, 879 RSC.
- B. P. Maliwal, R. Fudala, S. Raut, R. Kokate, T. J. Sørensen, B. W. Laursen, Z. Gryczynski and I. Gryczynski, PLoS One, 2013, 8, e63043 CAS.
- R. M. Rich, I. Gryczynski, R. Fudala, J. Borejdo, D. L. Stankowska, R. R. Krishnamoorthy, S. Raut, B. P. Maliwal, D. Shumilov, H. Doan and Z. Gryczynski, Methods, 2014, 66, 292–298 CrossRef CAS PubMed.
- R. M. Rich, D. L. Stankowska, B. P. Maliwal, T. J. Sørensen, B. W. Laursen, R. R. Krishnamoorthy, Z. Gryczynski, J. Borejdo, I. Gryczynski and R. Fudala, Anal. Bioanal. Chem., 2013, 405, 2065–2075 CrossRef CAS PubMed.
- J. C. Bunzli, Chem. Rev., 2010, 110, 2729–2755 CrossRef PubMed.
- J. Zhou, Q. Liu, W. Feng, Y. Sun and F. Li, Chem. Rev., 2015, 115, 395–465 CrossRef CAS PubMed.
- R. M. Rich, D. L. Stankowska, B. P. Maliwal, T. J. Sørensen, B. W. Laursen, R. R. Krishnamoorthy, Z. Gryczynski, J. Borejdo, I. Gryczynski and R. Fudala, Anal. Bioanal. Chem., 2013, 405, 2065–2075 CrossRef CAS PubMed.
- C. Li, M. Yu, Y. Sun, Y. Wu, C. Huang and F. Li, J. Am. Chem. Soc., 2011, 133, 11231–11239 CrossRef CAS PubMed.
- M. Lee, M. S. Tremblay, S. Jockusch, N. J. Turro and D. Sames, Org. Lett., 2011, 13, 2802–2805 CrossRef CAS PubMed.
- S. W. Botchway, M. Charnley, J. W. Haycock, A. W. Parker, D. L. Rochester, J. A. Weinstein and J. A. G. Williams, Proc. Natl. Acad. Sci. U. S. A., 2008, 105, 16071–16076 CrossRef CAS PubMed.
- P. A. Waghorn, M. W. Jones, M. B. M. Theobald, R. L. Arrowsmith, S. I. Pascu, S. W. Botchway, S. Faulkner and J. R. Dilworth, Chem. Sci., 2013, 4, 1430 RSC.
- H. B. Beverloo, A. v. Schadewijk, S. v. Gelderen-Boele and H. J. Tanke, Cytometry, 1990, 11, 784–792 CrossRef CAS PubMed.
- C. P. Montgomery, B. S. Murray, E. J. New, R. Pal and D. Parker, Acc. Chem. Res., 2009, 42, 925–937 CrossRef CAS PubMed.
- A. Thibon and V. C. Pierre, J. Am. Chem. Soc., 2009, 131, 434–435 CrossRef CAS PubMed.
- A. Grichine, A. Haefele, S. Pascal, A. Duperray, R. Michel, C. Andraudd and O. Maury, Chem. Sci., 2014, 5, 3475 RSC.
- G. Vereb, E. Jares-Erijman, P. R. Selvin and T. M. Jovin, Biophys. J., 1998, 74, 2210–2222 CrossRef CAS.
- M. Tropiano and S. Faulkner, Chem. Commun., 2014, 50, 4696–4698 RSC.
- S. V. Eliseeva and J. C. Bunzli, Chem. Soc. Rev., 2010, 39, 189–227 RSC.
- Z. Liao, M. Tropiano, K. Mantulnikovs, S. Faulkner, T. Vosch and T. Just Sørensen, Chem. Commun., 2015, 51, 2372–2375 RSC.
- N. Gahlaut and L. W. Miller, Cytometry, 2010, 77, 1113–1125 CrossRef PubMed.
- L. Charbonniere, R. Ziessel, M. Guardigli, A. Roda, N. Sabbatini and M. Cesario, J. Am. Chem. Soc., 2001, 123, 2436–2437 CrossRef CAS.
- M. Delbianco, V. Sadovnikova, E. Bourrier, G. Mathis, L. Lamarque, J. M. Zwier and D. Parker, Angew. Chem., 2014, 53, 10718–10722 CrossRef CAS PubMed.
- L. J. Charbonniere, N. Hildebrandt, R. F. Ziessel and H. G. Lohmannsroben, J. Am. Chem. Soc., 2006, 128, 12800–12809 CrossRef CAS PubMed.
- N. Weibel, L. J. Charbonniere, M. Guardigli, A. Roda and R. Ziessel, J. Am. Chem. Soc., 2004, 126, 4888–4896 CrossRef CAS PubMed.
- D. Geißler, S. Stufler, H.-G. Löhmannsröben and N. Hildebrandt, J. Am. Chem. Soc., 2012, 135, 1102–1109 CrossRef PubMed.
- B. Song, C. D. Vandevyver, A. S. Chauvin and J. C. Bunzli, Org. Biomol. Chem., 2008, 6, 4125–4133 CAS.
- G. Lapadula, A. Bourdolle, F. Allouche, M. P. Conley, I. d. Rosal, L. Maron, W. W. Lukens, Y. Guyot, C. Andraud, S. Brasselet, C. Copeéret, O. Maury and R. A. Andersen, Chem. Mater., 2014, 26, 1062–1073 CrossRef CAS.
- E. Deiters, B. Song, A. S. Chauvin, C. D. Vandevyver, F. Gumy and J. C. Bunzli, Chem.–Eur. J., 2009, 15, 885–900 CrossRef CAS PubMed.
- H. E. Rajapaksea, N. Gahlauta, S. Mohandessia, D. Yub, J. R. Turnerb and L. W. Miller, Proc. Natl. Acad. Sci. U. S. A., 2010, 107, 13582–13587 CrossRef PubMed.
- A. Picot, F. Malvolti, B. le Guennic, P. L. Baldeck, J. A. G. Williams, C. Andraud and O. Maury, Inorg. Chem., 2007, 46, 2659–2665 CrossRef CAS PubMed.
- A. Picot, A. D'Aléo, P. L. Baldeck, A. Grichine, A. Duperray, C. Andraud and O. Maury, J. Am. Chem. Soc., 2008, 130, 1532–1533 CrossRef CAS PubMed.
- C. J. de Grauw and H. C. Gerritsen, Appl. Spectrosc., 2001, 55, 670–678 CrossRef CAS.
- J. C. G. Bünzli, Acc. Chem. Res., 2006, 39, 53–61 CrossRef PubMed.
- J. W. Snyder, I. Zebger, Z. Gao, L. Poulsen, P. K. Frederiksen, E. Skovsen, S. P. McIlroy, M. Klinger, L. K. Andersen and P. R. Ogilby, Acc. Chem. Res., 2004, 37, 894–901 CrossRef CAS PubMed.
- N. Johnsson and K. Johnsson, ACS Chem. Biol., 2007, 2, 31–38 CrossRef CAS PubMed.
- L. D. Lavis and R. T. Raines, ACS Chem. Biol., 2008, 3, 142–155 CrossRef CAS PubMed.
- J. Bosson, J. Gouin and J. Lacour, Chem. Soc. Rev., 2014, 43, 2824–2840 RSC.
- M. Y. Berezin and S. Achilefu, Chem. Rev., 2010, 110, 2641–2684 CrossRef CAS PubMed.
- M. S. T. Goncalves, Chem. Rev., 2009, 109, 190–212 CrossRef CAS PubMed.
- A. Beeby, I. M. Clarkson, R. S. Dickins, S. Faulkner, D. Parker, L. Royle, A. S. de Sousa, J. A. G. Williams and M. Woods, J. Chem. Soc., Perkin Trans. 2, 1999, 493–504 RSC.
- J.-C. Bünzli and S. Eliseeva, in Lanthanide Luminescence, ed. P. Hänninen and H. Härmä, Springer Berlin Heidelberg, 2011, vol. 7, pp. 1–45 Search PubMed.
- M. Tropiano, A. M. Kenwright and S. Faulkner, Chem.–Eur. J., 2015, 21, 5697–5699 CrossRef CAS PubMed.
- A. Foucault-Collet, K. A. Gogick, K. A. White, S. Villette, A. Pallier, G. Collet, C. Kieda, T. Li, S. J. Geib, N. L. Rosi and S. Petoud, Proc. Natl. Acad. Sci. U. S. A., 2013, 110, 17199–17204 CrossRef CAS PubMed.
- A. Foucault-Collet, C. M. Shade, I. Nazarenko, S. Petoud and S. V. Eliseeva, Angew. Chem., 2014, 53, 2927–2930 CrossRef CAS PubMed.
- D. G. Smith, B. K. McMahon, R. Pal and D. Parker, Chem. Commun., 2012, 48, 8520–8522 RSC.
- W. Becker, Advanced Time-Correlated Single Photon Counting Techniques, Springer Berlin Heidelberg, Berlin Heidelberg, 2005 Search PubMed.
Footnotes |
| † Electronic supplementary information (ESI) available: Spectroscopic characterisation, methods and materials, additional imaging examples and details on data analysis. See DOI: 10.1039/c5ra15759e |
| ‡ This is similar to the premise of energy resolved experiments: an energy interval is selected with a filter or spectrometer and photons arriving in this interval are assigned to the probe. |
| This journal is © The Royal Society of Chemistry 2015 |

