NiO nanostructures: synthesis, characterization and photocatalyst application in dye wastewater treatment
Fereshteh Motaharia,
Mohammad Reza Mozdianfard*a,
Faezeh Soofivandb and
Masoud Salavati-Niasari*b
aDepartment of Chemical Engineering, Faculty of Engineering, University of Kashan, P. O. Box. 87317-51167, Kashan, I. R. Iran
bInstitute of Nano Science and Nano Technology, University of Kashan, P. O. Box.87317-51167, Kashan, I. R. Iran. E-mail: salavati@kashanu.ac.ir; Fax: +98 361 5552935; Tel: +98 361 5912383
First published on 29th May 2014
Abstract
Nickel oxide (NiO) nanostructures have been prepared via a thermal decomposition method. Nanostructures were prepared by calcining β-Ni(OH)2 at various temperatures. H2(pnAA2), 1,3-propylenediamine, nickel nitrate, NaOH and acetyl acetonate were applied as starting reagents to fabricate the NiO nanostructures. The band gap was 2.83 eV, confirming the semi-conductive nature of the prepared NiO nanostructures and indicating its potential as a photocatalyst in effluent treatment. UV irradiation times, quantity of catalyst, pH and dye concentration were investigated by degrading Rhodamine B (RB, C28H31N2O3Cl) dye. These crucial factors indicated that the NiO nanostructures are an effective photocatalyst. Kinetic investigations of photodegradation revealed that the reactions followed the improved Langmuir–Hinshelwood model. The as-produced nanostructures were characterized using XRD, FESEM, FT-IR, UV-vis, VSM and BET.
Introduction
Dye pollutants play an active role in contaminating aquatic ecosystems and are known as ecological hazards in polluting the environment. However, almost 15% of the total world production of dyes is lost in the effluents of the dying process.1 With increasing water shortages and public awareness towards the threats posed by industrial effluents, international environmental standards are becoming more stringent across the world, leading to the development of technological systems and methods to remove dyes and other organic pollutants. Traditional processes for treating such effluents are insufficient, considering the quantity of wastewater involved. Combined methods including coagulation, electrochemical oxidation and active sludge have recently been investigated.2 There are also reports on employing methods including coagulation–flocculation,3 reverse osmosis4 and adsorption on activated carbon5 for this purpose. The main drawback on such approaches however, is the creation of a more concentrated pollutant-containing phase.Amongst the promising chemical treatments, recent developments in oxidative degradation of organic compounds has led to a process called “advanced oxidation process”, where at times, heterogeneous photocatalysis is employed to mineralize the majority of the organic pollutants.6 Photocatalysis may be termed as a photoinduced reaction, which is accelerated by the presence of a catalyst.7 These types of reactions are activated by the absorption of a photon with sufficient energy, which equals or is higher than the band-gap energy (Eg) of the catalyst.8 Absorption of photons produces electron–hole pairs on the catalyst surface, which in turn can reduce or oxidize the organic materials present in aqueous solutions. The main advantage of applying such a technique is its potential to convert the organic pollutants into nontoxic species (CO2, H2O) with no need for further separation processes. Blake9 listed groups of degradable organic pollutants by photocatalysis where data was provided for the compound dissolved in water with a UV-illuminated TiO2. Nano metal oxides were also studied as photocatalysts in the 1990's to decompose the organic pollutants in water.10 TiO2,11 ZnO12 and more recently, NiO13 and Ag2CrO4,14 semiconducting metal oxides were considered for this purpose due to their catalytic activity and stability.
NiO is a p-type semiconductor with a wide band gap between the valence and conduction bands, making it specifically suitable as a photocatalyst.15 Several methods for the synthesis of NiO nanostructures have been reported: anodic arc plasma method,16 sol gel,17 precipitation,18 low pressure spray pyrolysis,19 solvothermal,20 sonochemistry,21 combustion,22 microwave,23 pulsed-laser ablation24 and thermal decomposition.25 Thermal decomposition of nickelous precursors, especially Ni(OH)2, has commonly been employed by many researchers. Wang et al.26 prepared particles of an average 10 nm size by a solid-state reaction using nickel acetate, sodium hydroxide and Tween 80 as a dispersant followed by 2 h sintering at 400 °C. The Ni(OH)2 particles were also formed by a microemulsion technique using rhamnolipids as the surfactant along with n-heptane and water27 that was then calcined to obtain the NiO nanoparticles. Zhu et al.28 prepared the first Ni(OH)2 with a flower-like morphology and used it as a precursor to a microwave-assisted hydrothermal method to obtain NiO nanoflowers.
Hydrothermal methods have also been used in the preparation of Ni(OH)2 lately, which offers advantages such as high purity, simplicity, variation in nanostructures, smaller and more coherent particles. β-Ni(OH)2 nanoplates were synthesized hydrothermally and annealed at 400 °C for about 2 h to produce porous NiO nanostructures.29 Short nanowires, and β-Ni(OH)2 nanoplates in high yields and purities were prepared hydrothermally under mild conditions from simple systems composed of NaOH, NiSO4, and water.30 There is also a report of mesoporous nanosheets of single-crystalline β-Ni(OH)2 being prepared hydrothermally using Ni(NO3)2·6H2O as the precursor in a mixed solution of NaOH and SDBS. Considering the benefits of photocatalysis in wastewater treatment and the need for high quality, large scale NiO nanostructures, research was carried out on producing this material using calcination of β-Ni(OH)2 prepared hydrothermally, but with the aid of a more economic stabilizer. This work is an attempt to do so using a more accessible and cost-effective Schiff base ligand as the stabilizer, and was tested on removing a common dye (RB) from xanthene group employed in paper and laser dying.31
Experimental
Materials
NiO nanostructures and the H2(pnAA2) ligand were prepared, using the following materials, purchased from Aldrich: acetyl acetonate (AA), 1,3-propylenediamine (pn), nickel nitrate (Ni(NO3)2·6H2O) and NaOH. RB was obtained from the Merck (Germany).Preparation of the H2(pnAA2) ligand
The H2(pnAA2) ligand was prepared by adding 0.025 mol of 1,3-propylenediamine dissolved in methanol to a stirred suspension of 0.05 mol of acetylacetone in the same solvent. The reaction mixture was heated under reflux for 4 h until H2(pnAA2) was formed. The solid product was recrystallized using methanol before it was dried in a vacuum oven at 50 °C, and then characterized using FT-IR and 1H-NMR.Preparation of the NiO nanostructures
For preparing β-Ni(OH)2, 10 mmol of Ni(NO3)2·6H2O was added to 100 mL of distilled water in a 250 mL beaker and stirred for 5 min. In a second beaker, 0.001 mol of H2(pnAA2) and 0.0625 mol of NaOH were dissolved in 100 mL distilled water, and the solution was added dropwise to the 250 mL beaker and stirred continuously for 20 min to form a clear solution. The latter solution was transferred into a Teflon-lined stainless steel autoclave and maintained at 180 °C for 24 h under autogenous pressure. The solution was then allowed to cool naturally to room temperature. Following the completion of the reaction, the resulting green solid products were washed with distilled water and dried in oven at 50 °C. Finally, the products were calcined at 700 °C and 750 °C for 6 h to obtain the NiO nanostructures.Photocatalytic characterization
The degradation of RB in an aqueous solution under UV radiation was performed having assessed the photocatalytic activity of NiO by a 400 W UV tube (Osram ultraviolet lamp) placed at a fixed distance of 40 cm away from the reaction vessel. Further, 100 mL of the dye solution (prepared by mixing certain concentrations of NiO nanostructures, RB and distilled water), was stirred for 30 min in the dark to ensure proper adsorption–desorption equilibrium of the dye molecules on the nanostructures surface required to act as an efficient photocatalyst. To maintain the solution oxygen-saturated throughout the reaction, air was blown into the vessel via a pump. Then, NiO was separated from the 5 cm3 samples taken from the degraded solution at various time intervals, by centrifuging for 10 min at 10![[thin space (1/6-em)]](https://www.rsc.org/images/entities/char_2009.gif) 000 rpm. The dye concentration was determined with the aid of a UV-vis spectrophotometer, having monitored the optical absorption peak of RB at 553 nm.
000 rpm. The dye concentration was determined with the aid of a UV-vis spectrophotometer, having monitored the optical absorption peak of RB at 553 nm.
The Langmuir–Hinshelwood model32 was used for the kinetics of the photodegradation reaction. This model may be described as:
| r = −dc/dt = Kkc/(1 + KC) | (1) |
| r = −Dc/dt = kappC | (2) |
Integrating eqn (2) results in:
| ln(Co/Ct) = kappt | (3) |
Characterization
The crystalline phase of the synthesized NiO catalysts was analyzed using a diffractometer from the Philips Company with X'PertPro monochromatized Cu Kα radiation (λ = 1.54 Å). The BET surface area was measured by nitrogen adsorption (Micromeritics Tri-Star 3020). The UV-vis and FT-IR spectra were recorded on a Perkin-Elmer Lambda 800 UV-vis spectrophotometer and a Nicolet 550 FT-IR spectrometer, respectively. 1H-NMR spectra were recorded on a Bruker (400 MHz) spectrometer in acetone-d6. FESEM images were obtained on a Hitachi S-4160 Field-Emission scanning electron microscope. UV-vis absorption spectra of the RB solution were recorded on a Perkin Elmer UV/vis Lambda 2S ultraviolet-visible spectrophotometer. Magnetic properties were measured using a vibrating sample magnetometer (BHV-55, Riken, Japan).Results and discussion
Structural properties of ligand, NiO and Ni(OH)2
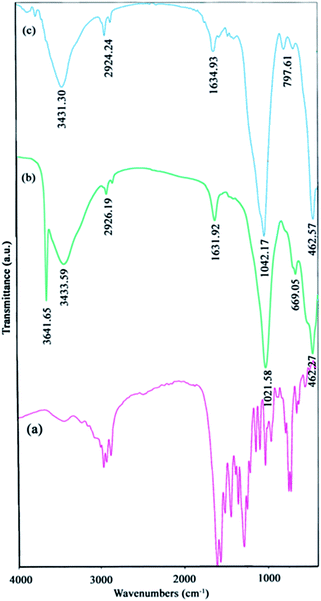
![[double bond, length as m-dash]](https://www.rsc.org/images/entities/char_e001.gif) O and C
O and C![[double bond, length as m-dash]](https://www.rsc.org/images/entities/char_e001.gif) N, respectively, conforming well to those results obtained for the H2(pnAA2) ligand. It should be noted that the peaks present at around 1510 cm−1 and 3000 cm−1 in the spectrum correspond to the vibrations of the C–N group, left from the residual amine during the synthesis of H2(pnAA2). However, FT-IR is a qualitative analysis while NMR is often used for the quantitative examination and better ligand specification.
N, respectively, conforming well to those results obtained for the H2(pnAA2) ligand. It should be noted that the peaks present at around 1510 cm−1 and 3000 cm−1 in the spectrum correspond to the vibrations of the C–N group, left from the residual amine during the synthesis of H2(pnAA2). However, FT-IR is a qualitative analysis while NMR is often used for the quantitative examination and better ligand specification.
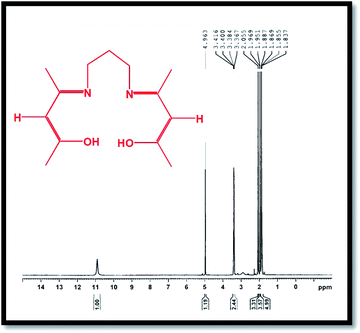
The 1H-NMR spectrum of the H2(pnAA2) ligand is presented in Fig. 2, which conforms with the bonding structure of the H2(pnAA2) as follows: δ (ppm): 10.9 (s, 2H, OH); 4.963 (s, 2H, –CH–); 3.367–3.416 (m, 4H, –CH2–), 2.055 (s, 6H, –CH3); 1.951–1.969 (d, 6H, –CH3); 1.837–1.887 (m, 2H, –CH2–). As can be seen, both FT-IR and 1H-NMR analysis confirm the purity of the Schiff base ligand prepared.
FT-IR analysis of NiO and Ni(OH)2
The FT-IR spectra [Fig. 1(b and c)] reveal the chemical information and major functional groups in Ni(OH)2 and NiO. The sharp peak at 3641 cm−1 in Fig. 1(b) corresponds to the stretching vibrational mode (νOH) of the non-hydrogen bonded hydroxyl groups in the nickel hydroxide. The bands at 2924 cm−1 in Fig. 1(b and c) and also at 669 cm−1 in Fig. 1(b) correspond to the C–H stretching modes, and the peaks around 1021 cm−1 [Fig. 1(b and c)] and 797 cm−1 [Fig. 1(c)], indicate the C–N and C![[double bond, length as m-dash]](https://www.rsc.org/images/entities/char_e001.gif) O stretch bands, respectively. All these peaks show that the H2(pnAA2) ligand was indeed capped on the surface of the particles. It should be noted that the Ni–O band appears at around 462 cm−1 [Fig. 1(b and c)]. Also, peaks at 1631 cm−1 and 3431 cm−1 indicate the two samples of Ni(OH)2 and NiO contained traces of water.
O stretch bands, respectively. All these peaks show that the H2(pnAA2) ligand was indeed capped on the surface of the particles. It should be noted that the Ni–O band appears at around 462 cm−1 [Fig. 1(b and c)]. Also, peaks at 1631 cm−1 and 3431 cm−1 indicate the two samples of Ni(OH)2 and NiO contained traces of water.
NiO and Ni(OH)2 XRD analysis
Fig. 3(a) shows the XRD pattern of β-Ni(OH)2 prepared as described in Section 2.4. All diffraction peaks can be indexed to the pure hexagonal phase of β-Ni(OH)2 (JCPDS 01-1047). No peaks corresponding to any impurities are observed. Fig. 3(b) gives the XRD pattern of NiO prepared from the calcination of Ni(OH)2 at 700 °C, with some degree of Ni(OH)2 impurities. Following further calcinations up to 750 °C, complete conversion of β-Ni(OH)2 to NiO, as all the diffraction peaks in Fig. 3(c), can be indexed to NiO with lattice parameters a = b = c = 4.17 and JCPDS 78-0423. Using Debye–Sherrer equation,34 the particle size of the prepared NiO from the XRD results was found to be about 6 nm.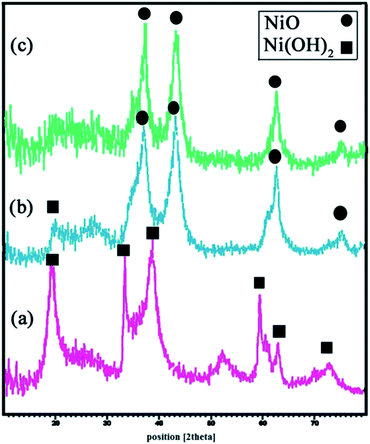 | ||
| Fig. 3 XRD patterns of (a) β-Ni(OH)2, (b and c) 6 hours calcined β-Ni(OH)2 at 700 °C and 750 °C, respectively. | ||
FESEM and TEM analysis
FESEM images of Ni(OH)2, Ni(OH)2 calcined at 700 °C and 750 °C are presented in Fig. 4(a–c), respectively. With increasing calcination temperature from 700 °C to 750 °C in period of 6 h, the morphology of products change from irregular agglomerated nanoparticles to 2-dimensional nanostructures (sheetlike), consisting of ultrafine particles, which arranged and created a uniform and sheetlike structures. Fig. 4(d) shows TEM image of the Ni(OH)2 calcined at 750 °C for 6 h, indicating regular spherical morphology with an average size of about 10 nm. The presence of ultrafine particles proved by a TEM image that is shown morphology and particle size exactly.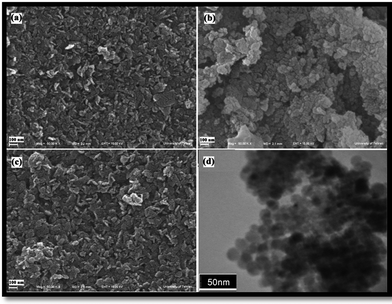 | ||
| Fig. 4 FESEM images of (a) Ni(OH)2 and Ni(OH)2 calcined at (b) 700 °C and (c) 750 °C, and (d) TEM image of Ni(OH)2 calcined at 750 °C. | ||
UV-vis analysis of NiO
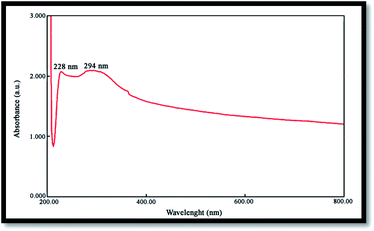
The band gap is a significant parameter in determining the characteristics of semiconductor and nanomaterials employed in solar industries and are often determined from the UV absorption spectrum. Fig. 5 shows the UV-vis spectrum of NiO nanoparticles obtained by the calcination of Ni(OH)2 at 750 °C, where the corresponding absorption edge appears at 228 and 294 nm. The peak around 228 nm can be attributed to the electronic transitions from the ionized oxygen vacancies to the valence band of the metal oxide, resulting from the defects at the nanostructures surface.35 Optical band gap (Eg) may be evaluated based on the optical absorption spectrum using the following equation:20| (Ahυ)n = B(hυ − Eg) | (4) |
The optical band gap for the absorption peak was obtained by extrapolating the linear portion of the (Ahυ)n curve versus hυ to zero. No linear relation was found for n = 1/2, suggesting that the as-prepared NiO nanoparticles are semiconductors with direct transition at this energy. Eg was found to be 2.83 eV for the NiO sample, confirming its potential employment as a photocatalyst.
Magnetic properties of NiO
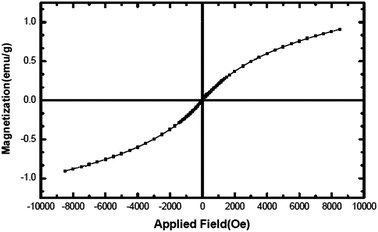
Fig. 6 shows the hysteresis loop of the NiO nanoparticles at 300 K, indicating that the nanoparticles behave like a superparamagnetic material.36 The maximum magnetic field applied (8.5 kOe), could not saturate the magnetization (which is 0.9 emu g−1 at this applied field). The non-saturation of magnetization, very low coercive field, Hc, (2.2 Oe) and small remanent magnetization, Mr, (0.002 emu g−1) are the characteristics of a superparamagnetic material. NiO should normally behave like an antiferromagnetic material; however, superparamagnetism observed here may be contributed towards the magnetic moment arising from other sources such as the presence of a non-stoichiometric ratio of Ni/O or the presence of Ni3+ ions in the sample.37Specific surface area and porosity of NiO
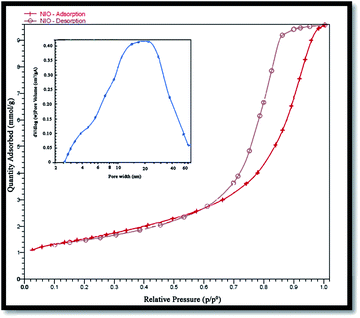
Surface area and porosity of the prepared NiO nanoparticles were also investigated using Brunauer–Emmett–Teller (BET) analysis and an N2 adsorption–desorption isotherm. Fig. 7 shows the N2 adsorption–desorption isotherm, and the pore-size distribution of the nanoparticles. The corresponding textural properties have been summarized in Table 1. Evidently, the sample is a typical type IV with the hysteresis loop being type H2, indicating it to be a mesoporous material38 with a BET specific surface area of 52.57 m2 g−1 that is reasonable for a photocatalyst. The pore size distribution curve was obtained from the desorption branch of the isotherms by the Barrett–Joyner–Halenda (BJH) method.| Average pore size (nm) | BET surface (m2 g−1) | Total pore volume (cm3 g−1) |
|---|---|---|
| 9.77 | 52.57 | 0.21 |
Photocatalytic properties of NiO
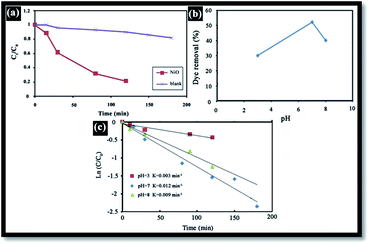
Generally, in the photocatalytic degradation of dyes in wastewater treatment, the followings operating parameters play an important role: the pH of the precursor solution (catalyst solution during the preparation of catalyst), oxidizing agent, calcination temperature, dopant content, dye concentration, catalyst loading, light intensity, effect of inorganic ions and temperature.39 In this work, the effects of the pH of solution, catalyst loading and dye concentration were investigated. To demonstrate the effectiveness of NiO as a photocatalyst, RB degradation tests were carried out without NiO. Fig. 8(a) illustrates the RB relative degradation Ct/C0 (Ct and C0 are the equilibrium concentration of RB after and before UV irradiation, respectively) versus UV light irradiation time with and without the presence of the NiO photocatalyst. In this work, UV irradiation without NiO for 120 min, results in only 10% degradation; however, in presence of the photocatalyst, this is 80%.Effect of pH
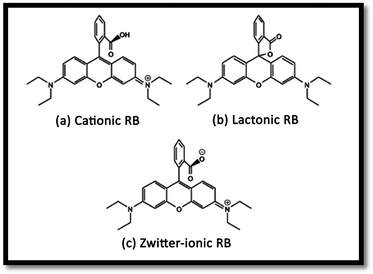
The effect of pH on the efficiency of the dye photodegradation process is difficult to interpret due to its multiple roles.40 The apparent pseudo-first-order constant rate kapp of the reaction indicates the rate at which degradation takes place and is used here to investigate the effects of pH, dye and NiO concentration on the degradation process. The kapp data were obtained by plotting the linear transform ln(C0/Ct) versus the irradiation time to derive the slope kapp according to eqn (3). Fig. 8(c) shows the photodegradation of RB using different initial pH and several duration times. For adjusting the pH of the dye solutions, dilute solutions of H2SO4 and NaOH were used. As can be seen, a variation in pH from 3 to 8 greatly influenced the photo-assisted degradation for almost all the duration times investigated. The kapp reduced as the pH increased from 7 to 8. However, a drastic decrease of kapp was noted at pH = 3. The highest rate constant was achieved at pH = 7. In other similar studies, pH changes have been reported to have influenced the adsorption of dye molecules onto the surfaces of TiO2.41 The pH of the solution can affect the mode and extent of RB adsorption on the NiO surface.42 However, dye adsorption on the photocatalyst surface is the second step of the photocatalytic process,43 and pH affects the RB photodegradation rate indirectly. To clarify the relationship between the extent of adsorption and the photodegradation process, the influence of pH on the adsorption of RB onto the catalyst surface was examined at 20 °C, for a testing duration of 12 h with a NiO dose of 1 g L−1 and RB concentration of 10 mg L−1. As can be seen in Fig. 8(b), the maximum adsorption takes place at pH = 7. This is perhaps due to the ensuing formation of different ionic species and NiO surface charges. As reported in the literature,44 at pH less than 7, the RB ions are able to enter into the porous structure. At higher pH values, the zwitterion form of RB in water exists more than at lower pH, the aggregation of RB is increased and bigger molecules (dimer) are formed, making those incapable of entering into the porous structure of the NiO surface. The greater aggregation of the zwitterionic form is due to the attractive electrostatic interactions between the carboxyl and xanthane groups of the RB monomer. It is noteworthy that in the liquid phase, RB can exist in three conformations: cationic, lactonic and zwitterionic, as shown in Fig. 9. While cationic and zwitterionic conformations exist in polar solvents, cationic in acidic and zwitterionic in basic solutions, lactonic is only found in non-polar or polar aprotic solvents. The dye removal percentage is calculated as follows: Dye removal (%) = C0 − Ce)/C0 × 100; where: C0 and Ce (mg L−1) are the initial and equilibrium concentrations of the dye in the solution.Effect of RB concentration
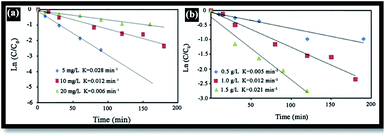
The effect of RB initial concentration (5, 10 and 20 mg L−1) on the removal efficiency of RB at pH = 7 was also investigated. Increases in the dye concentration led to decrease in the rate constant [Fig. 10(a)]. Hence, the photo-oxidation process will work faster at a low concentration of pollutants. At high concentrations of dye, the deeper colored solution is less transparent to UV light, and the dye molecules may absorb a significant amount of UV light, causing less light to reach the catalyst and thus reducing the OH˙ radical formation. Since OH˙ plays a significant role in attacking the dye molecules, lowering its concentration would cause the photodegradation efficiency to decrease.40Effect of catalyst dosage
The catalyst dosage is also an important parameter in optimizing the operational conditions. Here, the effect of catalyst dosage on the degradation of RB was investigated using a catalyst dosage ranging from 0.5 to 2 g L−1 [see Fig. 10(b)]. Results indicate that the rate constant gradually increases as the catalyst dosage increases from 0.5 to 2 g L−1. This may be attributed in terms of availability of the active sites on the photocatalyst surface and the penetration of UV light through the water, leading to an increase in the dye degradation.45Conclusion
In this study, β-Ni(OH)2 nanostructures were prepared via a hydrothermal method using a cost-effective stabilizer ligand. In the second step, NiO nanoparticles with high purity were prepared by calcining β-Ni(OH)2 at a temperature of 750 °C for the photocatalytic degradation of RB dye in wastewater treatment. Different analysis techniques including XRD, FESEM, VSM, FT-IR, UV-vis and BET were used to characterize the photocatalyst properties. The band gap of the NiO nanoparticles was 2.83 eV confirming the semi-conductive nature of the NiO and its potential use as an effective photocatalyst. In this work, variables such as dye concentration, initial pH and the amount of photocatalyst influenced significantly the photoactivated process. This study provides a basis for successful and cost effective preparation of NiO nanoparticles exhibiting highly efficient photocatalytic activity, with promising applications in wastewater treatments of industrial dyes, such as RB.Acknowledgements
The authors are grateful to the council of University of Kashan for providing financial support to undertake this work.Notes and references
- H. Zollinger, Science, Wiley-VCH, Weinheim, Germany, 2nd rev. edn, 1991 Search PubMed.
- S. H. Lin and C. F. Peng, Water Res., 1996, 30, 587 CrossRef CAS.
- B. H. Tan, T. T. Teng and A. K. M. Omar, Water Res., 2000, 34, 597 CrossRef CAS.
- K. L. Alexander, S. Alt, E. Owens, M. V. Patel and L. McGovern, Proc. AWWA Memb. Technology Cont., Atlanta, GA, 2003 Search PubMed.
- J. M. Chern and C. Y. Wu, Water Res., 2001, 35, 4159 CrossRef CAS.
- J. M. Herrmann, F. Jansen and R. A. van Santen, Catalytic Science Series, Imperial College Press, London, 1999, p. 171 Search PubMed.
- A. Mills and S. L. Hunte, J. Photochem. Photobiol., A, 1997, 108, 1 CrossRef CAS.
- O. Carp, C. L. Huisman and A. Reller, Solid State Chem., 2004, 32, 33 CrossRef CAS PubMed.
- D. M. Blake, National Renewable Energy Laboratory, Golden Co, 1997 Search PubMed.
- X. B. Chen and S. S. Mao, Chem. Rev., 2007, 107, 2891 CrossRef CAS PubMed.
- R. K. Wahi, W. W. Yu, Y. Liu, M. L. Mejia, J. C. Falkner, W. Nolte and V. L. Colvin, J. Mol. Catal. A: Chem., 2005, 242, 48 CrossRef CAS PubMed.
- H. Wang, Z. Wu, Y. Liu and Z. Sheng, J. Mol. Catal. A: Chem., 2008, 287, 176 CrossRef CAS PubMed.
- H. Duan, X. Zheng, S. Yuan, Y. Li, Z. Tian, Z. Deng and B. Su, Mater. Lett., 2012, 81, 245 CrossRef CAS PubMed.
- F. Soofivand, F. Mohandes and M. Salavati-Niasari, Mater. Res. Bull., 2013, 48, 2084 CrossRef CAS PubMed.
- F. Augusto, E. Carasek, R. G. C. Silva, S. R. Rivellino, A. D. Batista and E. A. Martendal, J. Chromatogr. A, 2010, 1217, 2533 CrossRef CAS PubMed.
- Z. Wei, T. Xia, L. Bai, J. Wang, Z. Wu and P. Yan, Mater. Lett., 2006, 60, 766 CrossRef CAS PubMed.
- Q. Li, L. S. Wang, B. Y. Hu, C. Yang, L. Zhou and L. Zhang, Mater. Lett., 2007, 61, 1615 CrossRef CAS PubMed.
- J. Li, R. Yan, B. Xiao, D. T. Liang and D. H. Lee, Energy Fuels, 2008, 22, 16 CrossRef CAS.
- W. N. Wang, Y. Itoh, I. W. Lenggoro and K. Okuyama, Mater. Sci. Eng., B, 2004, 111, 69 CrossRef PubMed.
- K. Anandan and V. Rajendran, J. Nanosci. Nanotechnol., 2012, 2, 24 CrossRef.
- S. Mohseni Meybodi, S. A. Hosseini, M. Rezaee, S. K. Sadrnezhaad and D. Mohammadyani, Ultrason. Sonochem., 2012, 19, 841 CrossRef CAS PubMed.
- N. M. Deraz, Int. J. Electrochem. Sci., 2012, 7, 4608 CAS.
- X. Song and L. Gao, J. Am. Ceram. Soc., 2008, 91, 3465 CrossRef CAS PubMed.
- L. Zbroniec, T. Sasaki and N. Koshizaki, J. Ceram. Process Res., 2005, 6, 134 Search PubMed.
- F. Davar, Z. Fereshteh and M. Salavati-Niasari, J. Alloys Compd., 2009, 476, 797 CrossRef CAS PubMed.
- Y. Wang, J. Zhu, X. Yang, L. Lu and X. Wang, Thermochim. Acta, 2005, 437, 106 CrossRef CAS PubMed.
- P. Palanisamy and A. M. Raichur, Mater. Sci. Eng., C, 2009, 29, 199 CrossRef CAS PubMed.
- Z. Zhu, N. Wei, H. Liu and Z. He, Adv. Powder Technol., 2011, 22, 422 CrossRef CAS PubMed.
- X. Zhang, W. Shi, J. Zhu, W. Zhao, J. Ma, S. Mhaisalkar, T. L. Maria, Y. Yang, H. Zhang, H. H. Hng and Q. Yan, Nano Res., 2010, 3, 643 CrossRef CAS PubMed.
- L. Dong, Y. Chu and W. Sun, Chem.–Eur. J., 2008, 14, 5064 CrossRef CAS PubMed.
- E. G. L. Oliveira, J. J. Rodrigues Jr and H. P. de Oliveira, Chem. Eng. J., 2011, 172, 96 CrossRef CAS PubMed.
- C. N. Satterfield, Mass Transfer in Heterogeneous Catalysis, MIT Press, Cambridge, 1970, p. 177 Search PubMed.
- J. M. Herrmann, Catal. Today, 1999, 53, 115 CrossRef CAS.
- A. Sobhani, M. Salavati-Niasari and S. M. Hosseinpour-Mashkani, J. Cluster Sci., 2012, 23, 1143 CrossRef CAS.
- H. Zeng, W. Cai, P. Liu, X. Xu, H. Zhou, C. Klingshirn and H. Kalt, ACS Nano, 2008, 2, 1661 CrossRef CAS PubMed.
- M. Salavati-Niasari, F. Mohandes, F. Davar, M. Mazaheri, M. Monemzadeh and N. Yavarinia, Inorg. Chim. Acta, 2009, 362, 3691 CrossRef CAS PubMed.
- N. M. Deraz, Curr. Appl. Phys., 2012, 12, 928 CrossRef PubMed.
- S. Jun, S. H. Joo, R. Ryoo, M. Kruk, M. Jaroniec, Z. Liu, T. Ohsuna and O. Terasaki, J. Am. Chem. Soc., 2000, 122, 10712 CrossRef CAS.
- U. G. Akpan and B. H. Hameed, J. Hazard. Mater., 2009, 170, 520 CrossRef CAS PubMed.
- I. K. Konstantinou and T. A. Albanis, Appl. Catal., B, 2004, 49, 1 CrossRef CAS PubMed.
- M. A. Fox and M. T. Dulay, Chem. Rev., 1993, 93, 341 CrossRef CAS.
- H. Fu, C. Pan, W. Yao and Y. Zhu, J. Phys. Chem. B, 2005, 109, 22432 CrossRef CAS PubMed.
- K. Pirkanniemi and M. Sillanpaa, Chemosphere, 2002, 48, 1047 CrossRef CAS.
- S. Ramuthai, V. Nandhakumar, M. Thiruchelvi, S. Arivoli and V. Vijayakumaran, Eur. J. Chem., 2009, 6, S363 CAS.
- K. Byrappa, A. K. Subramani, S. Ananda, K. M. Lokanatha Rai, R. Dinesh and M. Yoshimura, Bull. Mater. Sci., 2006, 29, 433 CrossRef CAS.
| This journal is © The Royal Society of Chemistry 2014 |

