 Open Access Article
Creative Commons Attribution 3.0 Unported Licence
Exploration of bismuth-based materials for photocatalytic decomposition of N2O†
Shalu
Atri
 *a,
Sitharaman
Uma
 b,
Rajamani
Nagarajan
 b,
Maros
Gregor
c,
Tomas
Roch
c,
Miroslava
Filip Edelmannova
d,
Martin
Reli
d,
Kamila
Koci
d,
Martin
Motola
 a and
Olivier
Monfort
 *a
*a
aComenius University Bratislava, Faculty of Natural Sciences, Department of Inorganic Chemistry, Ilkovicova 6, Mlynska Dolina, 84215 Bratislava, Slovakia. E-mail: shalu1@uniba.sk; olivier.monfort@uniba.sk
bMaterials Chemistry Group, Department of Chemistry, University of Delhi, 110007 Delhi, India
cComenius University Bratislava, Faculty of Mathematics Physics and Informatics, Centre for Nanotechnology and Advanced Materials, Mlynska Dolina, 84248 Bratislava, Slovakia
dVSB – Technical University of Ostrava, Centre of Energy and Environmental Technologies, Institute of Environmental Technology, 17. listopadu 2172/15, 70800 Ostrava-Poruba, Czech Republic
First published on 21st June 2024
Abstract
This work is focused on the investigation of three different Bi-based materials, i.e., CaBi2O2(CO3)2 (CBOC), Ca4Bi6O13 (CBO), and Bi2Ce2O7 (BCO), as photocatalysts in N2O reduction. This study has emphasized the effectiveness of the bismuth ion, irrespective of its presence in different structures with self-regulating electronic and morphological properties, when employed as a photocatalyst. Monophasic CBOC, CBO, and BCO samples have been synthesized by wet-chemical methods, and they exhibit distinct morphological features such as plate-like, dumbbell-shaped, and irregularly shaped crystallites. From the UV-visible diffuse reflectance spectroscopy (DRS) data, CBO exhibits a lower optical band gap of 2.52 eV compared to CBOC (3.95 eV), which CBO is synthesized from. BCO shows the lowest optical band gap of 2.16 eV. CBO exhibits the highest photocurrent generation and the lowest value in work function measurements, following the trend as CBO > CBOC > BCO. The efficiency of the Bi-based materials in photocatalytic decomposition of N2O also follows a similar trend as observed in the photocurrent measurements, wherein the CBO sample exhibits a maximum of 10.4% decomposition of N2O under UV-A in 24 h. Oxygen vacancies in CBO and BCO have been reasoned to play a crucial role in the photocatalytic decomposition of N2O.
Introduction
Presently, greenhouse gases are a global challenge; one of the prominent causes is the generation of hazardous gases by the combustion of fossil fuels. Among these gases, N2O has 310 times higher potential than CO2 to contribute to global warming.1 There are different approaches to reduce N2O emission from industry such as direct catalytic decomposition or thermal decomposition.2–7 However, all of them require significant energy inputs which limits their wide utilizations.2–7 On the other hand, photocatalytic decomposition of N2O under UV or visible light irradiation using semiconductors can be a promising approach involving renewable energy resources.8 TiO2, a well-known semiconductor photocatalyst, has been examined for its efficacy in decomposing N2O. However, the wide band gap and fast recombination of charge carriers should be addressed by designing solar light-driven photocatalysts.9–12 Indeed, the use of natural sunlight, which is composed of visible and UVA light, is crucial to achieve a sustainable and cost-effective photocatalytic process, thus making it more environmentally friendly.Bi2O3 is an interesting photocatalyst as it holds a narrow band gap, thus being activated by visible light.13 Previously reported studies have shown that the morphology and microstructure of Bi2O3 are interrelated to exhibit high photocatalytic activity.14–16 Furthermore, it is well known that doping in the Bi2O3 system resulted in a red shift to the absorption edge, which attracted high attention of researchers to utilize them for photocatalytic application.17 Indeed, cerium is known to exhibit active redox behaviour with fast interconvertible Ce4+ to Ce3+ oxidation states, which supports transport variation in oxygen concentration and thereby helps to improve photocatalytic efficiency.18–21 Also, other bismuth-based photocatalysts e.g., BiOIO3, Bi2SnO7, Bi2O2(CO3)2, BiFeO3, BiVO4, Bi2WO6, and BiOBr achieved a huge popularity due to their unique electronic structure, tuneable surface properties and appropriate band gap.22–24 The reported studies illustrate the potential of bismuth-based materials as efficient catalysts for N2O decomposition.22,23,25 For example, 85% decomposition of N2O was achieved in 30 minutes using Bi2MoO6, 90% in 45 minutes using BiVO4, and 95% in 60 minutes using BiFeO3.22,23,25 Although these materials can operate at lower temperatures and exhibit high time stability, further improvements can be reached by optimizing the synthesis conditions of the bismuth-based photocatalysts. DFT studies demonstrated that Bi 6s and O 2p orbitals undergo a powerful hybridization and resulted in a high dispersion in valence band, thus shifting the energy band gap to lower energy compared to most of the other photocatalysts.26 Additionally, bismuth-based materials can be prepared by facile and cost-effective methods.27 The photocatalytic performance of bismuth-based materials is independent of the type of crystal structure, and it can be attributed to the bismuth ion and the stereo-chemically active lone pair associated with it, reducing the charge carriers’ recombination rate.28–30
In this context, the current study is designed to assess the impact of different chemical structures and compositions of bismuth-based materials (CaBi2O2(CO3)2, Ca4Bi6O13, and Bi2Ce2O7) on the photocatalytic decomposition of N2O. The idea behind the selection of these specific materials is motivated by several facts: (i) in CaBi2O2(CO3)2, the presence of carbonate groups along with bismuth and calcium might affect interestingly the photocatalytic properties;31,32 (ii) the different crystal structures between Ca4Bi6O13 and CaBi2O2(CO3)2, along with their different Ca![[thin space (1/6-em)]](https://www.rsc.org/images/entities/char_2009.gif) :
:![[thin space (1/6-em)]](https://www.rsc.org/images/entities/char_2009.gif) Bi ratio might lead to a better understanding of the role of these element on the material's properties (in addition, Ca4Bi6O13 can be synthesized directly from CaBi2O2(CO3)2);33 and (iii) by replacing calcium with cerium i.e. from Ca4Bi6O13 to Bi2Ce2O7, the specific impact of Ce over Ca on the photocatalytic properties might be clarified. Furthermore, the redox behaviour of cerium in bismuth materials can provide a greater number of active sites, thus facilitating electron transfer and ultimately the photocatalytic properties.34 With this approach, the comparative study of these three distinct Bi-based materials will highlight how different chemical structures and compositions influence photocatalytic efficiency in N2O removal under UVA. It is worth highlighting that our report is the first investigation delving into the photocatalytic assessment of these systems for the decomposition of N2O.
Bi ratio might lead to a better understanding of the role of these element on the material's properties (in addition, Ca4Bi6O13 can be synthesized directly from CaBi2O2(CO3)2);33 and (iii) by replacing calcium with cerium i.e. from Ca4Bi6O13 to Bi2Ce2O7, the specific impact of Ce over Ca on the photocatalytic properties might be clarified. Furthermore, the redox behaviour of cerium in bismuth materials can provide a greater number of active sites, thus facilitating electron transfer and ultimately the photocatalytic properties.34 With this approach, the comparative study of these three distinct Bi-based materials will highlight how different chemical structures and compositions influence photocatalytic efficiency in N2O removal under UVA. It is worth highlighting that our report is the first investigation delving into the photocatalytic assessment of these systems for the decomposition of N2O.
Results and discussion
Crystalline structure and morphology of Bi-based materials
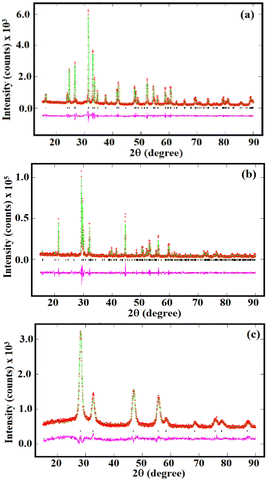
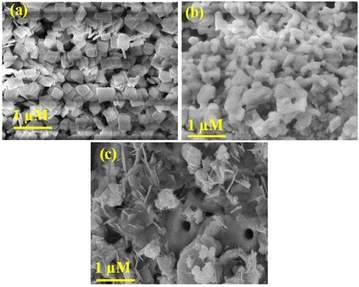
The XRD analysis of CBOC, CBO, and BCO confirmed crystalline Ca2Bi2O2(CO3)2, Ca4Bi6O13, and Bi2Ce2O7, respectively, in accordance with previous findings (Fig. 1).35–37 Lattice refinements by the Le Bail method yielded lattice dimensions of CBOC, CBO and BCO as follows: CBOC (beyerite, Immm S.G.) a = 3.771(1), b = 3.770(1), c = 21.724(2) Å; CBO (Ca4Bi6O13) obtained by thermolysis of beyerite (C2mmm S.G.) a = 17.377(3), b = 5.940(1), c = 7.225(1) Å and Bi2Ce2O7 (BCO) (fluorite, Fm![[3 with combining macron]](https://www.rsc.org/images/entities/char_0033_0304.gif) m) a = b = c = 5.479(4) Å, which confirmed the purity of the materials.35–37 Interestingly, CBO, obtained from the thermolysis of CBOC, is not a typical phase. Indeed, previous reports claimed that the thermolysis of CBOC leads to the formation of metastable CaBi2O4.35,38 However, in our case, reducing calcination time at the same temperature aided the formation of Ca4Bi6O13. Also, using different precursors for synthesizing CBOC compared to these reports might have played a crucial role in stabilizing the Ca4Bi6O13 phase. Additionally, prolonged heat treatment at higher temperatures is avoided, constituting a significant advantage of low temperature synthesis of monophasic Ca4Bi6O13.37 The formation of the Ca4Bi6O13 phase from CBOC proved its versatility in producing metastable oxides containing calcium and bismuth. The CBOC crystallites have a plate-like morphology (Fig. 2a),35 while for CBO obtained by the thermolysis of CBOC, the morphology of the crystallites changed from plate-like to dumbbell-shaped with porous morphology (Fig. 2b).
m) a = b = c = 5.479(4) Å, which confirmed the purity of the materials.35–37 Interestingly, CBO, obtained from the thermolysis of CBOC, is not a typical phase. Indeed, previous reports claimed that the thermolysis of CBOC leads to the formation of metastable CaBi2O4.35,38 However, in our case, reducing calcination time at the same temperature aided the formation of Ca4Bi6O13. Also, using different precursors for synthesizing CBOC compared to these reports might have played a crucial role in stabilizing the Ca4Bi6O13 phase. Additionally, prolonged heat treatment at higher temperatures is avoided, constituting a significant advantage of low temperature synthesis of monophasic Ca4Bi6O13.37 The formation of the Ca4Bi6O13 phase from CBOC proved its versatility in producing metastable oxides containing calcium and bismuth. The CBOC crystallites have a plate-like morphology (Fig. 2a),35 while for CBO obtained by the thermolysis of CBOC, the morphology of the crystallites changed from plate-like to dumbbell-shaped with porous morphology (Fig. 2b).
To explain this observation, the CBOC structure typically involves layers of Bi–O and carbonate groups that can promote plate-like morphologies due to the anisotropic nature of the bonding in the structure. The strong bonding within the layers and weaker interactions between them can lead to preferential growth along certain crystallographic directions, resulting in plate-like structures. On the other hand, CBO has a more complex structure, with multiple calcium and bismuth sites in the oxygen frameworks. This complexity can result in different crystallographic planes having different growth rates, leading to varied morphologies such as dumbbell-shaped or irregular crystallites. Concerning BCO, the irregularly shaped crystallites (Fig. 2c) are in accordance with previous reports.36 Such a morphology can be due to several factors related to synthesis conditions. The average crystallite sizes, calculated using Scherrer analysis, were 45 nm (CBOC), 70 nm (CBO) and 8 nm (BCO).
Fig. S1 (ESI†) shows the N2 adsorption–desorption BET surface area isotherm curves, wherein a type-II adsorption for CBOC and CBO samples suggested mainly macro-porous behaviour of the materials. This behaviour can be attributed to their structural characteristics, wherein the presence of calcium and bismuth leads to larger interstitial sites than tightly bound micro- and meso-pores. While a type-IV isotherm is observed for the BCO sample, it demonstrated its mesoporous nature arising from its synthesis method which is different to that of CBOC and CBO.39
The observed specific surface areas for the CBOC, CBO and BCO samples are 22, 5.5 and 41 m2 g−1. According to Table 1, the maximum value of adsorbed monolayer is observed for the BCO sample, thus being beneficial for its heterogeneous photocatalytic performance.40–44 For CBOC and CBO samples, the BET analysis suggested a predominantly low mesoporous character with some micropores but mainly macropores. On the other hand, the BCO sample has a predominantly mesoporous character with some micropore and macropore representation (Table 1).
| Sample identification | a [m2 g−1] | b [cm3 g−1] | c [cm3 g−1] | d [cm3 g−1] | e [cm3 g−1] | f |
|---|---|---|---|---|---|---|
| a – specific surface area according to BET40 – marked+; b – volume of the adsorbed monomolecular layer; c – cumulative pore volume according to Gurvich;41d – cumulative volume of micropores (MI) according to Horvath–Kawazoe;42e – cumulative volume of mesopore (ME) and macropore (MA) according to BJH method;43,44f – nature of the material. | ||||||
| BCO | +41 | +9.3 | 0.114 | 0.014 | 0.127 | ME, less MI, with little MA |
| CBOC | +22 | +5.1 | 0.034 | 0.006 | 0.032 | Little ME, less MI, with more MA |
| CBO | +5.5 | +1.3 | 0.010 | 0.002 | 0.011 | Little ME, less MI, with more MA |
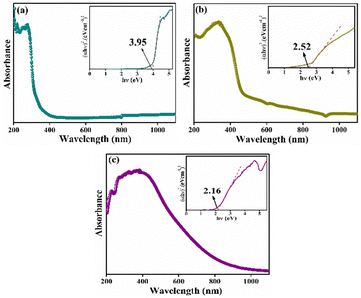
DRS is recorded and reproduced in Fig. 3. The corresponding Tauc plots are shown as insets in Fig. 3. The estimated optical band gap (Eg) value for CBOC is 3.95 eV (Fig. 3a), which is in accordance with the value reported in the literature.35 The absorbance edge for the CBO and BCO samples falls at the edge of the UV-visible junction (Fig. 3b and c), which is evident due to the yellow colors of the samples. In the case of CBO, a significant reduction in Eg and slight lift in the absorption tail and extended up to visible region (Fig. 3b) suggested the presence of defects and oxygen vacancies.37 The difference in optical properties between CBOC and CBO arose from different structural and chemical compositions, thus leading to different electronic band structures. The Eg of BCO (2.16 eV) matches well with the literature.36 The smaller value of Eg for BCO among the three samples, is due to inclusion of Ce and its f-orbitals, which can interact with the existing electronic states, thereby modifying the electronic band structure and reducing the Eg.
Photoelectrochemical performance
The photocurrent data recorded as a function of wavelength and applied potential are reported in Fig. S2 (ESI†). The blue areas represent cathodic photocurrent, while the red ones are for anodic photocurrent. All the samples showed low cathodic photocurrent, detected at low applied potential. On the other hand, higher anodic photocurrent values were obtained at higher applied voltage, and CBO showed photocurrent values 4.5-fold and 10-fold higher at 1 V than for CBOC and BCO, respectively (Fig. 4 and Fig. S2 (ESI†)). As per the reported literature, the high value of photocurrent arises either due to efficient transport of electrons or longer life of generated charge carriers.45 In Fig. 4, the transient photocurrent was obtained using a shutter, which was opened for 5 s and closed for 5 s. The current instantly reaches a plateau when the shutter opens and drops immediately to zero when the shutter closes, thus highlighting a clear photo effect and suggesting a fast charge carrier transfer.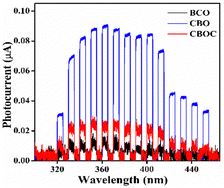 | ||
| Fig. 4 Photocurrent generation at different wavelengths by applying 1 V and using 5 s open/close shutter. | ||
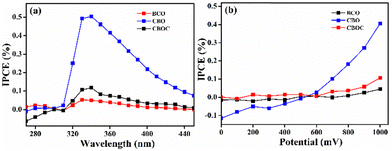
The IPCE was also studied at different wavelengths and 1 V (Fig. 5a) and at different applied potentials at 350 nm (Fig. 5b). The higher values of IPCE at 1 V in the UVA region, i.e., from 320 nm to 380 nm, indicated that the three Bi-based materials could be activated under UVA light (Fig. 5a). By increasing the voltage from 0 to 1 V at 350 nm, the IPCE is found to be at its maximum at 1 V (Fig. 5b), but the applied potential effect was insignificant in CBOC and BCO. In other words, the applied voltage was significantly higher in the case of CBO, where the IPCE reached 0.4%.
The work function of the three samples was calculated since a smaller value of the work function usually facilitates redox processes taking place during N2O decomposition.46 The calculated work function for each sample (Table 2) was directly correlated with their photoelectrochemical performance, i.e., the smallest work function was obtained for CBO (5.15 eV), which showed higher photocurrent in the UVA region. To summarize, the order of work function and IPCE (at different wavelengths and potentials) is as follows: CBO > CBOC > BCO. Therefore, CBO was further used in the photocatalytic decomposition of N2O.
| Sample | Work function (eV) |
|---|---|
| BCO | 5.27 ± 0.01 |
| CBO | 5.15 ± 0.01 |
| CBOC | 5.20 ± 0.02 |
Photocatalytic decomposition of N2O
All three samples were subjected to preliminary tests of N2O decomposition under UV-C light (Fig. S3 (ESI†)). The photocatalytic decomposition of N2O follows the order of CBO > BCO ≈ CBOC. As CBO shows higher photocatalytic ability, the decomposition of N2O is also investigated under UV-A (Fig. 6), as it is the region where it shows the best photoelectrochemical performance (see previous section). For reference, N2O photolysis under UVA irradiation has shown negligible conversion rate.47 The CBO photocatalyst demonstrated 10.4% decomposition of N2O under UV-A irradiation (λmax = 365 nm). Although CBO can be considered a moderate photocatalyst compared to other semiconductor materials under similar sets of reaction conditions e.g., g-C3N4, TiO2, etc.48–50 it is utilized for the first time for N2O decomposition and it might be a promising material for the preparation of composite and doped systems.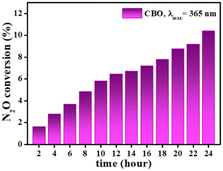 | ||
| Fig. 6 Time dependence on the N2O conversion during the photocatalytic decomposition of N2O over CBO under UV-A irradiation at 365 nm. | ||
Plausible mechanism
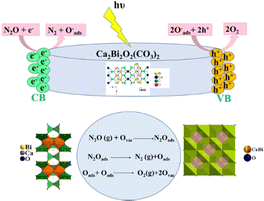
Based on previously published reports,51 there are mainly two factors that facilitate the photocatalytic decomposition of N2O at the surface of the photocatalyst: the reduction of N2O into N2 (eqn (1)) and the oxidation of adsorbed oxygen species into O2 (eqn (2) and (3)). The photocatalytic decomposition involves the reduction of N2O. In addition, hydroxyl groups can react readily with holes and thereby restrict the recombination of charge carriers,51–53 while the oxygen vacancies present serve as active sites that easily adsorb oxygen species:54| N2O + e− → N2 + Oads− | (1) |
| 2Oads− + 2h+ → O2 | (2) |
| Oads− + H+ + e− → OH− | (3) |
The plausible mechanism of CBOC, CBO, and BCO is following the conventional mechanism, i.e., as in eqn (1)–(3) (Fig. 7). Since CBOC has a layered structure, the areas between the layers can behave as the active centers for the photocatalytic reaction.27 The higher performance of CBO could be ascribed to their mesoporous and macroporous nature and generation of oxygen vacancies/defects since its preparation from CBOC is accompanied by the evolution of CO2 gas.38 It has been determined in a previous study that thermolysis of CBOC resulted in stabilization of the mesoporous material with enriched oxygen vacancies, which has been confirmed by Raman investigations.51,53 In addition, we reported earlier that oxygen vacancies played a major role to enhance the catalytic properties of BCO.36 Therefore, it is expected that the oxygen vacancy sites at the surface of CBO and BCO can bind with the oxygen of N2O and initiate the decomposition of N2O as described in eqn (4) and (5).55 The pictorial representation of the plausible mechanism is provided in Fig. 7.
| N2Oads → N2 (gas) + Oads | (4) |
| Oads + Oads → O2 (gas) | (5) |
The study of the surface chemistry on CBOC, CBO and BCO samples before and after N2O decomposition was performed by using XPS to support the proposed mechanism. The consistency in the peak positions in the wide spectra of Bi, Ca, C, O (in CBOC and CBO) and Bi, Ce, O (in BCO) before and after N2O decomposition highlights the stability of the photocatalysts (Fig. S4) (ESI†). In the high resolution XPS spectra of the Bi 4f orbitals of the three samples (Fig. 8a–c), the splitting of Bi 4f7/2 and Bi 4f5/2 into multiple components after N2O decomposition is due to spin orbital coupling and redox behaviour of bismuth. Before N2O decomposition, an additional Bi 4f peak appears in CBOC compared to CBO and BCO and it corresponds to the presence of Bi–O and Bi–C bonds.56 After N2O decomposition, the Bi 4f peaks corresponding to Bi5+ appear, thus confirming that Bi3+ is oxidized upon N2O decomposition (Fig. 8a–c).57,58 Concerning the O 1s spectra, a sharp peak encountered at 530.7 eV can be attributed to lattice oxygen in CBOC, while peaks at higher binding energies of 532.4 and 534.2 eV correspond to –OH and carbonate groups present in the structure before N2O decomposition (Fig. 8d). The disappearance of the peak corresponding to the –OH group suggests that the photocatalytic reactions involved hydroxyl groups.51 In the CBO and BCO samples, the peaks at 529.3 eV and 529.0 eV represent the lattice oxygen while surface adsorbed water molecules are identified at 532.8 eV. A significant amount of oxygen vacancies was observed at 531.3 eV and 531.0 eV in the CBO and BCO, respectively (Fig. 8e and f).59 The presence of C![[double bond, length as m-dash]](https://www.rsc.org/images/entities/char_e001.gif) O groups in the samples might be due to residue left from the precursor during the synthesis conditions. Among the three samples, it can be stated that oxygen vacancies were in a higher amount in the CBO, thus supporting its higher photocatalytic activity.
O groups in the samples might be due to residue left from the precursor during the synthesis conditions. Among the three samples, it can be stated that oxygen vacancies were in a higher amount in the CBO, thus supporting its higher photocatalytic activity.
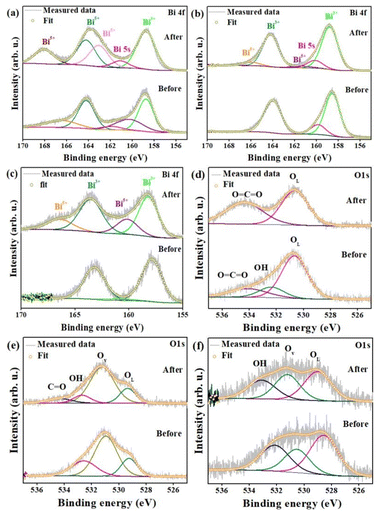 | ||
| Fig. 8 Deconvoluted high resolution XPS spectra of Bi 4f and O 1s for (a) and (d) CBOC, (b) and (e) CBO and (c) and (f) BCO. | ||
Experimental
All the chemicals used in this work were of analytical grade and purchased from CentralChem s.r.o., Slovakia and Merck KGaA, Germany.Synthesis of Bi-based materials
The three different Bi-based materials, i.e., CaBi2O2(CO3)2, Ca4Bi6O13, and Bi2Ce2O7, were synthesized by previously reported procedures.35,36CaBi2O2(CO3)2 (CBOC)
For the synthesis of CBOC, 0.485 g of (BiNO3)3·5H2O was added to 10 mL ethylene glycol solution and kept under vigorous stirring at room temperature for 10 min. Subsequently, 0.118 g of Ca(NO3)2 was slowly added to the solution. This reaction mixture transformed into a milky white colloidal suspension upon the incremental introduction of a 5 mL saturated solution of K2CO3. The suspension was stirred at room temperature for 30 min. Later, 15 mL of distilled water was added to the reaction mixture and was transferred into a solvothermal reactor. The vessel was heated at 140 °C for 72 h. After completion of the reaction, the white-coloured solid product was separated by centrifugation, washed with distilled water until the washings reached a neutral pH, and finally dried at 60 °C overnight.35Ca4Bi6O13 (CBO)
To synthesize CBO, 1.0 g of CaBi2O2(CO3)2 (CBOC) was heated at 675 °C for 12 h in a crucible in a muffle furnace and then cooled down naturally to room temperature. A pale-yellow coloured product resulted after the heat treatment.Bi2Ce2O7 (BCO)
BCO was synthesized using a hydroxide co-precipitation method. Typically, 0.4342 g of cerium nitrate (Ce(NO3)3·6H2O) dissolved in 5 ml distilled water and 0.4850 g of Bi(NO3)3·5H2O dissolved in a minimum amount of concentrated HNO3 were mixed together. 1.2 M NaOH solution was incrementally added dropwise to the metal ion mixture until the pH reached 12. The resulting suspension was stirred for 6 h at room temperature. The solid precursor was separated through centrifugation and underwent repeated washing until the washings achieved a neutral pH. The solid was further dried in a hot air oven at 60 °C, and the dried product was calcined at 600 °C for 6 h.36Characterization techniques
All powder samples were subjected to powder X-ray diffraction (PXRD) using a PANalytical X-ray diffractometer equipped with CuKα radiation to confirm the phase purity. Furthermore, their lattice dimensions were determined by performing Le Bail refinements of the PXRD patterns using GSAS software.60,61 The morphology of the samples was examined using scanning electron microscopy (SEM, Tescan Lyra III). The surface area measurements were recorded using BET (Brunauer–Emmett–Teller method, Sorptomatic 1990 SERIES, Thermo Quest CE Instruments, Italy) in the range of relative pressure p/p0 = 0.05–0.25, and adsorption–desorption isotherms were measured at p/p0 = 0–1, with the low-temperature adsorption method of N2 at its boiling point of 77.7 K from vacuum to atmospheric pressure. The optical properties of the samples were measured by UV-VIS diffuse reflectance spectroscopy (DRS) using PerkinElmer Lambda-35 with a 50 mm integrating sphere and utilizing BaSO4 as an external reference. The measured reflectance spectra were transformed by the Kubelka–Munk algorithm and the Tauc plot was applied to determine the energy of the band gap (Eg).62 In order to study surface chemistry of the samples before and after photocatalytic reactions, X-ray photoelectron spectroscopy (XPS, Omicron Nanotechnology, Mg Ka photon energy 1253.6 eV) was used.Photoelectrochemical and work function measurements
All three samples were investigated for photocurrent generation, incident photon-to-current efficiency (IPCE) and work function measurements. The photoelectrochemical properties were determined using a photoelectric spectrometer (Instytut Fotonowy, Krakow, Poland), and the work function was measured using a Kelvin probe (Instytut Fotonowy, Krakow, Poland).Photoelectrochemical measurements were performed using a photoelectric spectrometer and a three-electrode configuration, with Ag/AgCl and platinum wire as the reference and counter electrode. A thin layer of the analyte material deposited on ITO-coated transparent PET foil (60 Ω sq−1 resistance, Sigma-Aldrich) served as a working electrode. The working electrode was prepared by the following procedure: 20 mg of the sample was finely ground in an agate mortar, 150 mL of ethanol was added afterward and the suspension was stirred in an Eppendorf using a Shaker Vortex mixer ZX4 (Velpsa) for 15 min. A thin layer was made from the suspension using an Elcometer Micrometric film applicator (Elcometer 3570/1, Great Britain). The ITO foil was washed with ethanol and dried at 80 °C before the deposition of the thin layer. The deposited uniform film was then dried at 80 °C in a dryer. The 0.1 mol L−1 KNO3 solution (pH = 6.1) was used as an electrolyte. The electrolyte was purged to remove oxygen by argon before the photocurrent measurements for 15 min. Argon flow was kept constant during the entire experiment. Photocurrents were recorded by irradiating the working electrode from the backside with a xenon lamp (150 W) in the range of 250–450 nm with a 10 nm step (controlled by a monochromator) and by applying voltages in the range between −0.2 and 1.0 V (vs. Ag/AgCl). The size of the working electrode is determined by the diameter of the window (1.0 cm) and the irradiated surface area is 0.785 cm2.
Work function measurements were conducted using a Kelvin probe. The technique consists of the measurements of contact potential difference (CPD) between the oscillating reference electrode made of a gold grid (also referenced as a tip) of a known work function (5.1 eV) and the working electrode (measured sample) of an unknown work function. The obtained CPD is given by the difference in work functions of the tip and the sample (eqn (6)). Therefore, the work function of the sample is calculated according to eqn (7).
| CPD = Φsample − Φtip | (6) |
| Φsample = CPD + Φtip | (7) |
During the CPD measurement, the whole system was placed in a grounded Faraday cage to reduce the electrical noise and the influence of stray light. Temperature and humidity inside the Faraday cage were monitored during the entire measurement. 100 mg of the sample was pressed into a pellet under 100 MPa. The work function was measured from minimally 5 different spots of the pellet. The final value was determined as the average work function from these spots.
Photocatalytic decomposition of N2O
Photocatalytic N2O decomposition experiments were implemented in a batch photoreactor (200 mL). Initially, 0.1 g of powder photocatalyst was positioned uniformly at the bottom of the batch photoreactor to maximize the contact surface. Subsequently, the reactor was filled with the mixture of N2O/He (concentration of N2O = 1030 ppm) and exposed to a polychromatic UV-A (Ultraviolet Products Inc., λmax = 365 nm) or UV-C (Ultraviolet Products Inc., λmax = 254 nm) pen-ray lamp (Fig. S5) (ESI†). The selected source was situated on a quartz glass window on top of the photoreactor in a horizontal position. Prior to initiating the reaction, a gaseous sample was taken (at 0 h) through the septum by a gastight syringe. The gaseous samples were analysed by a gas chromatograph (Shimadzu Tracera GC-2010Plus) equipped with a BID (barrier discharge ionization detector). The reaction mixture was irradiated at intervals of 0–24 h with a sampling frequency of 2 h. All measurements were repeated with the resulted error below 5%. The stability of the investigated samples was demonstrated by repeated use of the same batch, yielding consistent results. A reduction in N2O concentration and an increase in the ratio of oxygen and nitrogen were observed.Conclusions
This study emphasized the successful synthesis of CBOC, CBO, and BCO and their exploration in the photocatalytic decomposition of N2O for the first time. The Bi-based materials’ photoelectrochemical properties and work function confirmed that they can be photoactivated under UVA light. The highest photocurrent generation was achieved in the presence of the CBO sample and reached 0.09 μA at 1 V and 365 nm (with an IPCE of 0.4%), which is 4.5-fold and 10-fold higher than for CBOC and BCO. CBO also exhibited the highest performance in photocatalytic decomposition of N2O, where 10.4% was removed after 24 h under UV-A light. Although CBO has the smallest surface area, its photocatalytic performance highlights the complex combination of several properties with different impacts. In the present case, the electronic properties have a predominant role compared to the surface properties. The mechanistic aspect was also deduced, and the enhanced N2O decomposition using CBO was due to oxygen vacancies. This work underscores that the investigated Bi-based materials are promising solar-light driven photocatalysts as (i) UVA is a part of natural sunlight and (ii) optimization of optical and electronic properties brought by Bi could harness also the visible part of the solar spectrum. Therefore, this work is an added-value in the fundamental understanding of Bi-based materials in photocatalytic processes and it highlights that further investigations are necessary to maximize their responsiveness and effectiveness under continuous sunlight exposure.Author contributions
Shalu Atri: conceptualization – investigation – methodology – writing: original draft – writing: review & editing – funding acquisition; Sitharaman Uma: conceptualization – visualization – writing: review & editing; Rajamani Nagarajan: investigation – visualization – writing: review & editing; Maros Gregor: investigation; Tomas Roch: investigation; Miroslava Filip Edelmannová – investigation, Martin Reli – investigation, Kamila Koci: supervision – funding acquisition; Martin Motola: writing: review & editing – funding acquisition; Olivier Monfort: conceptualization – supervision – writing: original draft – writing: review & editing – funding acquisition.Data availability
Data cannot be made available due to legal confidentiality requirements.Conflicts of interest
There are no conflicts to declare.Acknowledgements
This work has been carried out in the frame of the PhotoMXene project No. 3305/03/02 co-funded by the EU Horizon 2020 Research and Innovation Program under the Program SASPRO2 COFUND Marie Sklodowska-Curie grant agreement No. 945478. This research has also been partially supported by the Slovak Research and Development Agency (Contract No. APVV-21-0039) and the Scientific Grant Agency of the Slovak Republic (VEGA project No. 1/0319/23). The work was also supported by the Large Research Infrastructure ENREGAT (project No. LM2023056). The authors thank Hryhorii Makarov for the SEM pictures.References
- N. Pasha, P. S. S. Reddy, T. V. Sagar, N. Lingaiah and P. S. Prasad, Combating Global Warming due to Nitrous Oxide, Sci. Spectra, 2016, 1, 410–423 Search PubMed.
- H. Y. Chen, Z. H. Wei, M. Kollar, F. Gao, Y. L. Wang, J. Szanyi and C. H. F. Peden, A comparative study of N2O formation during the selective catalytic reduction of NOx with NH3 on zeolite supported Cu catalysts, J. Catal., 2015, 329, 490–498 CrossRef CAS.
- G. Grzybek, S. Wojcik, P. Legutko, J. Grybos, P. Indyka, B. Leszczynski, A. Kotarba and Z. Sojka, Thermal stability and repartition of potassium promoter between the support and active phase in the K-Co2.6Zn0.4O4 vertical bar alpha-Al2O3 catalyst for N2O decomposition: Crucial role of activation temperature on catalytic performance, Appl. Catal., B, 2017, 205, 597–604 CrossRef CAS.
- M. Jablonska and R. Palkovits, It is no laughing matter: nitrous oxide formation in diesel engines and advances in its abatement over rhodium-based catalysts, Catal. Sci. Technol., 2016, 6(21), 7671–7687 RSC.
- C. Zhang, Z. Zhang, C. Sui, F. Yuan, X. Niu and Y. Zhu, Catalytic decomposition of N2O over Co-Ti oxide catalysts: Interaction between Co and Ti oxide, ChemCatChem, 2016, 8, 2155–2164 CrossRef CAS.
- C. Pophal, T. Yogo, K. Yamada and K. Segawa, Selective catalytic reduction of nitrous oxide over Fe-MFI in the presence of propene as reductant, Appl. Catal., B, 1998, 16, 177–186 CrossRef CAS.
- A. Y. Wang, Y. L. Wang, E. D. Walter, R. K. Kukkadapu, Y. L. Guo, G. Z. Lu, R. S. Weber, Y. Wang, C. H. F. Peden and F. Gao, Catalytic N2O decomposition and reduction by NH3 over Fe/Beta and Fe/SSZ-13 catalysts, J. Catal., 2018, 358, 199–210 CrossRef CAS.
- M. Konsolakis, Recent advances on nitrous oxide (N2O) decomposition over non-noble-metal oxide catalysts: Catalytic performance, mechanistic considerations, and surface chemistry aspects, ACS Catal., 2015, 5, 6397–6421 CrossRef CAS.
- R. J. Stella, I. Sreevani, T. R. Gurugubelli, R. V. S. S. N. Ravikumar and R. Koutavarapu, Enhanced Solar Light-Driven Photocatalytic Degradation of Tetracycline Using Fe3+-Doped CdO/ZnS Nanocomposite: Mechanistic Insights and Performance Evaluation, Catalysts, 2023, 13(9), 1312 CrossRef CAS.
- K. Koci, M. Reli, I. Troppova, M. Sihor, J. Kupkova, P. Kustrowski and P. Praus, Photocatalytic decomposition of N2O over TiO2/g-C3N4 photocatalysts heterojunction, Appl. Surf. Sci., 2017, 396, 1685–1695 CrossRef CAS.
- L. Matejova, M. Sihor, J. Lang, I. Troppova, N. Ambrozova, M. Reli, T. Brunatova, L. Capek, A. Kotarba and K. Koci, Investigation of low Ce amount doped-TiO2 prepared by using pressurized fluids in photocatalytic N2O decomposition and CO2 reduction, J. Sol-Gel Sci. Technol., 2017, 84, 158–168 CrossRef CAS.
- Q. Wu, C.-C. Yang and R. van de Krol, A dopant-mediated recombination mechanism in Fe-doped TiO2 nanoparticles for the photocatalytic decomposition of nitric oxide, Catal. Today, 2014, 225, 96–101 CrossRef CAS.
- D. P. Dutta, M. Roy and A. K. Tyagi, Dual function of rare earth doped nano Bi2O3: white light emission and photocatalytic properties, Dalton Trans., 2012, 41, 10238–10248 RSC.
- Z. Wu, Y. Shen, A. Xie, F. Huang, Y. Cai and S. Lie, Sonochemical fabrication and optical properties of ZnO tilliform dendrites containing Bi2O3, Indian J. Chem., 2009, 48A, 51–56 CAS.
- L. Cheng and Y. Kang, Selective preparation of Bi2O3 visible light driven photocatalyst by dispersant and calcination, J. Alloys Compd., 2014, 585, 85–93 CrossRef CAS.
- Z. Ai, Y. Huang, S. Lee and L. Zhang, Monoclinic α-Bi2O3 photocatalyst for efficient removal of gaseous NO and HCHO under visible light irradiation, J. Alloys Compd., 2011, 509, 2044–2049 CrossRef CAS.
- J. Wei, C. Cai, S. Xu and Y. Zhang, Synthesis and characterization of a pigment with a high near-infrared reflectance: Ca2+-doped Bi2O3, Ceram. Int., 2024, 50(4), 6606–6614 CrossRef CAS.
- S. Akshatha, S. Sreenivasa, L. Parashuram, V. U. Kumar, S. C. Sharma, H. Nagabhushana, S. Kumar and T. Maiyalagan, Synergistic effect of hybrid Ce3+/Ce4+ doped Bi2O3 nano-sphere photocatalyst for enhanced photocatalytic degradation of alizarin red S dye and its NUV excited photoluminescence studies, J. Environ. Chem. Eng., 2019, 7(3), 103053 CrossRef CAS.
- Y. Bi, R. Li, F. Guo, C. Zhu and J. Pei, Photocatalytic purification of vehicle exhaust using CeO2-Bi2O3 loaded on white carbon and tourmaline., Environ. Sci. Pollut. Res., 2021, 28, 17724–17738 CrossRef CAS PubMed.
- S. T. Aziz, M. Ummekar, I. Karajagi, S. K. Riyajuddin, K. V. Siddhartha, A. Saini, A. Potbhare, R. G. Chaudhary, V. Vishal, P. C. Ghosh and A. Dutta, A Janus cerium-doped bismuth oxide electrocatalyst for complete water splitting, Cell Rep. Phys. Sci., 2022, 3(11), 101106 CrossRef CAS.
- K. Masula, Y. Bhongiri, G. R. Rao, P. V. Kumar, S. Pola and M. Basude, Evolution of photocatalytic activity of CeO2–Bi2O3 composite material for wastewater degradation under visible-light irradiation, Opt. Mater., 2022, 126, 112201 CrossRef.
- S. Liu, J. Sun, G. Ren and X. Meng, Vacancy-engineered bismuth-based semiconductor with enhanced photocatalytic activity: A review, Mater. Sci. Semicond. Process., 2022, 137, 106230 CrossRef CAS.
- P. Chen, H. Liu, W. Cui, S. C. Lee, L. A. Wang and F. Dong, Bi-based photocatalysts for light-driven environmental and energy applications: structural tuning, reaction mechanisms, and challenges, EcoMat, 2020, 2(3), e12047 CrossRef CAS.
- K. Qin, Q. Zhao, H. Yu, X. Xia, J. Li, S. He, L. Wei and T. An, A review of bismuth-based photocatalysts for antibiotic degradation: Insight into the photocatalytic degradation performance, pathways and relevant mechanisms, Environ. Res., 2021, 199, 111360 CrossRef CAS PubMed.
- T. L. Wakjira, A. B. Gemta, G. B. Kassahun, D. M. Andoshe and K. Tadele, Bismuth-Based Z-Scheme Heterojunction Photocatalysts for Remediation of Contaminated Water, ACS Omega, 2024, 9(8), 8709–8729 CrossRef CAS PubMed.
- H. Kunioku, M. Higashi, O. Tomita, M. Yabuuchi, D. Kato, H. Fujito, H. Kageyama and R. Abe, Strong hybridization between Bi-6s and O-2p orbitals in Sillen-Aurivillius perovskite Bi4MO8X (M= Nb, Ta; X= Cl, Br), visible light photocatalysts enabling stable water oxidation., J. Mater. Chem. A, 2018, 6(7), 3100–3107 RSC.
- H. Huang, C. Zhou, X. Jiao, H. Yuan, J. Zhao, C. He, J. Hofkens, M. B. J. Roeffaers, J. Long and J. A. Steele, Subsurface defect engineering in single-unit-cell Bi2WO6 monolayers boosts solar driven photocatalytic performance, ACS Catal., 2020, 10(2), 1439–1443 CrossRef CAS.
- A. Walsh, D. J. Payne, R. G. Egdell and G. W. Watson, Stereochemistry of post-transition metal oxides: revision of the classical lone pair model, Chem. Soc. Rev., 2011, 40(9), 4455–4463 RSC.
- J. Wu, K. Xu, Q. Z. Liu, Z. Ji, C. H. Qu, X. Qi, H. Zhang, Y. Guan, P. He and L. J. Zhu, Controlling dominantly reactive (010) facets and impurity level by in situ reduction of BiOIO3 for enhancing photocatalytic activity, Appl. Catal., B, 2018, 232, 135–145 CrossRef CAS.
- X. Liao, X. Lan, N. Ni, P. Yang, Y. Yang and X. Chen, Bismuth oxychloride nanowires for photocatalytic decomposition of organic dyes, ACS Appl. Nano Mater., 2021, 4(4), 3887–3892 CrossRef CAS.
- J. D. Grice, A solution to the crystal structures of bismutite and beyerite, Can. Mineral., 2002, 40(2), 693–698 CrossRef CAS.
- J. Kawano, S. Maeda and T. Nagai, The effect of Mg 2+ incorporation on the structure of calcium carbonate clusters: investigation by the anharmonic downward distortion following method, Phys. Chem. Chem. Phys., 2016, 18(4), 2690–2698 RSC.
- L. Yu, D. Li, S. Zhao, G. Li and K. Yang, First principles study on electronic structure and optical properties of ternary GaAs: Bi alloy, Materials, 2012, 5(12), 2486–2497 CrossRef CAS.
- S. A. Paramita, I. Nurhasanah and A. Khumaeni, Structural and Optical Properties of Bismuth Doped Cerium Oxide Prepared at Low temperature, J. Penelit. Fis. Apl., 2023, 13(1), 16–24 CrossRef.
- V. Malik, M. Pokhriyal and S. Uma, Single step hydrothermal synthesis of beyerite, CaBi2O2(CO3)2 for the fabrication of UV-visible light photocatalyst BiOI/CaBi2O2(CO3)2, RSC Adv., 2016, 6(44), 38252–38262 RSC.
- S. Uniyal, S. Atri, S. Uma and R. Nagarajan, Microstructural changes caused by Ba and Pr doping in nanosized Bi2Ce2O7 leading to interesting optical, magnetic, and catalytic properties., CrystEngComm, 2021, 23(4), 986–999 RSC.
- K. Obata, K. Matsumoto, T. Uehara, A. Doi, Y. Obukuro and S. Matsushima, Preparation and characterization of Ca4Bi6O13 complex oxide., Chem. Lett., 2011, 40(3), 288–289 CrossRef CAS.
- S. Atri, V. Malik, S. Uma and R. Nagarajan, Catalytic applications of mesoporous CaBi2O4 obtained from a single source precursor., Res. Chem. Intermed., 2019, 45, 2457–2470 CrossRef CAS.
- D. B. Hernandez-Uresti, D. Sanchez-Martínez, A. Martinez-de La Cruz, S. Sepulveda-Guzman and L. M. Torres-Martinez, Characterization and photocatalytic properties of hexagonal and monoclinic WO3 prepared via microwave-assisted hydrothermal synthesis, Ceram. Interfaces, 2014, 40(3), 4767–4775 CrossRef CAS.
- S. Brunauer, P. H. Emmett and E. Teller, Adsorption of gases in multimolecular layers, J. Am. Chem. Soc., 1938, 60(2), 309–319 CrossRef CAS.
- L. Gurvitsch, Physicochemical attractive force, J. Phys. Chem. Soc., 1915, 47, 805–827 Search PubMed.
- G. Horvath and K. Kawazoe, Method for the calculation of effective pore size distribution in molecular sieve carbon, J. Chem. Eng., 1983, 16(6), 470–475 CrossRef CAS.
- E. P. Barrett, L. G. Joyner and P. P. Halenda, The determination of pore volume and area distributions in porous substances. I. Computations from nitrogen isotherms, J. Am. Chem. Soc., 1951, 73(1), 373–380 CrossRef CAS.
- B. C. Lippens and J. H. De Boer, Studies on pore systems in catalysts: V. The t method, J. Catal., 1965, 4(3), 319–323 CrossRef CAS.
- H. Zhu, M. Pan, M. B. Johansson and E. M. Johansson, High photon-to-current conversion in solar cells based on light-absorbing silver bismuth iodide, ChemSusChem, 2017, 10(12), 2592–2596 CrossRef CAS PubMed.
- P. Stelmachowski, G. Maniak, A. Kotarba and Z. Sojka, Strong electronic promotion of Co3O4 towards N2O decomposition by surface alkali dopants., Catal. Commun., 2009, 10(7), 1062–1065 CrossRef CAS.
- F. Bosca, P. Morliere, M. A. Miranda, J. V. Castell and R. Santus, Primary steps of the photochemical reactions of 2-cyano-10-(3-[dimethylamino, N-oxide]-2-methylpropyl)-5-oxide-phenothiazine, the photoproduct of cyamemazine, a phototoxic neuroleptic: comparison with the sulfoxide, Photochem. Photobiol. Sci., 2006, 5, 336–342 CrossRef CAS PubMed.
- K. Koci, M. Reli, I. Troppova, M. Sihor, J. Kupkova, P. Kustrowski and P. Praus, Photocatalytic decomposition of N2O over TiO2/g-C3N4 photocatalysts heterojunction., Appl. Surf. Sci., 2017, 396, 1685–1695 CrossRef CAS.
- K. Koci, M. Reli, I. Troppova, M. Sihor, T. Bajcarova, M. Ritz, J. Pavlovsky and P. Praus, Photocatalytic decomposition of N2O by using nanostructured graphitic carbon nitride/zinc oxide photocatalysts immobilized on foam, J. Catal., 2019, 9(9), 735 CAS.
- K. Koci, S. Krejcikova, O. Solcova and L. Obalova, Photocatalytic decomposition of N2O on Ag-TiO2, Catal. Today, 2012, 191(1), 134–137 CrossRef CAS.
- M. Reli, I. Troppova, M. Sihor, J. Pavlovsky, P. Praus and K. Koci, Photocatalytic decomposition of N2O over g-C3N4/BiVO4 composite., Appl. Surf. Sci., 2019, 469, 181–191 CrossRef CAS.
- J. Tan, H. Cheng, J. Liu, J. Sun, Y. Li, H. Wang, J. Liu and Z. Zhao, Room-Temperature Photocatalytic Decomposition of N2O over Nanobelt-Like Bi2MoO6, ChemistrySelect, 2019, 4(18), 5338–5344 CrossRef CAS.
- K. Koci, I. Troppova, M. Reli, L. Matejova, M. Edelmannova, H. Drobna, L. Dubnova, A. Rokicinska, P. Kustrowski and L. Capek, Nd/TiO2 anatase-brookite photocatalysts for photocatalytic decomposition of methanol, Front. Chem., 2018, 6, 1–11 CrossRef PubMed.
- A. Kudo and H. Nagayoshi, Photocatalytic reduction of N2O on metal-supported TiO2 powder at room temperature in the presence of H2O and CH3OH vapor, Catal. Lett., 1998, 52, 109–111 CrossRef CAS.
- N. Richards, L. A. Parker, J. H. Carter, S. Pattisson, D. J. Morgan, N. F. Dummer, S. E. Golunski and G. J. Hutchings, Effect of the Preparation Method of LaSrCoFeOx Perovskites on the Activity of N2O Decomposition., Catal. Lett., 2022, 1–14 Search PubMed.
- Y. Zhang, D. Li, Y. Zhang, X. Zhou, S. Guo and L. Yang, Graphene-wrapped Bi2O2CO3 core–shell structures with enhanced quantum efficiency profit from an ultrafast electron transfer process, J. Mater. Chem. A, 2014, 2(22), 8273–8280 RSC.
- R. Zalecki, W. Woch, M. Kowalik, A. Kołodziejczyk and G. Gritzner, Bismuth Valence in a Tl0.7Bi0.3Sr1.6Ba0.4CaCu2Oy Superconductor from X-Ray Photoemission Spectroscopy, Acta Phys. Pol., A, 2010, 118(2), 393–395 CrossRef.
- Z. Li, M. Wang, J. Shen, Z. Zhu and Y. Liu, Synthesis of BiOI nanosheet/coarsened TiO2 nanobelt heterostructures for enhancing visible light photocatalytic activity., RSC Adv., 2016, 6(36), 30037–30047 RSC.
- D. S. Shin, H. G. Kim, H. S. Ahn, H. Y. Jeong, Y. J. Kim, D. Odkhuu, N. Tsogbadrakh and B. H. Kim, Distribution of oxygen functional groups of graphene oxide obtained from low-temperature atomic layer deposition of titanium oxide, RSC Adv., 2017, 7(23), 13979–13984 RSC.
- A. C. Larson and R. B. Von Dreele, General Structure Analysis System (GSAS), Los Alamos National Laboratory Report LAUR, 2004, pp. 86–748.
- B. H. Toby, EXPGUI, a Graphical User Interface for GSAS, J. Appl. Crystallogr., 2001, 34, 210 CrossRef CAS.
- P. Makuła, M. Pacia and W. Macyk, How to correctly determine the band gap energy of modified semiconductor photocatalysts based on UV-Vis spectra, J. Phys. Chem. Lett., 2018, 9(23), 6814–6817 CrossRef PubMed.
Footnote |
| † Electronic supplementary information (ESI) available: Figure for BET, photocurrent measurements, XPS wide spectra and N2O decomposition under UV-C irradiation. See DOI: https://doi.org/10.1039/d4ya00240g |
| This journal is © The Royal Society of Chemistry 2024 |

