 Open Access Article
Unraveling the thermal stability of aromatic disulfide epoxy vitrimers: a comprehensive study using principal component analysis (PCA)†
Paula
Fanlo
 ab,
Alaitz
Ruiz de Luzuriaga
 *a,
Gorka
Albizu
 c,
Marta
Ximenis
 b,
Alaitz
Rekondo
 a,
Hans Jürgen
Grande
ad and
Haritz
Sardon
 *b
*b
aCIDETEC, Basque Research and Technology Alliance (BRTA), Po. Miramón 196, 20014 Donostia-San Sebastian, Spain. E-mail: aruiz@cidetec.es
bPOLYMAT, Department of Polymers and Advanced Materials: Physics, Chemistry and Technology, Faculty of Chemistry University of the Basque Country UPV/EHU, Joxe Mari Korta Center, Avda. Tolosa 72, 20018 Donostia-San Sebastian, Spain. E-mail: haritz.sardon@ehu.es
cDepartment of Applied Chemistry, Faculty of Chemistry, University of Basque Country (UPV/EHU), 20018 San Sebastian, Spain
dUniversity of the Basque Country (UPV/EHU), Advanced Polymers and Materials: Physics, Chemistry and Technology Department, Avda. Tolosa 72, 20018, Donostia-San Sebastian, Spain
First published on 10th July 2024
Abstract
Polymer networks possessing reversible covalent crosslinks have emerged as an interesting type of material that combine the excellent performance of thermoset materials with the processability of thermoplastic materials. Several studies have focused on different reversible bonds. However, little or no attention has been paid to degradation events occurring during reprocessing. In this study, we utilize 1H NMR spectra coupled with chemometric methods to define the best processing conditions for aromatic disulfide-based vitrimers. By using a principal component analysis (PCA) tool, we show it is possible to gauge which variable has a greater impact on the degradation of aromatic disulfides. Analyzing 80 different spectra simultaneously, the PCA reveals that from the analyzed variables, the processing time is the most influential variable, followed by temperature. Using Multivariate Curve Resolution (MCR) models we show that it is possible to estimate the extent of degradation as a function of the different experimental conditions. The data obtained with model compounds using chemometrics has been validated by analyzing the impact of reprocessing conditions in vitrimer networks. Our study suggests that NMR analysis combined with chemometric tools can provide highly valuable information to define processing conditions for covalent adaptable networks with minimal degradation.
1. Introduction
Covalent adaptable networks (CANs) or vitrimers are networks that have reversible covalent bonds that enable them to respond to an external stimulus. Several dynamic covalent functionalities that are able to respond to an external stimulus have been investigated in the open literature including acetals, borazaaromatic anhydrides, borate esters, disulfides, hydrazones, imines, oximes, and olefins (metathesis).1–4 These dynamic functionalities must possess the ability to exchange selectively when desired. At the same time, the dynamic functionality should not promote any other exchange reaction, such as irreversible reactions of the dynamic bond or degradation of the network structure. In this way, the CAN will be able to maintain its initial bond density while permitting the material to rearrange5–10 in multiple reprocessing cycles.11CANs can be categorized based on their exchange mechanism into two distinct groups.2–5 In the first group of CANs, named dissociative networks, chemical bonds are broken and reformed at a different location. Due to this change, the polymeric network is converted into a thermoplastic-like material. This mechanism induces a sudden drop in viscosity, facilitating rapid reprocessing, albeit at the expense of uncontrolled deformation at elevated temperatures and reduced solvent resistance.12–14 The second group of CANs, named associative networks, maintain a constant crosslink density as the initial cross-link is only disrupted upon the establishment of a new covalent bond at a different position.15 Leibler and coworkers pioneered such associative covalent bonds in epoxy networks in 2011. They managed to rearrange an epoxy network upon heating.16 They demonstrated that the rheological profile of this CAN was different from the dissociative one as it resembled a vitreous silica-like behavior. Indeed the material above the Tg behaved as a viscoelastic fluid while below Tg behaved as a crosslinked material, naming these new dynamic bonds as “vitrimers”.17
Disulfide exchange is one of the most studied associative exchange chemistries for the design of vitrimer materials. Among the different disulfides, aromatic disulfide moieties, have been successfully applied for the preparation of different dynamic polymer materials,18 and composites.19 One of the key advantages of disulfides is that they have shown rapid bond exchange, even at room temperature. Moreover, the dynamic character can be tuned by varying the excess amine, time or temperature, which can lead to enhanced relaxation of the disulfide bonds and is crucial for reprocessing and repair processes. However, it is important to point out that, in addition to facilitating the disulfide exchange, these variables can also enhance the effects of detrimental side reactions. Indeed, one of the main drawbacks when using aromatic disulfides to obtain vitrimer polymers is the thermal stability of the disulfide moiety, especially when this dynamic bond is implemented in high Tg vitrimers.20,21 In this sense, it is essential to understand which of the variables is more important to achieve favorable conditions for reprocessability and thermoformability of the disulfide-containing vitrimer materials whilst minimizing potential degradation.
To study the reprocessability of vitrimers, stress relaxation experiments are usually performed at different temperatures to evaluate which conditions can be used for reprocessing. This experiment is usually coupled with other measurements to analyze the mechanical properties, chemical structure, and thermomechanical properties to confirm that the processability is given by the presence of dynamic bonds and not because the vitrimer is suffering some form of degradation. While it is generally accepted that the changes in properties are related to network degradation,31 due to the lack of solubility of vitrimers, it is challenging and time-consuming to study the degradation after material preparation.
One way to optimize the conditions of the exchange reaction while minimizing potential degradation events is to perform a bond-exchange reaction using small molecule analogues that can be dissolved and analyzed by traditional characterization tools.22–28 Indeed, high-performance liquid chromatography (HPLC), gas or liquid chromatography (GC or LC), nuclear magnetic resonance (NMR) or Fourier-transform infrared spectroscopy (FTIR) are commonly used to quantify the rate and extent of bond exchange.29–33 These techniques provide a comprehensive understanding of the dynamics of bond exchange in small molecules, enabling researchers to manipulate bond exchange rates and control the macroscopic properties of vitrimers.34 However, little attention has been paid to the rate of degradation events that could potentially occur during the optimized conditions of bond-exchange reactions. Indeed, in many cases these degradation events are complex and difficult to resolve, but tools to quantify the rate of degradation as a function of processing conditions may facilitate discovery of the range of conditions that allow rapid reprocessing with minimal degradation.
NMR is one of the most sensitive and powerful techniques to identify different events that may be occurring alongside the exchange reaction. Despite the high sensitivity, it is rarely implemented to determine the rate of degradation as this requires a proper analysis of all secondary products formed during the dynamic bond exchange reaction. The complex NMR spectra might seem difficult to handle, but their combination with chemometric technology can extract important features, even without fully understanding the degradation products formed during the exchange reaction.35 Among the various chemometric techniques, Principal Component Analysis (PCA) is frequently used to do an exploratory study of the data, to reduce the complexity of dataset dimensions while preserving most of the original variability. It accomplishes this by transforming the data into a set of unrelated components, called principal components (PCs), which capture the largest possible amount of variance in the data.36 Among others, this analysis has been very useful in the polymer field to evaluate copolymer shape using NMR data,37 to analyze thermal contact resistance38 and to analyze complex structural changes in polymer materials.39–41 However, as far as we are aware this has not been implemented to determine side reactions in vitrimeric materials.
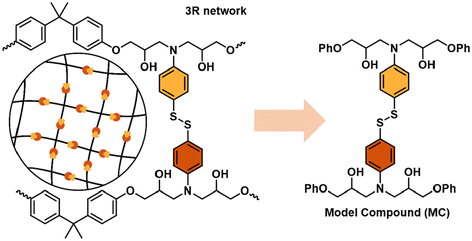
In the present work, we evaluate the potential of 1H-NMR data combined with chemometrics as a tool to analyze the rate of degradation in vitrimeric materials. It was thought that this would facilitate the selection of the best conditions to perform the bond exchange reaction with minimal degradation. To do so, we have evaluated a model system based on aromatic disulfides, which have shown fast exchange even at room temperature. Important features are extracted from 1H NMR spectra by using a PCA analysis which allows identification of the variables that have the most significant influence on the degradation of aromatic disulfides. Using this information we then establish which conditions facilitate reprocessing with reduced degradation. These conditions are applied to vitrimeric materials by looking at the variation of Tg and rubbery modulus measured by DMA and it is shown that the coupling of NMR data with chemometrics can be successfully applied to vitrimeric materials to delineate thermoforming/repair temperatures by time-saving experiments (Fig. 1).
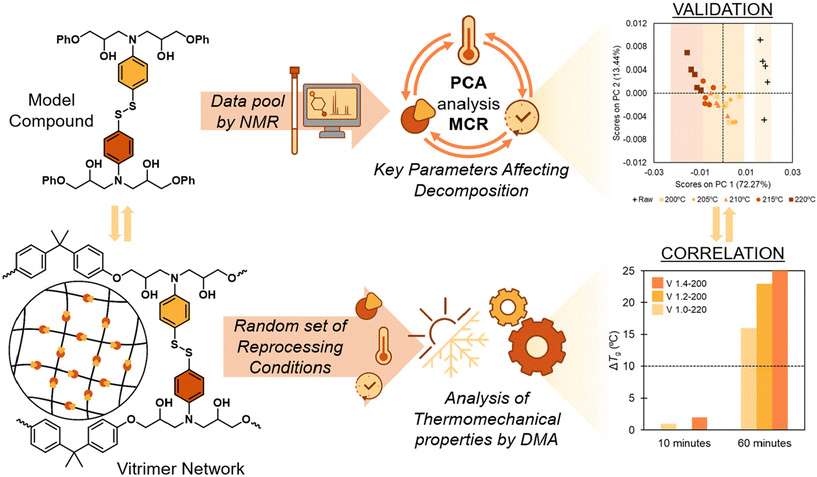 | ||
| Fig. 1 Key degradation factors on model compounds via PCA and MCR tools correlate with disulfide-based epoxy vitrimers. | ||
2. Materials and methods
2.1. Materials
Glycidyl phenyl ether (GPE, 99.0%) was purchased from TCI. 4-Aminophenyl disulfide 98% (4-AFD) was supplied from Biosynth and diglycidyl ether of bisphenol A (DGEBA) based epoxy resin (Epikote Resin HEXION 828) was purchased from Westlake Epoxy. All reagents were used as received.2.2. Synthesis and characterization
| Name | Epoxy (GPE) | Amine (4AFD) | Stoichiometry NH2/epoxy |
|---|---|---|---|
| MC 1.0 | 10 g | 16.6 g | 1.0 |
| MC 1.1 | 18.2 g | 1.1 | |
| MC 1.2 | 19.8 g | 1.2 | |
| MC 1.3 | 21.5 g | 1.3 | |
| MC 1.4 | 23.2 g | 1.4 |
2.2.1.1. Thermal treatment. The model compounds were heated to different temperatures and times commonly used in thermoforming and repair processes. To achieve this, we selected five distinct temperatures (200 °C, 205 °C, 210 °C, 215 °C, and 220 °C), exposing all prepared MCs to durations of 10, 30, and 60 minutes at each temperature. Subsequently, we analyzed the degradation of the different samples using NMR by dissolving them in DMSO-d6.
2.2.1.2. Data processing and analysis. 1H-NMR spectra were manually phased, and baseline adjusted using MestreNova v.12.0 (MestreLab Research, Spain) software and imported into MATLAB R2020b (Mathworks, Inc. USA) as a matrix with 80 rows (number of samples) and 131
![[thin space (1/6-em)]](https://www.rsc.org/images/entities/char_2009.gif) 072 columns (number of variables or data points). Each spectrum was referenced to the DMSO-d6 resonance signal (δH = 2.52 ppm) and only spectral regions with chemical shifts between 0 and 10 ppm were maintained. Only one out of ten columns was taken to reduce the number of data and speed up the analysis. The spectral regions of δH = 2.45–2.55 and δH = 3.30–3.37, which originate from the presence of DMSO and water, respectively, were omitted from the data.
072 columns (number of variables or data points). Each spectrum was referenced to the DMSO-d6 resonance signal (δH = 2.52 ppm) and only spectral regions with chemical shifts between 0 and 10 ppm were maintained. Only one out of ten columns was taken to reduce the number of data and speed up the analysis. The spectral regions of δH = 2.45–2.55 and δH = 3.30–3.37, which originate from the presence of DMSO and water, respectively, were omitted from the data.
The resultant matrix of 80 × 6440 was imported into The Unscrambler X 10.5.1 Client (Camo, Norway) software, where the spectra were smoothed using the Savitzky–Golay filter. The spectra were also subjected to a normalization procedure that divided each data point of a spectrum by the area under the corresponding spectrum to enhance the results. The PCA exploratory analysis was then carried out in The Unscrambler using the SVD algorithm after mean centering the data and validating the model by a random cross-validation. The MCR-ALS model was developed using MCR-ALS GUI 2.0 Toolbox installed in MATLAB R2020b.42 The optimum model was obtained using all 80 spectra and by selecting two components (non-degraded compound and degraded compound). As an initial estimation, the spectra of both a non-degraded and totally degraded sample were used and non-negativity constraints were applied in concentrations and spectra. By doing this, we are able to determine, for each of the samples and each of the conditions analysed, what is the percentage of the spectrum that coincides with the non-degraded sample and how much corresponds to the degraded one. In that way we can attempt to tie the different conditions with the degradation of the MC and use it to predict the degradation that the resin would suffer when it is exposed to those same conditions.
![[thin space (1/6-em)]](https://www.rsc.org/images/entities/char_2009.gif) :
:![[thin space (1/6-em)]](https://www.rsc.org/images/entities/char_2009.gif) amine molar ratio (1.0, 1.2 and 1.4), were prepared according to the previously described procedure.43 Briefly, at 80 °C, HEXION 828 resin was degassed for 30 minutes. After the resin was vacuum-degassed, the appropriate quantity of 4-AFD was added, mixed, and heated at 80 °C for 10 minutes. The resultant viscous liquid was then poured between two glass plates separated by a 3 mm silicon joint and cured at 120 °C for 2.5 hours and then post-cured at 150 °C for 2 hours. The complete cure of the epoxy vitrimers was confirmed by differential scanning calorimetry (DSC), where no residual exothermic cure peak was observed (Fig. S1†). Corresponding amounts of material used for each vitrimer are shown in the following table (Table 2).
amine molar ratio (1.0, 1.2 and 1.4), were prepared according to the previously described procedure.43 Briefly, at 80 °C, HEXION 828 resin was degassed for 30 minutes. After the resin was vacuum-degassed, the appropriate quantity of 4-AFD was added, mixed, and heated at 80 °C for 10 minutes. The resultant viscous liquid was then poured between two glass plates separated by a 3 mm silicon joint and cured at 120 °C for 2.5 hours and then post-cured at 150 °C for 2 hours. The complete cure of the epoxy vitrimers was confirmed by differential scanning calorimetry (DSC), where no residual exothermic cure peak was observed (Fig. S1†). Corresponding amounts of material used for each vitrimer are shown in the following table (Table 2).
| Name | Epoxy (HEXION 828) | Amine (4AFD) | Stoichiometry NH2/epoxy |
|---|---|---|---|
| V 1.0 | 10 g | 3.30g | 1.0 |
| V 1.2 | 3.96g | 1.2 | |
| V 1.4 | 4.62g | 1.4 |
In the case of dynamic resins, the above-mentioned procedure was carried out on the vitrimers using the same procedural stages and methodology. To validate the obtained results in MCs with vitrimers, only certain times and temperatures were selected. More specifically, we chose the lower, medium and higher conditions (at 200 °C for 10 and 60 minutes, at 210 °C for 30 minutes, and at 220 °C for 10 and 60 minutes).
2.2.2.1. Evaluation of the degradation. 1H Nuclear Magnetic Resonance (1H-NMR) spectroscopy was performed on a Bruker Avance NEO 500 MHz at the resonance frequency of 500 MHz using deuterated dimethyl sulfoxide (DMSO-d6) solvent at room temperature. Using a DSC from TA Instruments (Discovery DSC 25 Auto controlled by TRIOS software), measurements of differential scanning calorimetry (DSC) were made throughout a temperature range of 25 °C to 200 °C under nitrogen at scan rates of 10 °C min−1 and 20 °C min−1. The inflection point of the heat flow step was used to determine the glass transition temperature (Tg). The thermogravimetric isothermal measurements (TGA) were carried out using TA Instruments Q500 equipment and TA Universal Analysis software. Isothermal tests were carried out in an air-conditioned environment at 200 °C, 210 °C, and 220 °C. Thermomechanical tests were carried out utilizing TA Instruments DMA Q800 equipment from 25 to 250 °C using rectangular samples (12.5 × 2 × 17.5 mm) on a single cantilever beam. The amplitude of the oscillation (15 m) (within a linear viscoelastic zone) and frequency (1 Hz) were held constant at a heating rate of 3 °C min−1 while variations in force and phase angle were measured.
3. Results and discussion
3.1. Evaluation of degradation in model compounds using 1H NMR and chemometrics
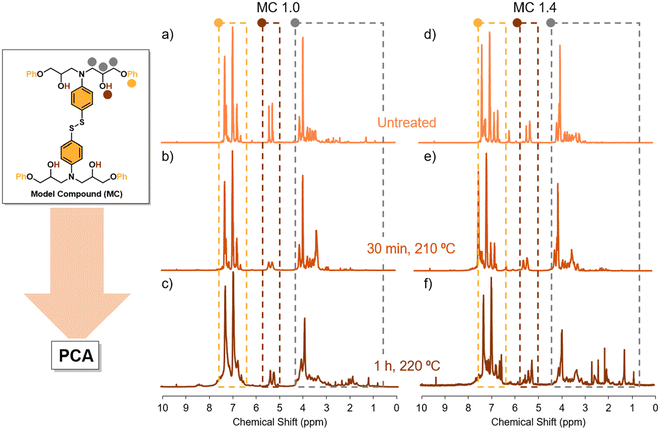
The principal objective of this work is to obtain an easy and reliable method to estimate the extent of degradation of the vitrimer without knowing the specific secondary reactions that are occurring during reprocessing. To validate the process, we investigate networks based on aromatic disulfides, which have shown great potential to provide highly reprocessable materials. Thus, 5 model compounds were prepared by reacting glycidyl phenyl ether (GPE) and 4-AFD with different excess of amine (1.0, 1.1, 1.2, 1.3 and 1.4) as outlined in Table 1. The excess of amine greatly influences the dynamicity of the networks, but little is known about its impact on degradability (Fig. 2).First, the 5 model compounds were analysed by 1H NMR following thermal treatment. 16 different spectra were acquired for each stoichiometric ratio, at different times and temperatures. Fig. 3 shows some representative spectra of MC 1.0 (with no excess of amine) and MC 1.4 (with 0.4 excess of amine) at different treatment conditions: the untreated MC and when a sample following treatment at 210 °C for 30 minutes and at 220 °C for 60 minutes. As expected, some new signals, which become more obvious at elevated temperatures, are observed after the heat treatment in both samples (Fig. 3c and f).
It can be seen that in the spectrum of the equimolar sample (MC 1.0) subjected to a treatment of 210 °C for 30 min and 1 h (Fig. 2b and c, respectively) some new peaks of high intensity are present in the spectral region δH = 1.00–3.00, which are negligible in the non-degraded sample. In addition, in the aliphatic region (δH = 3.00–4.00) a broadening of the signals is observed, suggesting the presence of new compounds. Furthermore, a partial disappearance of the doublet at 5.25 ppm is observed, which corresponds to alcohol signals. The disappearance of O–H signal has been associated to dehydration reactions were two C–OH groups dehydrate to form an ether bond.44 Finally, a new broadening in the spectral region δH = 6.50–7.50 also appears. In the samples with excess amine (MC 1.4) the corresponding amine peak can be seen in the region δH = 6.00–6.50 (Fig. 3). The interpretation of the degradation spectra is extremely complicated and while we can hypothesize some degradation pathways to evaluate the impact of the conditions in the degradation, this will be highly time-consuming and will likely vary for each of the 5 model compounds. As an alternative, we can implement PCA analysis, aimed at unravelling complex datasets by condensing their dimensions while preserving crucial variability (Fig. 4).
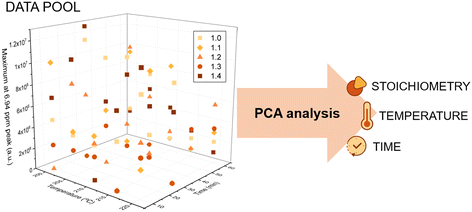
In other words, by generating a new set of unrelated components, known as principal components (PCs), PCA effectively captures the most significant variance in the data. First, we have a 3D matrix where the axes correspond to the temperature, time and intensity of a peak. For example, in Fig. 4, we can see how the signal at 6.94 ppm changes as a function of time and temperature for the 5 different model reactions. As in our case we do not have well-defined signals that we could correlate with degradation, the PCA analysis evaluates the changes in the entire spectrum. From this data, PCA extracts the variables that are most reflective of changes in the NMR spectra. Thus, the algorithm finds the Principal Components (PC), a simplified two-component representation (PC1 and PC2) to facilitate the understanding of which of the different variables has more influence in the system. Fig. 5 illustrates the PC1 vs. PC2 sample distribution, grouping the measurements according to the stoichiometry, temperature, and time.
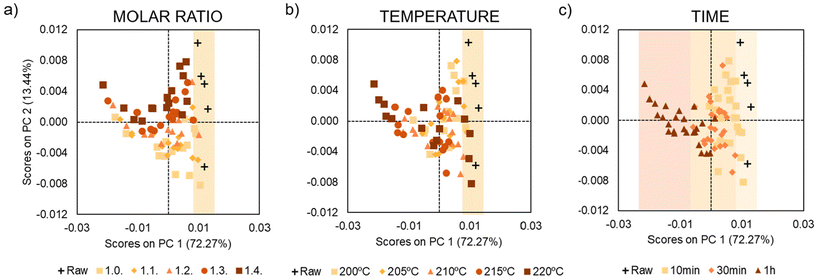 | ||
| Fig. 5 PCA scores plot (PC1 vs. PC2) of the 80 samples spectra according to the corresponding treatment: (a) stoichiometry, (b) temperature and (c) time. | ||
First, we studied the influence of time on the degradation process. Fig. 5c corresponds to the sample distribution of the PCA when the measurements are grouped according to the time (raw samples (black), 10 minutes (yellow), 30 minutes (orange) and 60 minutes (brown)). In this type of graph, when samples appear in the same area, it means that these samples are similar. Therefore, in the present study, if some samples appear in the same area of graph, the conclusion is that they have similar NMR spectra, because they have suffered degradation to a similar extent. Moreover, if the data are well sorted it means that the PC has a great influence on the data. Thus, looking at the PCA analysis graph based on the change of time for our system, the conclusion that can be drawn is that time is a very influential variable in the degradation of the system. Indeed, the 5 raw samples in black (attributed to the 5 different model compounds) are found in the right side of the PCA scores plot. Furthermore, the longer the time that we expose the sample to a given condition, the further to the left a sample appears, which could be correlated with the degradation, as raw samples are not degraded. In conclusion, PCA scores based on the change of time show that time significantly affects the degradation of aromatic disulfides.
After the analysis of the influence of time, we moved on and analysed the impact of temperature and the molar ratio on the degradation. In contrast to the case of time, in these cases, we did not observe any trend or order in the location of the data (Fig. 5a and b). Note that although the raw data are on the right-hand side of the graphs in both cases, there is no trend for the rest of the samples. As mentioned above, only the variables that influence the system form clusters in the graphs. Thus, the preliminary conclusion is that temperature may have an influence on the degradation of the system, but it is strongly affected by other variables such as time. To simplify the PCA analysis further, we reprocessed the sample data and analysed the effect of the temperature and excess of amine, keeping the time constant. In other words, we generate three different graphs eliminating the time variable (Fig. 6 and 7).
 | ||
| Fig. 6 PCA scores plot (PC1 vs. PC2) based on temperature for samples treated for (a) 10 minutes, (b) 30 minutes and (c) 60 minutes. | ||
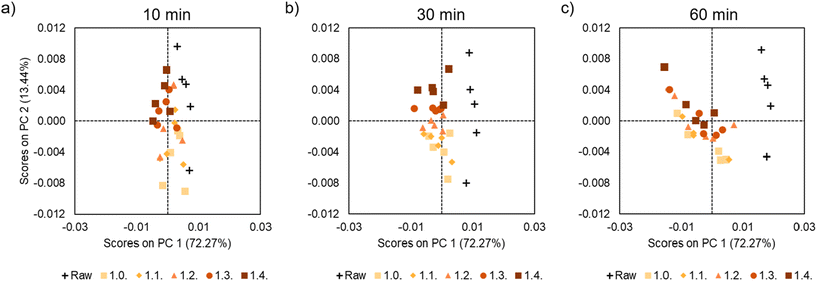 | ||
| Fig. 7 PCA scores plot (PC1 vs. PC2) for samples based on molar ratio (a) 10 minutes, (b) 30 minutes and (c) 60 minutes. | ||
Fig. 6 shows the PCA analysis for temperature separated for the different times. A clear organization and data distribution is observed based on the temperature variable. In this case, the samples clearly move away from the untreated samples as the temperature rises. This is more clearly visible in the graphs for longer heating intervals (30 and 60 minutes). As previously commented, it can be assumed that samples that are farther away from the raw samples will be more degraded. Therefore, it can be concluded that the higher the temperature, the more pronounced the degradation will be.
Another important conclusion that we could take from the PCA analysis is that the influence of temperature is less pronounced when the time is shorter, as at 10 min all the graphs are close to the raw samples. However, in the samples at 60 min, the samples at different temperatures are more clearly sorted. Indeed, the samples treated at higher temperatures (215 and 220 °C) appear on the left of the PCA graph, corroborating that longer times and temperatures lead to more degradation. Finally, Fig. 7 shows the PCA analysis at different times illustrating the samples are grouped according to the excess of amine. No significant trend or data distribution is observed, suggesting that this is the variable with the least influence on the degradation.
Therefore, we can conclude that the PCA analysis gives us the influence of time, temperature and molar ratio on the degradation of our system. In the present case, the most influential variable is time, followed by temperature and lastly, molar ratio. In addition, we corroborate how the influence of temperature increases as time increases. In other words, when we apply a heat treatment for 10 minutes the temperature does not affect as much as when we use 30 or 60 minutes.
Besides evaluating the influence of different variables on the degradation, it is important to be able to quantify the degree of degradation. To do so, together with the PCA, we implemented the Multivariate Curve Resolution (MCR) which is a chemometric technique used in spectroscopy to separate and quantify changes from complicated mixtures.35 Through the use of the technique, the data is separated into pure spectral profiles and concentration profiles, enabling precise analysis of mixed signals.37,38,41,45,46 In the current study the spectral profiles of a sample without degradation (raw sample) and another in which we assume that the compound has completely degraded given the conditions to which it has been exposed (1 h at 220 °C) were used as initial estimates. As a result, from the obtained concentration profiles from the MCR model we could calculate how much each spectrum matches with the spectra employed as initial estimates. In other words, it could be calculated how similar each spectrum is to the non-degraded or degraded spectra (Table S1†).
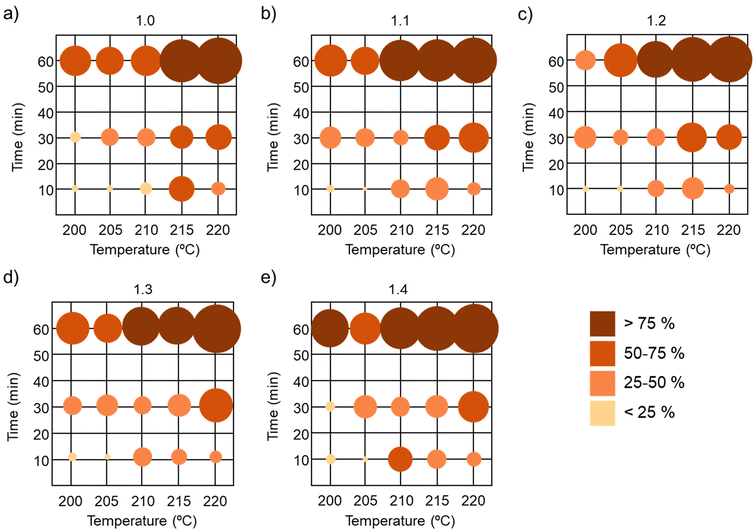
The 5 model compounds with different amine stoichiometry were represented and were divided into five groups according to the percent degradation estimated by the MCR model: non-degraded or slightly degraded samples (<25%); low degraded samples (between 25% and 50%); samples with high degradation (between 50% and 75%) and totally degraded samples (>75%) (Fig. 8).
Previously we have demonstrated that time is the most significant variable for degradation. Indeed, when analysing the impact of time, we can see that all the samples treated for 60 min had high degradation or were fully degraded. The second most influential parameter is the temperature. It can be seen that when heating the model compound to 215 °C or higher, significant degradation occurred in all samples, especially at prolonged times (30, 60 min). However, when subjected to only 10 minutes of heating at 200 °C and 205 °C, no significant degradation was observed, giving an interesting window to evaluate the processability of aromatic disulfide-based dynamic bonds. Finally, as expected, no significant impact of the stoichiometry can be observed in the degradation profile, since for the 5 stoichiometries similar degradation profiles were obtained.
3.2. Relation between 1H-NMR results and the degradation in the vitrimers
In order to assess if the data acquired with model compounds could be extrapolated to epoxy vitrimeric materials, 3 different vitrimers were prepared by varying the epoxy![[thin space (1/6-em)]](https://www.rsc.org/images/entities/char_2009.gif) :
:![[thin space (1/6-em)]](https://www.rsc.org/images/entities/char_2009.gif) amine molar ratio (1.0, 1.2 and 1.4), according to the previously described procedure.43 Briefly, at 80 °C, aromatic bisepoxide resin was reacted with the appropriate quantity of 4-AFD. Afterwards, the resultant viscous liquid was cured at 120 °C for 2.5 hours and then post-cured at 150 °C for 2 hours. The complete cure of the epoxy vitrimers was confirmed by differential scanning calorimetry (DSC), where no residual exothermic cure peak was observed (Fig. S1†). In order to evaluate potential degradation events occurring when reprocessing the epoxy resins, the Tg and the rubbery plateau of the resin were evaluated in the 3 model resins (V 1.0, V 1.2 and V 1.4) after processing at different times and temperatures.
amine molar ratio (1.0, 1.2 and 1.4), according to the previously described procedure.43 Briefly, at 80 °C, aromatic bisepoxide resin was reacted with the appropriate quantity of 4-AFD. Afterwards, the resultant viscous liquid was cured at 120 °C for 2.5 hours and then post-cured at 150 °C for 2 hours. The complete cure of the epoxy vitrimers was confirmed by differential scanning calorimetry (DSC), where no residual exothermic cure peak was observed (Fig. S1†). In order to evaluate potential degradation events occurring when reprocessing the epoxy resins, the Tg and the rubbery plateau of the resin were evaluated in the 3 model resins (V 1.0, V 1.2 and V 1.4) after processing at different times and temperatures.
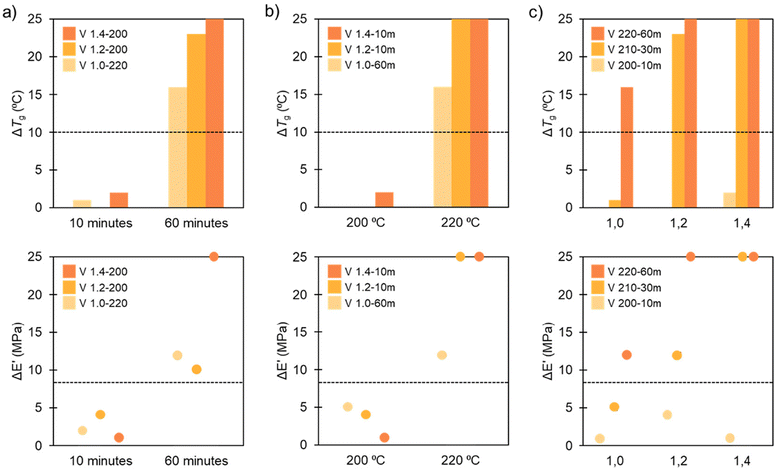
To evaluate the degradation of the material, we considered the change of Tg and rubbery plateau. Based on previous work done in our group,47 we deduced that a 10 °C decrease in Tg marks the start of the degradation of the network. In the case of the rubbery plateau, the onset of degradation is marked when the modulus is reduced by >8 MPa. As analyzed in the model compounds, time had the strongest impact on the degradation process of our system. We extrapolated this hypothesis to the polymer networks and confirmed it, using DMA analysis (Fig. 9). For this purpose, we chose 3 different stoichiometries (1.0, 1.2 and 1.4) at the 2 extreme times and temperatures (10–60 minutes and 200–220 °C). The criterion for degradation is represented by the changes in Tg and rubbery plateau.
When the studied variable was time (Fig. 9a), the difference between treating the vitrimer for 10 minutes and for 60 minutes could be observed easily. For all three stoichiometries, there was no degradation at 10 minutes at different temperatures and molar ratios, but when we increased the time to 60 minutes, all of them showed total degradation, as shown by the large changes in Tg and rubbery plateau.
Temperature is the second most important factor in our system's degradation process; thus, we did three more random DMA evaluations of our vitrimeric networks to see if this variable altered the extent of degradation. As previously stated, the rubbery plateau and variations in Tg determined the deterioration criteria. Fig. 9b shows that when the temperature was raised to 220 °C, all three systems degraded, with a significant decrease in Tg and rubbery plateau. However, the degradation was very different for the samples at 200 °C, where none of the cases exhibited any degradation at any of the three different times or molar ratios. This corroborates that the temperature limit in the degradation process is 210 °C and that temperature has a significant influence in the degradation process.
The molar ratio is not a very significant variable compared to the other two (time and temperature). In Fig. 9c it can be seen that in some cases the molar ratio has an influence, but not in every instance. For example, in both the lightest conditions (200 °C, 10 minutes) and in the most aggressive ones (220 °C, 60 minutes), there was no influence of the molar ratio. Nevertheless, in intermediate conditions, for example, 210 °C for 30 minutes, a slight influence of the stoichiometry was observed. In general, the degradation is higher when the excess of amine was increased but the influence of the molar ratio is not clear and we cannot conclude whether the stoichiometry has a real impact on the degradation.
4. Conclusions
In this work, it has been shown that NMR spectra of model compounds coupled with chemometrics makes it possible to evaluate the importance of different variables in the degradation process of vitrimeric materials. By evaluating a total of 80 NMR spectra of model aromatic disulfide compounds that were treated under different conditions, we can conclude that the most influential variable causing degradation in aromatic disulfides is time, followed by temperature and finally, the molar ratio. A Multivariate Curve Resolution model was applied to assign degradation values to the different conditions studied. This makes it possible to obtain a map of the percentage of degradation under different conditions. With this information in hand, we can assume that in order to reduce the degradation of vitrimers based on aromatic disulfides, the samples must be processed in short times (such as 10 minutes), and at temperatures below 210 °C to avoid significant degradation. To corroborate that this model is suitable for extension to polymeric resins, we prepared some vitrimers based on aromatic disulfides and performed DMA analysis of the vitrimeric network before and after reprocessing. It was observed that the trends observed using the model compounds and chemometrics clearly agrees with the degradation events occurring in the network, showing a greater impact of time and temperature on the degradation than stoichiometry. It can be concluded that the use of chemometrics can provide valuable insights to define the best conditions for reprocessing vitrimeric networks. In that way, studying the NMR spectra of the model compounds can give us information on how the resin would degrade under the same conditions.Data availability
The authors confirm that the data supporting the findings of this study are available within the article and its ESI.†Conflicts of interest
There are no conflicts to declare.Acknowledgements
H.S. acknowledges the financial support from el Ministerio de ciencia e innovación from the TED2021-129852B-C22 funded. M. X. acknowledges the grant from Fellows Gipuzkoa (G75067454). by MCIU/AEI/10.13039/501100011033 and by the European Union NextGenerationEU/PRTR and the grant PID2022-138199NB-I00 funded by MCIU/AEI/10.13039/501100011033.References
- M. E. Bracchi and D. A. Fulton, Orthogonal Breaking and Forming of Dynamic Covalent Imine and Disulfide Bonds in Aqueous Solution, Chem. Commun., 2015, 51(55), 11052–11055, 10.1039/C5CC02716K.
- B. T. Michal, C. A. Jaye, E. J. Spencer and S. J. Rowan, Inherently Photohealable and Thermal Shape-Memory Polydisulfide Networks, ACS Macro Lett., 2013, 2(8), 694–699, DOI:10.1021/mz400318m.
- A. Wilson, G. Gasparini and S. Matile, Functional Systems with Orthogonal Dynamic Covalent Bonds, Chem. Soc. Rev., 2014, 43(6), 1948–1962, 10.1039/C3CS60342C.
- W. Zou, J. Dong, Y. Luo, Q. Zhao and T. Xie, Dynamic Covalent Polymer Networks: From Old Chemistry to Modern Day Innovations, Adv. Mater., 2017, 29(14), 1606100, DOI:10.1002/adma.201606100.
- C. Zhang, B. Jin, X. Cao, Z. Chen, W. Miao, X. Yang, Y. Luo, T. Li and T. Xie, Dielectric Polymer with Designable Large Motion under Low Electric Field, Adv. Mater., 2022, 34(50), 2206393, DOI:10.1002/adma.202206393.
- H. Xu, S. Zhao, A. Yuan, Y. Zhao, X. Wu, Z. Wei, J. Lei and L. Jiang, Exploring Self–Healing and Switchable Adhesives Based on Multi–Level Dynamic Stable Structure, Small, 2023, 19(26), 2300626, DOI:10.1002/smll.202300626.
- X. Niu, F. Wang, X. Li, R. Zhang, Q. Wu and P. Sun, Using Zn 2+ Ionomer To Catalyze Transesterification Reaction in Epoxy Vitrimer, Ind. Eng. Chem. Res., 2019, 58(14), 5698–5706, DOI:10.1021/acs.iecr.9b00090.
- M. M. Obadia, B. P. Mudraboyina, A. Serghei, D. Montarnal and E. Drockenmuller, Reprocessing and Recycling of Highly Cross-Linked Ion-Conducting Networks through Transalkylation Exchanges of C–N Bonds, J. Am. Chem. Soc., 2015, 137(18), 6078–6083, DOI:10.1021/jacs.5b02653.
- B. Hendriks, J. Waelkens, J. M. Winne and F. E. Du Prez, Poly(Thioether) Vitrimers via Transalkylation of Trialkylsulfonium Salts, ACS Macro Lett., 2017, 6(9), 930–934, DOI:10.1021/acsmacrolett.7b00494.
- K. Bui, A. M. Wemyss, R. Zhang, G. T. M. Nguyen, C. Vancaeyzeele, F. Vidal, C. Plesse and C. Wan, Tailoring Electromechanical Properties of Natural Rubber Vitrimers by Cross-Linkers, Ind. Eng. Chem. Res., 2022, 61(25), 8871–8880, DOI:10.1021/acs.iecr.2c01229.
- S. J. Rowan, S. J. Cantrill, G. R. L. Cousins, J. K. M. Sanders and J. F. Stoddart, Dynamic Covalent Chemistry, Angew. Chem., Int. Ed., 2002, 41(6), 898–952, DOI:10.1002/1521-3773(20020315)41:6<898::AID-ANIE898>3.0.CO;2-E.
- F. Sciortino, N. M. Sanchez-Ballester, S. H. Mir and G. Rydzek, Functional Elastomeric Copolymer Membranes Designed by Nanoarchitectonics Approach for Methylene Blue Removal, J. Inorg. Organomet. Polym. Mater., 2021, 31(5), 1967–1977, DOI:10.1007/s10904-021-01971-w.
- M. K. Smith and B. H. Northrop, Vibrational Properties of Boroxine Anhydride and Boronate Ester Materials: Model Systems for the Diagnostic Characterization of Covalent Organic Frameworks, Chem. Mater., 2014, 26(12), 3781–3795, DOI:10.1021/cm5013679.
- K. R. Tillman, R. Meacham, J. F. Highmoore, M. Barankovich, A. M. Witkowski, P. T. Mather, T. Graf and D. A. Shipp, Dynamic Covalent Exchange in Poly(Thioether Anhydrides), Polym. Chem., 2020, 11(47), 7551–7561, 10.1039/D0PY01267J.
- J. M. Winne, L. Leibler and F. E. Du Prez, Dynamic Covalent Chemistry in Polymer Networks: A Mechanistic Perspective, Polym. Chem., 2019, 10(45), 6091–6108, 10.1039/C9PY01260E.
- D. Montarnal, M. Capelot, F. Tournilhac and L. Leibler, Silica-Like Malleable Materials from Permanent Organic Networks, Science, 2011, 334(6058), 965–968, DOI:10.1126/science.1212648.
- W. Denissen, J. M. Winne and F. E. Du Prez, Vitrimers: Permanent Organic Networks with Glass-like Fluidity, Chem. Sci., 2016, 7(1), 30–38, 10.1039/C5SC02223A.
- A. Erice, A. Ruiz de Luzuriaga, J. M. Matxain, F. Ruipérez, J. M. Asua, H.-J. Grande and A. Rekondo, Reprocessable and Recyclable Crosslinked Poly(Urea-Urethane)s Based on Dynamic Amine/Urea Exchange, Polymer, 2018, 145, 127–136, DOI:10.1016/j.polymer.2018.04.076.
- B. D. Fairbanks, S. P. Singh, C. N. Bowman and K. S. Anseth, Photodegradable, Photoadaptable Hydrogels via Radical-Mediated Disulfide Fragmentation Reaction, Macromolecules, 2011, 44(8), 2444–2450, DOI:10.1021/ma200202w.
- V. Schenk, R. D'Elia, P. Olivier, K. Labastie, M. Destarac and M. Guerre, Exploring the Limits of High- Tg Epoxy Vitrimers Produced through Resin-Transfer Molding, ACS Appl. Mater. Interfaces, 2023, 15(39), 46357–46367, DOI:10.1021/acsami.3c10007.
- A. Ruiz de Luzuriaga, N. Markaide, A. M. Salaberria, I. Azcune, A. Rekondo and H. J. Grande, Aero Grade Epoxy Vitrimer towards Commercialization, Polymers, 2022, 14(15), 3180, DOI:10.3390/polym14153180.
- D. Berne, F. Cuminet, S. Lemouzy, C. Joly-Duhamel, R. Poli, S. Caillol, E. Leclerc and V. Ladmiral, Catalyst-Free Epoxy Vitrimers Based on Transesterification Internally Activated by an α–CF 3 Group, Macromolecules, 2022, 55(5), 1669–1679, DOI:10.1021/acs.macromol.1c02538.
- V. Schenk, K. Labastie, M. Destarac, P. Olivier and M. Guerre, Vitrimer Composites: Current Status and Future Challenges, Mater. Adv., 2022, 3(22), 8012–8029, 10.1039/D2MA00654E.
- L. Pursche, A. Wolf, T. Urbaniak and K. Koschek, Benzoxazine/Amine-Based Polymer Networks Featuring Stress-Relaxation and Reprocessability, Front. Soft Matter, 2023, 3, 1, DOI:10.3389/frsfm.2023.1197868.
- Y.-Y. Liu, G.-L. Liu, Y.-D. Li, Y. Weng and J.-B. Zeng, Biobased High-Performance Epoxy Vitrimer with UV Shielding for Recyclable Carbon Fiber Reinforced Composites, ACS Sustainable Chem. Eng., 2021, 9(12), 4638–4647, DOI:10.1021/acssuschemeng.1c00231.
- L. Jiang, Y. Tian, X. Wang, J. Zhang, J. Cheng and F. Gao, A Fully Bio-Based Schiff Base Vitrimer with Self-Healing Ability at Room Temperature, Polym. Chem., 2023, 14(7), 862–871, 10.1039/D2PY00900E.
- Y. Gao, Z. Deng, F. Wang and P. Sun, Achieving Long Lifetime of Room-Temperature Phosphorescence via Constructing Vitrimer Networks, Mater. Chem. Front., 2022, 6(8), 1068–1078, 10.1039/D2QM00003B.
- A. Watts and M. A. Hillmyer, Aliphatic Polyester Thermoplastic Elastomers Containing Hydrogen-Bonding Ureidopyrimidinone Endgroups, Biomacromolecules, 2019, 20(7), 2598–2609, DOI:10.1021/acs.biomac.9b00411.
- C. M. Hamel, X. Kuang, K. Chen and H. J. Qi, Reaction-Diffusion Model for Thermosetting Polymer Dissolution through Exchange Reactions Assisted by Small-Molecule Solvents, Macromolecules, 2019, 52(10), 3636–3645, DOI:10.1021/acs.macromol.9b00540.
- V. Zhang, B. Kang, J. V. Accardo and J. A. Kalow, Structure–Reactivity–Property Relationships in Covalent Adaptable Networks, J. Am. Chem. Soc., 2022, 144(49), 22358–22377, DOI:10.1021/jacs.2c08104.
- M. Hayashi, Rheological Characteristics of Cross-Linked Materials with Associative Bond Exchange Mechanisms, Nihon Reoroji Gakkaishi, 2022, 50(1), 15–20, DOI:10.1678/rheology.50.15.
- A. Perego and F. Khabaz, Creep and Recovery Behavior of Vitrimers with Fast Bond Exchange Rate, Macromol. Rapid Commun., 2023, 44(1), 2200313, DOI:10.1002/marc.202200313.
- A. Perego and F. Khabaz, Volumetric and Rheological Properties of Vitrimers: A Hybrid Molecular Dynamics and Monte Carlo Simulation Study, Macromolecules, 2020, 53(19), 8406–8416, DOI:10.1021/acs.macromol.0c01423.
- M. Goh, H. Shin and C. B. Kim, Manipulating Bond Exchange Rates in vitrimer– Hexagonal Boron Nitride Nanohybrids via Heat Capacity Enhancement, J. Appl. Polym. Sci., 2021, 138(12), 50079, DOI:10.1002/app.50079.
- P. Ebrahimi, N. Viereck, R. Bro and S. B. Engelsen, Chemometric Analysis of NMR Spectra, in Modern Magnetic Resonance, Springer International Publishing, Cham, 2018, pp. 1649–1668. DOI:10.1007/978-3-319-28388-3_20.
- J. S. McKenzie, J. A. Donarski, J. C. Wilson and A. J. Charlton, Analysis of Complex Mixtures Using High-Resolution Nuclear Magnetic Resonance Spectroscopy and Chemometrics, Prog. Nucl. Magn. Reson. Spectrosc., 2011, 59(4), 336–359, DOI:10.1016/j.pnmrs.2011.04.003.
- T. Hirano, R. Kamiike, Y. Hsu, H. Momose and K. Ute, Multivariate Analysis of 13C NMR Spectra of Branched Copolymers Prepared by Initiator-Fragment Incorporation Radical Copolymerization of Ethylene Glycol Dimethacrylate and Tert-Butyl Methacrylate, Polym. J., 2016, 48(7), 793–800, DOI:10.1038/pj.2016.16.
- D. Masato, D. Kazmer and A. Gruber, Meta–analysis of Thermal Contact Resistance in Injection Molding: A Comprehensive Literature Review and Multivariate Modeling, Polym. Eng. Sci., 2023, 63(12), 3923–3937, DOI:10.1002/pen.26496.
- R. Watanabe, S. Nakamura, A. Sugahara, M. Kishi, H. Sato, H. Hagihara and H. Shinzawa, Revealing Molecular-Scale Structural Changes in Polymer Nanocomposites during Thermo-Oxidative Degradation Using Evolved Gas Analysis with High-Resolution Time-of-Flight Mass Spectrometry Combined with Principal Component Analysis and Kendrick Mass Defect Analysis, Anal. Chem., 2024, 96(6), 2628–2636, DOI:10.1021/acs.analchem.3c05269.
- F. Bueno, L. Fultz, C. Husseneder, M. Keenan and S. Sathivel, Biodegradability of Bacterial Cellulose Polymer below the Soil and Its Effects on Soil Bacteria Diversity, Polym. Degrad. Stab., 2023, 217, 110535, DOI:10.1016/j.polymdegradstab.2023.110535.
- A. Rácz, D. Tátraaljai and S. Klébert, Determination of Melt Flow Index and Polymer Additives in Polyethylene Based on IR Spectra and Multivariate Modeling, Mater. Today Chem., 2023, 33, 101671, DOI:10.1016/j.mtchem.2023.101671.
- J. Jaumot, A. de Juan and R. Tauler, MCR-ALS GUI 2.0: New Features and Applications, Chemom. Intell. Lab. Syst., 2015, 140, 1–12, DOI:10.1016/j.chemolab.2014.10.003.
- A. Ruiz de Luzuriaga, J. M. Matxain, F. Ruipérez, R. Martin, J. M. Asua, G. Cabañero and I. Odriozola, Transient Mechanochromism in Epoxy Vitrimer Composites Containing Aromatic Disulfide Crosslinks, J. Mater. Chem. C, 2016, 4(26), 6220–6223, 10.1039/C6TC02383E.
- Y. Pérez, M. Casado, D. Raldúa, E. Prats, B. Piña, R. Tauler, I. Alfonso and F. Puig-Castellví, MCR-ALS Analysis of 1H NMR Spectra by Segments to Study the Zebrafish Exposure to Acrylamide, Anal. Bioanal. Chem., 2020, 412(23), 5695–5706, DOI:10.1007/s00216-020-02789-0.
- S. Lindner, R. Burger, D. N. Rutledge, X. T. Do, J. Rumpf, B. W. K. Diehl, M. Schulze and Y. B. Monakhova, Is the Calibration Transfer of Multivariate Calibration Models between High- and Low-Field NMR Instruments Possible? A Case Study of Lignin Molecular Weight, Anal. Chem., 2022, 94(9), 3997–4004, DOI:10.1021/acs.analchem.1c05125.
- A. Ruiz de Luzuriaga, R. Martin, N. Markaide, A. Rekondo, G. Cabañero, J. Rodríguez and I. Odriozola, Epoxy Resin with Exchangeable Disulfide Crosslinks to Obtain Reprocessable, Repairable and Recyclable Fiber-Reinforced Thermoset Composites, Mater. Horiz., 2016, 3(3), 241–247, 10.1039/C6MH00029K.
- A. Ruiz de Luzuriaga, R. Martin, N. Markaide, A. Rekondo, G. Cabañero, J. Rodríguez and I. Odriozola, Mater. Horiz., 2016, 3, 241, 10.1039/c6mh00029k.
Footnote |
| † Electronic supplementary information (ESI) available. See DOI: https://doi.org/10.1039/d4lp00156g |
| This journal is © The Royal Society of Chemistry 2024 |


