Au single atom-anchored WO3/TiO2 nanotubes for the photocatalytic degradation of volatile organic compounds†
Xiaoguang
Wang
,
Honghui
Pan
,
Minghui
Sun
and
Yanrong
Zhang
 *
*
Environmental Science Research Institute, Huazhong University of Science and Technology, Wuhan 430074, China. E-mail: yanrong_zhang@hust.edu.cn
First published on 17th November 2021
Abstract
Owing to the 100% atom utilization and the high activity, single atom catalysts (SACs) toward photocatalytic oxidation (PCO) represent a promising technology. However, its practical industrial application has been still limited by the complex synthesis methods of the catalyst. Herein, a simple two-step electrochemical approach was developed to synthesize an atomically dispersed Au-loaded WO3/TiO2 nanotubes array for volatile organic compounds (VOCs) oxidation. Au atoms were proved to be anchored by oxygen vacancies (OVs) on the WO3 surface, which significantly enhanced the separation and transfer of photogenerated carriers and the adsorption of toluene, achieving a 95.4% degradation and 85.5% mineralization rate for toluene removal. More importantly, the strong metal-support interaction led to the thermodynamic stability of the Au single atoms, and therefore, the stable toluene degradation cycle was achieved. This work is especially of great industrial significance for application of photocatalytic VOCs removal by SACs technique.
Introduction
Volatile organic compounds (VOCs), widely used in numerous industrial applications (e.g., chemical synthesis, coating and building materials), have become a social and scientific concern as it presents a huge issue that threats the sustainability of ecosystems and human health.1–3 They can occur in photochemical reactions and cause secondary pollutants, such as PM2.5 and ozone. Some of them, such as the benzene series, would trigger the “sick building syndrome”, including mucous membrane irritation, headache and fatigue. Furthermore, some of them are known to be carcinogenic.4 The wise way to control the adverse impact of VOCs is to eliminate them prior to the discharge. Among the existing techniques, such as thermal and catalytic combustion, absorption, biofiltration for eliminating VOCs,5–7 photocatalytic oxidation (PCO) has attracted much attention due to its low cost and no secondary pollution.8,9 However, the efficiency and stability of PCO technology still needs to be further improved to meet the practical industrial application.Single-atom catalysis (SACs) for PCO has emerged as a promising method for the efficient removal of contaminants. The dispersion of isolated metal atoms on the support surfaces provided could maximize the atomic efficiency of precious metals, and minimize the costs associated with the synthesis and utilization of SACs.10–12 However, originating from the high surface energy of isolated single metal atoms on supports, the metal atom would tend to aggregate, forming clusters or nanoparticles.13,14 Therefore, appropriate synthetic strategies are essential for the preparation of SACs with these desirable properties. In order to synthesize high-quality SACs, several strategies have been invoked, including (i) designing coordination sites to adsorb and bind metal precursors or metal atoms; (ii) spatially confining single metal atoms into molecular cages; (iii) exploiting defect vacancies in supporting materials to anchor single atom. Among these approaches, the defect vacancies anchoring strategy is considered more prospective due to its universality and operability for metal oxide supports.15,16 The vacancies could alter the surrounding electronic structure and coordination environment, leading to the appearance of unsaturated coordination sites. These vacancies on supports serve as “traps” to capture metal precursors and anchor metal atoms during post-treatment.17–19
Nevertheless, the suboptimal vacancy introduction and single-atom loading method limit the practical application of SACs for VOC removal by PCO. A common method of introducing vacancies to anchor single atoms in metal oxides is assisted thermal treatment at high temperatures under reducing atmosphere (Ar, H2, NaBH4, etc.).17,20 On the other hand, general approaches for anchoring atomically dispersed metal atoms on vacancy typically employ bottom-up strategies, including atomic layer deposition (ALD), chemical vapor deposition (CVD), mass-selected soft-landing method (MSSL) and wet-chemistry method (e.g., co-precipitation method and impregnation method).10–12 Obviously, these approaches are highly infeasible and uneconomical for the scaling-up process of SACs. Therefore, it is essential to develop a simple and easy-to-operate method for anchoring atomically dispersed metals. Recently, a simple electrochemically self-doped approach to introduce oxygen vacancies (OVs) into TiO2 nanotubes-based compounds was developed in our previous works, by which the quantity and distribution of OVs could be tailored with respect to the duration of the applied cathodic potential.21,22 This mild electrochemical method makes it possible to introduce OVs to supports on an industrial scale. Moreover, the pulsed electrodeposition approach, which achieves a uniform distribution of loaded species and prevents their agglomeration, has been well established in our earlier works.23 This approach consisted of a low potential pulse to reduce noble metal ions and a high potential pulse to provide a sufficient relaxation duration to re-establish the concentration equilibrium of precious metal precursors, while the latter could effectively suppress the nucleation tendency of precious metals.24 These two mentioned methods do not involve the application of high temperature, strong reducing atmosphere and complex equipment. Therefore, bringing the advantages of the electrochemical method to develop single atom photocatalysis is of great practical significance.
In this study, a two-steps electrochemical approach with industrial application prospects was developed to anchor high density Au single atoms on oxygen vacancies of WO3 in the WO3/TiO2 nanotubes composite. Au was selected due to Au susceptibly sparking chemical reactions compared to that of the other metals precious metals according to the indirect relativistic orbital stretching effect (IROSE).25 Anchoring single Au atoms enhanced the charge-transport, reduced the electron–hole recombination and promoted the adsorption of toluene, thereby demonstrating excellent photocatalytic toluene removal performance. Owing to the increased metal-support interaction of the Au single atoms-anchored WO3/TiO2 nanotubes, thermodynamic stability of Au single atoms was achieved, thus ensuring the durability of the POC. Furthermore, the photocatalytic degradation mechanism of gaseous toluene was systematically studied by in situ FTIR spectroscopy.
Experimental
Preparation of OVs-W/T
TiO2 nanotubes (TNTs) were first prepared by an electrochemical anodization technique. Afterward, WO3 was loaded by an electrodeposition approach (W/T). More details are provided in the ESI.† Then, oxygen vacancies (OVs) were introduced into WO3/TiO2 nanotubes (OVs-W/T) by an optimized electroreduction step. The WO3/TiO2 nanotubes foil was subjected to a cathodic potential of −1.4 V (vs. SCE) in 0.1 M Na2SO4 aqueous electrolyte for 600 s under ambient temperature.Preparation of SAu-W/T
Single Au atoms were electrochemically loaded on OVs-W/T by the square wave pulse method. The OVs-W/T film was used as the working electrode. The electrolyte solution consisted of 0.1 M NaCl and 2.5 μM HAuCl4. The atomic Au was anchored on OVs by stepping the potential to −0.6 V vs. SCE for 5 s, followed by stepping back to −0.2 V for 5 s. The process was repeated for five cycles. The I–V curve of the square wave pulse method is shown in Fig. S1.† Subsequently, the as-prepared SAu-W/T composites were cleaned with deionized water followed by a drying at 60 °C. Au-W/T was the sample obtained by directly depositing Au into the W/T.Photoelectrochemical measurements
An electrochemical workstation in a three-electrode configuration was used to carry out photocurrent analysis. The prepared composite film with an exposed area of 2 cm × 1 cm served as the photoanode, which was placed with a Pt foil (counter electrode) and an SCE (reference electrode) in a quartz cell containing 0.5 M Na2SO4 aqueous electrolyte. The photoanode was irradiated by a 365 nm LED light source. Electrochemical impedance spectroscopy (EIS) was conducted using the same set-up. Further characterization details are provided in the ESI.†Reactor setup and experimental procedure
The photocatalytic degradation of toluene was carried out in a 15 ml quartz cell reactor with a magnetic bar placed at the bottom of the reactor to circulate air in it. The photocatalyst films were prepared in a dimension of 2 cm × 1 cm. The distance kept between the surface of the photocatalyst and two oppositely placed LED light sources (365 nm) was 1 cm. Before each experiment, the concentration of toluene was adjusted to 160 ppmv by diluting the standard gas (300 ppmv toluene) in the reactor with high-purity air. The concentration of toluene was detected by a gas chromatography instrument equipped with a flame ionization detector (FID).Results and discussion
Preparation and characterization
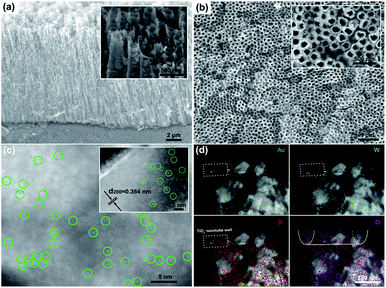
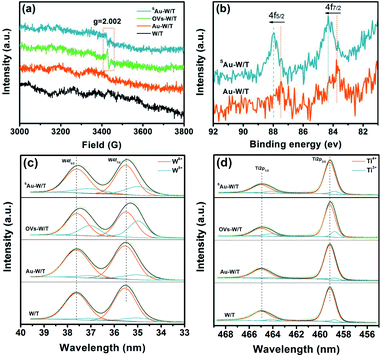
The morphological study by field emission scanning electron microscopy (FE-SEM, Fig. 1a and b) clearly showed a highly ordered TiO2 nanotube array loaded with WO3 nanoparticles. From the aberration-corrected high-angle annular dark-field transmission electron microscopy (HAADF-TEM), a large number of marked bright points dispersed on the (200) plane of monoclinic WO3 (Fig. S2†) were observed, confirming the atomic dispersion of Au on SAu-W/T (Fig. 1c). More HAADF-TEM images of single Au atoms are exhibited in Fig. S3.† According to the inductively coupled plasma atomic emission spectroscopy (ICP) results, the content of Au in SAu-W/T was 2.41 wt% (Table S1†). As shown in Fig. 1d, due to Ti elemental mapping and its lower brightness caused by weaker Z-contrast,26 the structure marked with dashed frame was considered as the TiO2 nanotubes wall. No Au element was observed on the wall, indicating the Au atoms were mainly distributed on the surface of WO3 nanoparticles rather than TiO2. Since WO3 is extremely sensitive to undergo reduction and self-doping, as we reported earlier,23 electrochemically reduced WO3 has stronger conductivity compared to TiO2. Thus, WO3 was easier to act as an electron donor for the reduction of Au3+ ions compared to the TiO2 nanotube walls, which led to Au atoms being preferentially loaded on WO3 containing a large number of OVs. In sharp contrast, withdrawing the electroreduction step for introducing OVs, with regard to Au-W/T, Au was dispersed on the surface of WO3 as clusters consisting of several Au atoms due to the lack of anchoring (Fig. S4†).To clarify the defects and Au state of the prepared samples, electron paramagnetic resonance (EPR) and X-ray photoelectron spectroscopy (XPS) analyses were performed. As seen in Fig. 2a, the EPR spectra exhibited a signal at g = 2.002 (3400–3480 G) for OVs-W/T and SAu-W/T, a characteristic signal of the hole-trapped O−.27,28 Notably, the OVs signal of SAu-W/T was weaker than that of its precursors, viz., OVs-W/T, giving strong evidence for anchoring Au on OVs. Owing to the bonding of the Au atoms with the W5+ near OVs, the unpaired electrons content decreased upon the square wave pulse step for anchoring Au, bringing about the decline of the OVs signal intensity.17,18,29 The XPS peaks of Ti 2p, W 4f, O 1s and adventitious carbon were found in all samples, and the XPS Au 4f peaks could be observed in SAu-W/T and Au-W/T (Fig. S5†).26 Notably, as seen in Fig. 2b, the XPS Au 4f5/2 and 4f7/2 binding energies of SAu-W/T positive shifted to higher energy values compared with that of Au-W/T. The high energy shift can be explained by an electrostatic final state effect. According to the electrostatic drop model, the ionization energy of a spherical metal droplet increases linearly as a function of the inverse cluster radius 1/R according to IP = IP(bulk) + αe2/4πε0R, where IP is the ionization potential and α represents a constant.17 Thus, the upshift in the binding energy indicated the smaller Au particle size of SAu-W/T compared to that of Au-W/T, which further implied the atomic dispersion of Au. The W 4f XPS spectra (Fig. 2c) exhibited two broad peaks, the W 4f7/2 located at 35.5 eV and the W 4f5/2 located at 37.6 eV. The Ti 2p XPS spectra also showed two characteristic peaks, viz., Ti 2p3/2 and Ti 2p1/2 centered at about 459.1 and 464.9 eV (Fig. 2d). Compared to the pristine W/T, the W 4f and Ti 2p peaks of the OVs-W/T sample negatively shifted obviously, which confirmed the formation of and W5+ and Ti3+.21,30 The W 4f and Ti 2p peaks of the SAu-W/T and Au-W/T also showed varying degrees of shift change, indicating the change of the W5+ and Ti3+ relative amounts.
To figure out the relative amounts of different oxidation states of Ti and W, the XPS spectra of Ti 2p and W 4f were strictly deconvoluted into their corresponding two doublets, i.e., the former as W5+ and W6+ and the latter as Ti3+ and Ti4+.31,32 As shown in Tables S2 and S3,† OVs-W/T showed the highest W5+ and Ti3+ concentration, up to 36.0% and 16.7%, respectively. The existence of OVs could be understood by the presence of W5+ and Ti3+ so as to meet the charge neutrality.33,34 Notably, the W5+ concentration of SAu-W/T was found to be significantly lower than that of OVs-W/T, which indicated the electron transfer from W5+ near the OVs to the Au single atom anchored at the OVs. Also, a very small decline of the Ti3+ concentration in SAu-W/T implied that almost no Au atoms were anchored on the OVs of TiO2. Whereas in the case of Au-W/T, the content of W5+ and Ti3+ was similar to that of the W/T due to the absence of OVs, as well as anchored Au atoms, which was identical with the EPR results.
The extended X-ray absorption fine structure (EXAFS) was measured to further clarify the single-atom state and distribution of Au. Fig. 3a presents the W L3-edge X-ray absorption near edge structure (XANES) spectra of SAu-W/T, OVs-W/T, and a monoclinic WO3 reference. The major features of the W L3-edge XANES spectra first negatively shifted by the introduction of oxygen vacancies, indicating the formation of the lower valence species, i.e., W5+. Then, it positively shifted by anchoring Au atoms, which again indicated a partial transformation of the W5+ to W6+. Moreover, the Fourier transformation at the R space was conducted for the EXAFS (FT-EXAFS) and different peaks were observed in Fig. 3b. The first peak, in the distance interval of 0.8–1.9 Å, was attributed to the first distorted shell containing 6 oxygen atoms. The second (2.3–3.1 Å) and the third (3.2–4 Å) were attributed to multiple scattering processes within the first shell of the WO6 octahedra and the first W–W coordination shell, respectively.35 The distance interval of the peaks could represent the length of the bond corresponding to their attribution. Obviously, by introducing OVs, the W–O bond (R = 1.0 Å) of OVs-W/T was notably shortened, compared to that (R = 1.38 Å) of W/T. During the electrochemical reduction process, the stable monoclinic WO3 would form HxWO3 with smaller cell parameters by proton insertion into the WO3 lattice, while generating W5+ and OVs, which led to a shortening of the W–O bond length. Moreover, by anchoring single Au atoms, the first peak of SAu-W/T shifted up to 1.32 Å. This was due to the Au atoms occupying the oxygen vacancy and bonding to its nearby atoms, elongating the W–O bond. For the Ti K-edge XANES spectra (Fig. 3c), the major features of the four pre-edge XANES (i.e., A1, A2, A3 and B) originated from induced electronic transitions from the hybridization orbitals of TiO2, in which the three A peaks were dominantly from the hybridization of the 3d–4p orbitals, while the B peak belonged to 1s transitions to the t2g and eg bands.36 As shown in Fig. 3d, three major Fourier-transform peaks appeared. The FT peak at 0.9–2.0 Å corresponded to the single scattering path of Ti → O by six-coordinated oxygen nearest neighbors around the Ti atom. The peaks at 2.5–3.0 and 3.0–4.0 Å were assigned to single scattering by the edge-shared octahedra and corner-shared octahedra, respectively, and both of them were due to the single scattering path of Ti → Ti by neighboring Ti atoms.37 Notably, introducing OVs also resulted in a shortening of the Ti–O bond, while anchoring single atoms did not lead to a change in the TiO2 bond length, which again indicated that the Au atoms were mainly distributed on WO3 rather than TiO2.
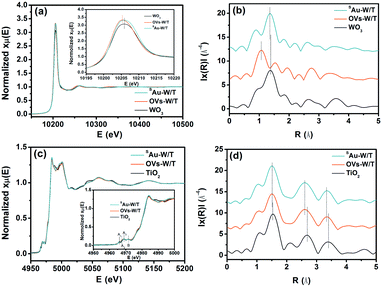 | ||
| Fig. 3 (a) Normalized XANES spectra and (b) Fourier transforms of the EXAFS at the W L3-edge. (c) Normalized spectra and (b) Fourier transforms of EXAFS at the Ti K-edge. | ||
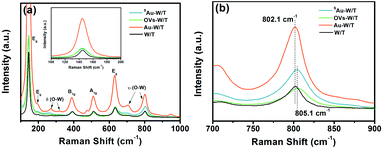
The formation of OVs and single Au atoms was further monitored by Raman spectroscopy. As seen in Fig. 4a, all samples exhibited 9 peaks, in which 5 were for anatase TiO2 and 4 for WO3. The peaks at 272, 326 cm−1 belonged to W–O bending modes [δ(O–W)] of the bridging oxygen, and the peaks at 708 and 806.5 cm−1 were assigned to the W–O stretching modes [ν(O–W)].32,38 The rest of the peaks were assigned to the Eg, A1g and B1g modes of TiO2.21 Evidently, the Raman signal intensity of Au-W/T was much higher than that of the other sample, which was attributed to the localized surface plasmon resonance (LSPR) effect of Au clusters. Under illumination, photo-induced electrons were generated from the nano-size Au. Then, they migrated to WO3 and TiO2, and inelastically collided with the electrons presented there. This promoted the vibration of W–O and Ti–O, and thus enhanced the surface Raman scattering.39 Nevertheless, LSPR of noble metals strongly depends on the cluster size.40 The LSPR effect of nano-scale Au is mainly because of intraband transitions between the outermost electrons within the Au 6s 1p hybridized atomic orbitals.
Meanwhile, the single Au atoms lack interband-transition and conduction electrons of Au, resulting in inability to arouse LSPR. Thus, the similar intensity of the δ(O–W) and ν(O–W) Raman peaks belonging to SAu-W/T and W/T suggested the lack of Au clusters and nanoparticles. Furthermore, the peaks assigned to WO3 underwent an upshift by introducing OVs and anchoring Au atoms. For instance, the ν(O–W) peak with the strongest signal intensity shifted from 802.1 cm−1 to 805.1 cm−1 (Fig. 4b), which can be interpreted as the shortening of W–O bonds due to the introduction of OVs,21 consistent with the EXAFS results.
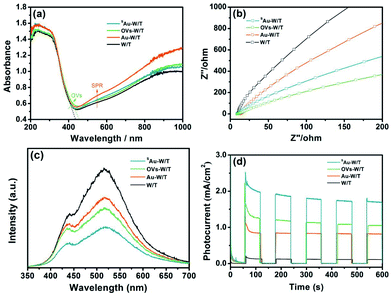
In general, the incorporation of OVs and metal species on the surfaces of semiconductor materials could improve their optical absorption, carrier separation and transfer, and thus the photoelectric performance.12,21,26 As seen in Fig. 5a, owing to the defect energy level by incorporating the OVs, the absorption edge of OVs-W/T red shifted.32,41 Moreover, owing to the LSPR effect, Au-W/T exhibited enhanced absorption in the visible and NIR regions. Likewise, the similar light absorption exhibited by SAu-W/T and W/T again indicated the absence of the Au cluster in SAu-W/T. The EIS study was carried out to characterize the interfacial resistance of the samples. As seen in Fig. 5b, a smaller semicircle was observed for the SAu-W/T compared to the W/T, indicating a reduced charge transfer resistance by anchoring Au atoms. In general, surface OVs and single metal atom facilitate the charge carrier separation due to the unsaturated property,10,21 while the enhanced carrier transfer property can promote the spatial separation of photogenerated electrons and holes,42,43 which definitely contributes to the improvement of the photoelectric performance. As seen in Fig. 5c, the PL spectra of the samples showed two fluorescence peaks. The peak at 450 nm was due to self-trapped excitons, and the peak at 530 was ascribed to the recombination of trapped holes (such as OVs). Introducing OVs, the PL signal of the OVs-W/T recorded using excited light of 320 nm weakened. Subsequently, anchoring Au atoms on OVs-W/T, the PL signal intensity of SAu-W/T further declined, indicating the significantly improved carrier separation. Consequently, compared with W/T, a 17-time higher photocurrent, up to 1.8 mA cm−2, was achieved from the SAu-W/T, corresponding to an incident photon-to-current conversion efficiency (IPCE) of 11.34% (IPCE values are summarized in Table S4†), which indicated that the separation efficiency of photoinduced electrons and holes was improved.44,45
Photocatalytic toluene degradation and mechanism
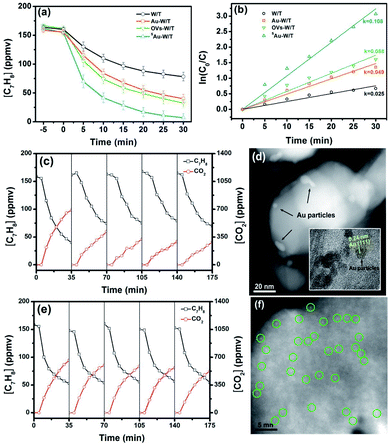
To compare the PCO activity of VOCs by the prepared samples, gaseous toluene was used as a model pollutant and subjected to the photocatalytic degradation. For every experimental run, the adsorption equilibrium of the composite and the pollutant was achieved by mixing them for a specified period, prior to the irradiation step of the photocatalytic system. As shown in Fig. 6a and b, under 365 nm irradiation from an LED source, a dramatic difference in the degradation kinetics of toluene was found for the prepared samples. The degradation efficiencies (DE) achieved in a period of 30 min by W/T, Au-W/T, OVs-W/T and SAu-W/T were 51.1%, 74.3%, 79.9% and 95.4%, respectively (DEtoluene = ([C7H8]0 min − [C7H8]60 min)/[C7H8]0 min × 100). Anchoring Au atom on the OVs of W/T significantly improved the degradation of toluene. The reaction kinetic rate of SAu-W/T was 0.108 min−1, 4.3-fold higher than that of W/T. The variation in the efficiency of the photocatalytic removal of toluene for the prepared samples was identical with the trend of the photocurrent density.One major concern for SAC is a substantial tendency for single atoms to aggregate due to their high surface energy, resulting in thermodynamic instability.10,13,14 As shown in Fig. 6c, on directly loading the Au species on W/T without OVs, the degradation performance of toluene by Au-W/T obviously deteriorated after one recycle experiment. After 5 cycles, its toluene degradation efficiency (DE) and the mineralization efficiency (ME) decreased from 74.3% and 63.3% to 56.7% and 25.2%, respectively. The deterioration was attributed to the decrease in the number of metal active centers caused by the aggregation of Au atoms. As shown in Fig. 6d, after the recycle experiment, the Au cluster consisting of a few atoms was aggregated into particles with a size of 2–5 nm. In sharp contrast, an excellent durability of degraded toluene by SAu-W/T during the recycle experiments was observed in Fig. 6e. Since Au atoms were anchored on OVs of W/T to achieve their thermodynamic stability, the aggregation tendency of single Au atoms was suppressed, which could be confirmed by the atomic dispersion of Au after the 5 recycle experiments, as shown in Fig. 6f. To further explore the possible intermediate species and the detailed toluene oxidation mechanism over SAu-W/T, in situ FTIR spectra were collected under 365 nm light irradiation (Fig. 7). Prior to light irradiation, toluene was adsorbed for 6 minutes to reach adsorption equilibrium on the surface. After the photocatalytic reaction, the bands at 2360 and 2341 cm−1 (Fig. 7c) corresponding to CO2 increased as the reaction proceeded, and some new IR features at 3750–3600 and 1700–1450 cm−1 were formed (Fig. 7b and d). A summary of the assigned IR modes to different functional groups is given in Table S5.†46–49 Among them, the bands at 1610, 1599, 1500 and 1492 cm−1 were assigned to the skeleton stretching and bending vibrations of the aromatic ring. The bands at 1467 and 1462 cm−1 were attributed to the C–O stretching vibration of benzyl alcohol. The bands at 1690 and 1676 cm−1 were associated with the stretching vibration of aldehydes, indicating the formation of benzaldehyde. The bands located at 1565, 1548 and 1529 cm−1 were assigned to the asymmetric stretching vibration of the carboxylate group from the benzoic acid species. The bands at 1581 and 1481 cm−1 were due to the C![[double bond, length as m-dash]](https://www.rsc.org/images/entities/char_e001.gif) C stretching vibration of benzoic acid. The one at 1658 cm−1 was assignable to the p-benzoquinone-type species. Moreover, IR modes related to some small molecule species were observed. The band at 1413 cm−1 was due to the C
C stretching vibration of benzoic acid. The one at 1658 cm−1 was assignable to the p-benzoquinone-type species. Moreover, IR modes related to some small molecule species were observed. The band at 1413 cm−1 was due to the C![[double bond, length as m-dash]](https://www.rsc.org/images/entities/char_e001.gif) O stretching vibrations of saturated aliphatic acids (formate and acetate). The bands at 1510 and 1442 cm−1 are assigned to the C
O stretching vibrations of saturated aliphatic acids (formate and acetate). The bands at 1510 and 1442 cm−1 are assigned to the C![[double bond, length as m-dash]](https://www.rsc.org/images/entities/char_e001.gif) O stretching vibrations and COO– stretching vibration of the maleate species, respectively, which could be produced by the catalytic oxidation of generated intermediate compounds during the degradation process. In addition, the bands at 1640 and 1630 cm−1 corresponding to the surface water species were observed in the FTIR spectra. The bands appearing in the range of 3750–3600 cm−1 were related to hydroxyl groups on the catalyst surface (Fig. 7d). The characteristic bands of the surface hydroxyls at 3695, 3682, 3662, 3641, 3603 cm−1 corresponded to the bridged –OH group. The band at 3621 cm−1 could be attributed to the O–H bending and stretching vibrations of carboxylic acids. Moreover, the bands at 3739, 3727, 3716 and 3704 cm−1 are assigned to the O–H stretching vibration of the terminal hydroxyls, which could further produce ˙OH radicals by the reaction between the photo-generated holes and the adsorbed hydroxyls species.
O stretching vibrations and COO– stretching vibration of the maleate species, respectively, which could be produced by the catalytic oxidation of generated intermediate compounds during the degradation process. In addition, the bands at 1640 and 1630 cm−1 corresponding to the surface water species were observed in the FTIR spectra. The bands appearing in the range of 3750–3600 cm−1 were related to hydroxyl groups on the catalyst surface (Fig. 7d). The characteristic bands of the surface hydroxyls at 3695, 3682, 3662, 3641, 3603 cm−1 corresponded to the bridged –OH group. The band at 3621 cm−1 could be attributed to the O–H bending and stretching vibrations of carboxylic acids. Moreover, the bands at 3739, 3727, 3716 and 3704 cm−1 are assigned to the O–H stretching vibration of the terminal hydroxyls, which could further produce ˙OH radicals by the reaction between the photo-generated holes and the adsorbed hydroxyls species.
Moreover, to clarify the effect of anchored Au on toluene adsorption, steady-state FTIR characterization for the different samples was carried out in toluene vapor. As shown in Fig. 7e, the FTIR peaks of SAu-W/T corresponding to the skeleton stretching and bending vibrations of the aromatic ring (1610 and 1500 cm−1) and the C–O stretching vibration mode of aromatic ring (2937 and 2884 cm−1) showed much higher intensity than that of other samples, indicating that SAu-W/T adsorbed more toluene. Since single metal centers have an unsaturated nature, the single Au sites would promote the adsorption of substrate molecules as widely reported,10–12 which undoubtedly facilitates the photocatalytic reaction process, including the formation of strong oxidative free radicals. As shown in Fig. 7e and f, the EPR results demonstrated the generation of ˙OH, as well as O2˙− radical species, both of which were crucial in the PCO reaction according to the quenching experiment over SAu-W/T (Fig. S6†).
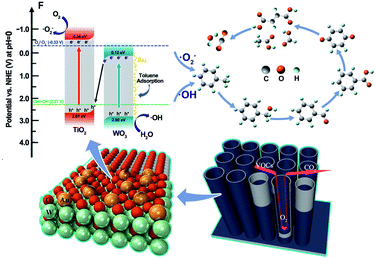
To clarify the transfer mechanisms of photogenerated carriers and generation of the ˙OH and O2˙− over the SAu-W/T, the ultraviolet photoelectron spectroscopy (UPS) measurements were carried out to ascertain the band structures (Fig. S7†). The conduction band (CB) and valence band (VB) potentials of electrochemically reduced TiO2 were about −0.56 and 2.61 eV, respectively, while two of the electrochemically reduced WO3 were about 0.12 and 2.90 eV, respectively. Notably, the CB potential of TiO2 is sufficiently negative to reduce O2 into O2˙−, while the CB potential of WO3 is more positive than the potential of O2˙−/O2. Thus, O2˙− should be produced by the CB of TiO2 rather than the CB of WO3, which followed the Z-scheme as widely reported about WO3/TiO2 heterojunction.50–54 The greater work function of WO3 than that of TiO2 leads to forming a built-in electric field that is directed from TiO2 to WO3 when their Fermi levels reach equilibrium. Consequently, the electron transfer occurs from the CB of WO3 to the VB of TiO2, resulting in aggregation of photogenerated electrons and holes in the CB of WO3 and VB of TiO2, respectively.
Based on the above results and analysis, as shown in Scheme 1, a PCO mechanism of gaseous toluene by SAu-W/T was proposed. The transfer mechanisms of photogenerated carriers over the WO3/TiO2 heterojunction followed the Z direction. Anchoring Au atoms on the OVs of WO3 significantly improved the separation and transfer of photogenerated carriers, which promoted the production of the ˙OH and O2˙−. In addition, anchoring Au significantly promoted toluene adsorption due to the construction of unsaturated coordination sites, which facilitated these radicals to attack the methyl group of toluene, generating benzyl alcohol, benzaldehyde and benzoic acid. With further oxidation, the p-benzoquinone-type species and its ring-opening products (such as formate, acetate and maleate), were obtained, which were eventually mineralized into CO2 and H2O.
Conclusion
In summary, atomically dispersed Au anchored by surface OVs of WO3 in WO3/TiO2 nanotubes was constructed, exhibiting a 1.8 mA cm−2 photocurrent, 17 times than that of the pristine WO3/TiO2 nanotubes, and the highest efficiency in degrading toluene. The enhancement in performance was ascribed to the significantly improved carrier transport and separation, as well as toluene adsorption. Furthermore, owing to the support-single metal atom strong interaction due to the anchoring by OVs, thermodynamic stability of Au atoms was achieved, resulting in the durability of VOCs degradation. Importantly, the entire fabrication steps, including the doping of OVs and anchoring of Au atoms, were based on electrochemical approaches. No practices of high temperature and reduced atmosphere were involved, which is highly viable and advantageous for the large-scale synthesis of SACs and practical application of SACs for PCO of VOCs.Author contributions
Xiaoguang Wang: conception, experimental investigation, manuscript writing, graphic visualization; Honghui Pan: data curation, experimental investigation; Minghui Sun: experimental investigation, graphic visualization; Yanrong Zhang: conception, resources, project administration, funding acquisition.Conflicts of interest
The authors declare no competing interests.Acknowledgements
This work partially was supported by the National Key Research and Development Program of China (No. 2020YFC1908704), the National Natural Science Foundation of China (52070082), the International Science & Technology Cooperation Program of Hubei Province (2020BHB023), and the International Science & Technology Cooperation Program of China (No. 2016YFE0126300). The authors thank the Analytical and Testing Center of HUST for the use of the Raman, SEM, TEM and XPS analysis facilities.Notes and references
- A. H. Mamaghani, F. Haghighat and C.-S. Lee, Appl. Catal., B, 2017, 203, 247–269 CrossRef CAS.
- J. Li, G. Zhang, W. Cui, W. Cen, Z. Wu, S. Lee and F. Dong, J. Mater. Chem. A, 2019, 7, 3366–3374 RSC.
- Z. Jiang, X. Feng, J. Deng, C. He, M. Douthwaite, Y. Yu, J. Liu, Z. Hao and Z. Zhao, Adv. Funct. Mater., 2019, 29, 1902041 CrossRef.
- D. Tobaldi, D. Dvoranová, L. Lajaunie, N. Rozman, B. Figueiredo, M. Seabra, A. S. Škapin, J. Calvino, V. Brezová and J. Labrincha, Chem. Eng. J., 2021, 405, 126651 CrossRef CAS PubMed.
- P. Wu, X. Jin, Y. Qiu and D. Ye, Environ. Sci. Technol., 2021, 55, 4268–4286 CrossRef CAS.
- H. Rajabi, M. H. Mosleh, T. Prakoso, N. Ghaemi, P. Mandal, A. Lea-Langton and M. Sedighi, Chemosphere, 2021, 283, 131288 CrossRef CAS.
- M.-F. Han, X.-R. Hu, Y.-C. Wang, Z. Tong, C. Wang, Z.-W. Cheng, K. Feng, M.-M. Qu, J.-M. Chen and J.-G. Deng, Crit. Rev. Environ. Sci. Technol., 2020, 1–31 CrossRef.
- R. Chen, J. Li, H. Wang, P. Chen, X. a. Dong, Y. Sun, Y. Zhou and F. Dong, J. Mater. Chem. A, 2021, 9, 20184–20210 RSC.
- H. Ren, P. Koshy, W.-F. Chen, S. Qi and C. C. Sorrell, J. Hazard. Mater., 2017, 325, 340–366 CrossRef CAS PubMed.
- C. Gao, J. Low, R. Long, T. Kong, J. Zhu and Y. Xiong, Chem. Rev., 2020, 120, 12175–12216 CrossRef CAS PubMed.
- F. Zhang, Y. Zhu, Q. Lin, L. Zhang, X. Zhang and H. Wang, Energy Environ. Sci., 2021, 14, 2954–3009 RSC.
- S. K. Kaiser, Z. Chen, D. Faust Akl, S. Mitchell and J. Pérez-Ramírez, Chem. Rev., 2020, 120, 11703–11809 CrossRef CAS.
- Y. Zhao, W. J. Jiang, J. Zhang, E. C. Lovell, R. Amal, Z. Han and X. Lu, Adv. Mater., 2021, 2102801 CrossRef CAS PubMed.
- K. Qi, M. Chhowalla and D. Voiry, Mater. Today, 2020, 40, 173–192 CrossRef CAS.
- L. Wang, W. Chen, D. Zhang, Y. Du, R. Amal, S. Qiao, J. Wu and Z. Yin, Chem. Soc. Rev., 2019, 48, 5310–5349 RSC.
- S. Ding, H.-A. Chen, O. Mekasuwandumrong, M. J. Hülsey, X. Fu, Q. He, J. Panpranot, C.-M. Yang and N. Yan, Appl. Catal., B, 2021, 281, 119471 CrossRef CAS.
- J. Wan, W. Chen, C. Jia, L. Zheng, J. Dong, X. Zheng, Y. Wang, W. Yan, C. Chen and Q. Peng, Adv. Mater., 2018, 30, 1705369 CrossRef PubMed.
- X. Hu, J. Song, J. Luo, H. Zhang, Z. Sun, C. Li, S. Zheng and Q. Liu, J. Energy Chem., 2021, 62, 1–10 CrossRef.
- X. Wu, H. Zhang, S. Zuo, J. Dong, Y. Li, J. Zhang and Y. Han, Nano-Micro Lett., 2021, 13, 1–28 CrossRef.
- S. Bai, N. Zhang, C. Gao and Y. Xiong, Nano Energy, 2018, 53, 296–336 CrossRef CAS.
- X. Wang, M. Sun, M. Murugananthan, Y. Zhang and L. Zhang, Appl. Catal., B, 2020, 260, 118205 CrossRef CAS.
- M. Sun, X. Wang, Z. Chen, M. Murugananthan, Y. Chen and Y. Zhang, Appl. Catal., B, 2020, 273, 119061 CrossRef CAS.
- H. Zhou, X. Zou and Y. Zhang, Electrochim. Acta, 2016, 192, 259–267 CrossRef CAS.
- J. Zhang, J. Liu, L. Xi, Y. Yu, N. Chen, S. Sun, W. Wang, K. M. Lange and B. Zhang, J. Am. Chem. Soc., 2018, 140, 3876–3879 CrossRef CAS.
- J. P. Desclaux, At. Data Nucl. Data Tables, 1973, 12, 311–406 CrossRef CAS.
- J. Cai, X. Wu, S. Li and F. Zheng, ACS Sustainable Chem. Eng., 2016, 4, 1581–1590 CrossRef CAS.
- H. Zhang, S. Zuo, M. Qiu, S. Wang, Y. Zhang, J. Zhang and X. Lou, Sci. Adv., 2020, 6, eabb9823 CrossRef CAS PubMed.
- S. Wang, L. Pan, J.-J. Song, W. Mi, J.-J. Zou, L. Wang and X. Zhang, J. Am. Chem. Soc., 2015, 137, 2975–2983 CrossRef CAS.
- Y. Zhang, L. Guo, L. Tao, Y. Lu and S. Wang, Small Methods, 2019, 3, 1800406 CrossRef.
- H. Zhou and Y. Zhang, J. Phys. Chem. C, 2014, 118, 5626–5636 CrossRef CAS.
- K. Li, S. Gao, Q. Wang, H. Xu, Z. Wang, B. Huang, Y. Dai and J. Lu, ACS Appl. Mater. Interfaces, 2015, 7, 9023–9030 CrossRef CAS.
- G. Wang, Y. Ling, H. Wang, X. Yang, C. Wang, J. Z. Zhang and Y. Li, Energy Environ. Sci., 2012, 5, 6180–6187 RSC.
- J.-J. Li, B. Weng, S.-C. Cai, J. Chen, H.-P. Jia and Y.-J. Xu, J. Hazard. Mater., 2018, 342, 661–669 CrossRef CAS.
- G. Liu, J. Han, X. Zhou, L. Huang, F. Zhang, X. Wang, C. Ding, X. Zheng, H. Han and C. Li, J. Catal., 2013, 307, 148–152 CrossRef CAS.
- T. Pauporté, Y. Soldo-Olivier and R. Faure, J. Phys. Chem. B, 2003, 107, 8861–8867 CrossRef.
- T. Hsiung, H. Wang and H. Lin, J. Phys. Chem. Solids, 2008, 69, 383–385 CrossRef CAS.
- A. Makdee, K. C. Chanapattharapol, P. Kidkhunthod, Y. Poo-arporn and T. Ohno, RSC Adv., 2020, 10, 26952–26971 RSC.
- G. Song, W. Gong, S. Cong and Z. Zhao, Angew. Chem., Int. Ed., 2021, 60, 5505–5511 CrossRef CAS.
- A. Agrawal, S. H. Cho, O. Zandi, S. Ghosh, R. W. Johns and D. J. Milliron, Chem. Rev., 2018, 118, 3121–3207 CrossRef CAS.
- A. Ziashahabi and T. Ghodselahi, J. Phys. Chem. Solids, 2013, 74, 929–933 CrossRef CAS.
- X. Chen, L. Liu and F. Huang, Chem. Soc. Rev., 2015, 44, 1861–1885 RSC.
- G. Xu, H. Zhang, J. Wei, H.-X. Zhang, X. Wu, Y. Li, C. Li, J. Zhang and J. Ye, ACS Nano, 2018, 12, 5333–5340 CrossRef CAS PubMed.
- X. Fang, Q. Shang, Y. Wang, L. Jiao, T. Yao, Y. Li, Q. Zhang, Y. Luo and H. L. Jiang, Adv. Mater., 2018, 30, 1705112 CrossRef PubMed.
- L. Shi, T. Wang, H. Zhang, K. Chang, X. Meng, H. Liu and J. Ye, Adv. Sci., 2015, 2, 1500006 CrossRef PubMed.
- H. Zhang, P. Zhang, M. Qiu, J. Dong, Y. Zhang and X. Lou, Adv. Mater., 2019, 31, 1804883 Search PubMed.
- Z. Yin, B. Liu, S. Fan, P. Wang, X. Wang, D. Long, L. Zhang, X. Yang and X. Li, Catal. Commun., 2019, 130, 105754 CrossRef CAS.
- A. Mahmood, X. Wang, X. Xie and J. Sun, J. Environ. Chem. Eng., 2021, 9, 105069 CrossRef CAS.
- X. Zou, Y. Dong, X. Zhang and Y. Cui, Appl. Surf. Sci., 2016, 366, 173–180 CrossRef CAS.
- K. Zhang, L. Dai, Y. Liu, J. Deng, L. Jing, K. Zhang, Z. Hou, X. Zhang, J. Wang and Y. Feng, Appl. Catal., B, 2020, 279, 119372 CrossRef CAS.
- C. T. Nguyen, N. Q. Tran, S. Seo, H. Hwang, S. Oh, J. Yu, J. Lee, T. A. Le, J. Hwang and M. Kim, Mater. Today, 2020, 35, 25–33 CrossRef CAS.
- Y. H. Kim, S. Y. Lee, H. N. Umh, H. D. Song, J. W. Han, J. W. Choi and J. Yi, ACS Appl. Mater. Interfaces, 2020, 12, 15239–15245 CrossRef CAS.
- F. He, A. Meng, B. Cheng, W. Ho and J. Yu, Chin. J. Catal., 2020, 41, 9–20 CrossRef CAS.
- H. Gao, P. Zhang, J. Zhao, Y. Zhang, J. Hu and G. Shao, Appl. Catal., B, 2017, 210, 297–305 CrossRef CAS.
- S. Meng, W. Sun, S. Zhang, X. Zheng, X. Fu and S. Chen, J. Phys. Chem. C, 2018, 122, 26326–263362 CrossRef CAS.
Footnote |
| † Electronic supplementary information (ESI) available. See DOI: 10.1039/d1ta08143h |
| This journal is © The Royal Society of Chemistry 2022 |

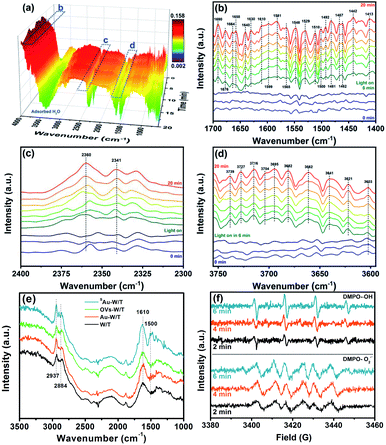
![[thin space (1/6-em)]](https://www.rsc.org/images/entities/char_2009.gif) min. (f) Steady-state FTIR spectra of the different samples in toluene vapor. (e) EPR spectra of DMPO-˙OH and DMPO-O2˙−. ODMPO-O2˙− was determined in a methanolic solution.
min. (f) Steady-state FTIR spectra of the different samples in toluene vapor. (e) EPR spectra of DMPO-˙OH and DMPO-O2˙−. ODMPO-O2˙− was determined in a methanolic solution.