Organic melt, electride, and CVD induced in situ deposition of luminescent lanthanide imidazolate MOFs on nanostructured alumina†
Larissa Valerie
Meyer
a,
Joachim
Vogt
a,
Helmut
Schäfer
b,
Martin
Steinhart
b,
Rolf
Böttcher
c,
Andreas
Pöppl
c,
Marit
Mai
d,
Claus
Feldmann
d and
Klaus
Müller-Buschbaum
*a
aInstitut für Anorganische Chemie, Universität Würzburg, Am Hubland, 97074 Würzburg, Germany. E-mail: k.mueller-buschbaum@uni-wuerzburg.de; Fax: (+49) 931-31-8478; Tel: (+49) 93-31-88724
bInstitut für Chemie neuer Materialien, Universität Osnabrück, Barbarastraße 7, 49069 Osnabrück, Germany. E-mail: martin.steinhart@uni-osnabrück.de; Fax: (+49) 541-969-2817; Tel: (+49) 541-969-3324
cFakultät für Physik und Geowissenschaften, Universität Leipzig, Linnéstr. 5, 04103 Leipzig, Germany. E-mail: poeppl@physik.uni-leipzig.de; Fax: (+49)341 97-32649; Tel: (+49)341 97-32608
dInstitute of Inorganic Chemistry, Karlsruhe Institute of Technology (KIT), Engesserstr. 15, 76131 Karlsruhe, Germany. E-mail: claus.feldmann@kit.edu; Fax: (+49) 721 608-47021; Tel: (+49) 721 608-42855
First published on 22nd December 2014
Abstract
The highly luminescent MOFs 3∞[Ce(Im)3ImH]·ImH, 3∞[Tb(Im)3], and the dense framework 3∞[Sr0.95Eu0.05(Im)2] (Im− = imidazolate-anion, C3N2H3−) were grown on nanostructured macroporous aluminium oxide (AAO) membranes. Thereby, luminescent coatings on the membranes were achieved. Three different growth processes unusual for MOFs were investigated and compared: a film growth process in situ to MOF formation from the linker melt, electride induction with solvated electrons, and chemical vapour deposition (CVD) to additionally utilize the gas phase. Deposition from the organic melt has proved to be a fast approach to achieve various film thicknesses of the luminescent frameworks. The electride-based approach offers excellent homogenization at an atomic level for the highest quantum yields of QY > 90% for 3∞[Sr0.95Eu0.05(Im)2] including the formation of barite rose analogous crystals prior to growth of a complete film on AAO membranes. For 3∞[Tb(Im)3] and 3∞[Ce(Im)3ImH]·ImH, deposition of bundles of crystals by CVD on AAO is possible while also maintaining the luminescence of the original MOFs but without complete layers. In order to elaborate the divalent character of europium, being the basis of the high efficiency of the luminescence, EPR studies were carried out on 3∞[Sr1−xEux(Im)2], x = 0.01, 0.05 and 1.
Introduction
Metal organic frameworks (MOFs) exhibit a large variety of properties or even a combination of them, which have given inspiration in the field of materials science for almost 25 years.1–8 By variation of the linker molecules, metal centres, and template molecules, MOFs allow the modification as compared e.g. to zeolites. The use of lanthanides as metal centres leads to hybrid materials with intense photoluminescence properties,9–12 and thin luminescent films of MOFs and COPs13 (coordination polymers) can also be generated. The development and processing of MOF films is a recent and rapidly growing research area,14–16 as these films are of interest for sensing and membrane technologies.17–21 Both established and newly developed coating techniques are investigated: inspired by the generation of coordination polymers and zeolitic films, seeded-growth, Langmuir–Blodgett and liquid phase epitaxy as well as layer-by-layer methods were applied with great success.22–24 The main approach to form MOF films is deposition from liquid phases like solutions, whereas CVD and PVD are exceptions due to the intrinsic low vapor pressure and limited thermal stability of the frameworks.14–16,23,24 Almost all individual frameworks exhibit different chemical behavior as well as stability and therefore an individual film growth is necessary. Due to the lack of common applicability the controlled SBU (secondary building unit) approach (CSA) is a recent effort towards generalisation.25 A multitude of substrates such as metals, metal oxides, and graphite have already been successfully used to grow MOFs and coordination polymers upon them.26–28 We recently demonstrated that anodic aluminium oxide (AAO) as a patterned surface can be used to generate thin luminescent films of luminescent dense frameworks.13 Luminescent thin MOF-films represents a new topic that combines the photoluminescence of a MOF with a structured surface that can potentially increase the energy efficiency of the luminescent framework.29 This is useful for potential applications in lighting techniques as well as for sensing.Recently, we have shown that in situ framework/film formation from an imidazole melt and elemental metals like strontium and europium yields thin and highly luminescent MOF films of 3∞[Sr0.95Eu0.05(Im)2] on macroporous, self-ordered AAO.13
Herein, we elaborate the in situ coating approach from the linker melt for the luminescent MOFs 3∞[Ce(Im)3ImH]·ImH and 3∞[Tb(Im)3] maintaining the MOF luminescence. We provide insights into homogenization of Sr and Eu at an atomic level by an electride approach in liquid ammonia to increase the luminescence efficiency, and elaborate the paramagnetic properties of the bulk material by EPR spectroscopy. Finally, we show options on the deposition of 3∞[Ce(Im)3ImH]·ImH and 3∞[Tb(Im)3] by CVD from the gas phase on AAO.
Results and discussion
In situ deposition of 3∞[Ce(Im)3ImH]·ImH (1), 3∞[Tb(Im)3] (2) and 3∞[Sr0.95Eu0.05(Im)2] (3) on AAO membranes from an imidazole melt and by CVD
The starting point for in situ coating investigations of nanostructured macroporous anodic aluminium oxide (AAO)‡ with the luminescent MOFs 3∞[Ce(Im)3ImH]·ImH30 (1) and 3∞[Tb(Im)3]31 (2) was the initial growth of 3∞[Sr0.95Eu0.05Im2] (3) on AAO substrates from an imidazole melt according to ref. 13 in an approach that combines the framework and film formation. Both MOFs the cerium imidazolate 1 and the terbium imidazolate 2 can be synthesized from the metals and a melt of imidazole, which renders coating with them accessible through this procedure, in which the organic melt is in contact with the AAO substrate during framework formation. The MOFs are microporous, with 1 showing a preferred uptake of CO2 of 160 cm3 g−1 and a moderate surface area of SBET = 480 m2 g−1 at −75° C,30 and 2 preferring adsorption of NH3 (92 cm3 g−1 = 4.5 mass%) at 4.5 bar NH3 and room temperature (see Fig. S1, ESI†).More intriguing, the MOFs show interesting luminescence behaviour upon excitation with UV-light. 3∞[Ce(Im)3ImH]·ImH30 (1) is a blue emitting MOF with prominent, parity allowed and therefore strong 5d→4f emission of Ce3+, whereas 3∞[Tb(Im)3]31 (2) shows the typical green emission of 4f–4f transitions of Tb3+ fed by a strong antenna effect of imidazole, which functions as a sensitizer for Tb3+ circumventing the low light uptake due to the parity forbidden character of intra-4f transitions.
AAO consists of arrays of aligned cylindrical macropores with narrow diameter distribution and uniform macropore depth, which are characterized by local (“polycrystalline”) hexagonal ordering.32,33 Topographically patterned AAO substrates with defined macropore size as well as geometry were chosen to check the possible structuring effects of the MOF films. In order to further develop and promote the concept of the in situ coating from an organic melt, the lanthanide-based frameworks 1 and 2 were chosen to generate thin luminescent films on self-ordered AAO substrates while retaining their original bulk properties like crystal structure and photoluminescence. As shown for the deposition of 3∞[Sr0.95Eu0.05Im2] films on AAO membranes, the pore walls exhibit a suitable number of coordination sites – mostly OH – for the highly oxophilic terbium and cerium ions and thus the corresponding MOFs 3∞[Tb(Im)3] and 3∞[Ce(Im)3ImH]·ImH. In order to utilize and investigate possible layer thicknesses and layer formation mechanisms, AAO membranes with a pore diameter ranging from 40 to 400 nm and a pore depth of 100 μm were investigated.
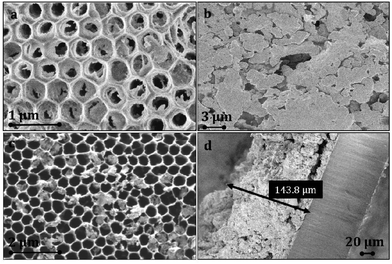
The use of the MOFs 3∞[Tb(Im)3] as well as 3∞[Ce(Im)3ImH]·ImH yields luminescent layers with variable thickness. The initial growth of 1 and 2 starts at the macroporous mouths of the substrate channels (Fig. 1a). As previously envisaged,13 the deposition of the MOFs depends on substrate parameters, such as the surface potential of the pore walls, the number of anchoring sites, and the size of the substrate apertures. In addition, MOF parameters like the crystal cell extensions, surface groups, etc. will also influence the growth on the substrate.
Structured thin films can be grown on substrates with large nanostructuring and apertures of 300 and 400 nm in diameter, which are subsequently forming closed layers upon further growth, whereas small apertures of 40 to 100 nm directly give closed films that show some crystal displacement if grown to thick films on the micrometer scale (for both, see Fig. 1 and Scheme 1).
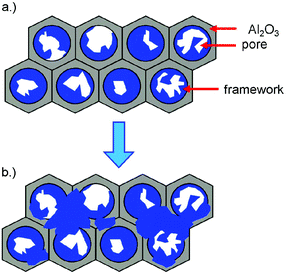 | ||
| Scheme 1 (a) Initial growth of 3∞[Ce(Im)3ImH]·ImH (1) at the pore walls inside the channels during the melt approach; (b) subsequent overgrowth of the AAO pore mouths with the MOF. | ||
In order to elaborate the possibility of a CVD deposition of both MOFs from the melt approach a setup was built that prevented direct contact between the melt and the AAO substrate (see Fig. 2). SEM investigations show that isolated crystalline particles are grown on the AAO surface without formation of films (Fig. S9–S11, ESI†). The size of the MOF crystals grown by CVD ranges from 1 to 3 μm for 3∞[Ce(Im)3ImH]·ImH (Fig. S9, ESI†) and 1–20 μm for 3∞[Tb(Im)3] (see Fig. S11, ESI†).
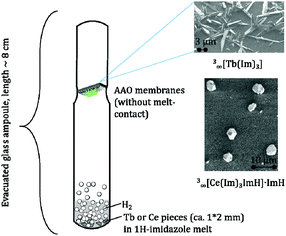 | ||
| Fig. 2 Experimental setup (left) for the CVD deposition of 3∞[Tb(Im)3] (top) and 3∞[Ce(Im)3ImH]·ImH (bottom) on AAO. | ||
EDX element mapping analysis was carried out to prove the composition of the crystalline depositions and show that all elements of the original frameworks 3∞[Tb(Im)3] as well as 3∞[Ce(Im)3ImH]·ImH were present (Fig. 3 and S12†). In order to check that the films retained their bulk properties, powder diffraction and photoluminescence investigations were also carried out on the coated AAO substrates. Comparison of the CVD deposition with the films generated by melt contact shows the chemical identity of both depositions.
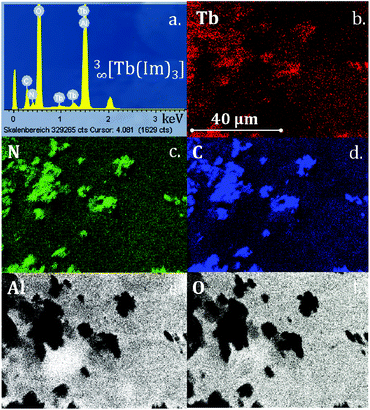 | ||
| Fig. 3 (a) EDX spectrum of CVD-deposited crystals of 3∞[Tb(Im)3] (2) on AAO; (b–f) EDX element mappings for Tb, N, C, Al and O. | ||
The diffraction patterns of the AAO substrates coated with 3∞[Ce(Im)3ImH]·ImH as well as with 3∞[Tb(Im)3] and the corresponding bulk material show identical reflections (see Fig. S3 and S4, ESI†). The powder patterns also match with single crystal X-ray data.30,31 It can be concluded that the coating of AAO substrates was successful and that deposition is possible by both, the in situ melt approach and CVD. However, only the contact between the melt and the substrate can be used to generate films.
The photoluminescence spectra of AAO substrates coated with 1 as well as of the bulk material are shown in Fig. 4 (top). SEM investigations show that the deposition of 3∞[Ce(Im)3ImH]·ImH (1) on AAO substrates leads to a lower amount of deposited material compared to 2 providing the same deposition parameters and therefore thinner layers in the in situ melt approach. As the low amount of deposited substance complicates analytics that require a certain amount of material like X-ray powder diffraction, a long time X-ray investigation was applied to generate suitable X-ray data. It proves that growth maintains the crystal structure (see Fig. S4, ESI†). Photoluminescence spectroscopy was also utilized as further proof of the successful coating of the AAO substrates with 3∞[Ce(Im)3ImH]·ImH.
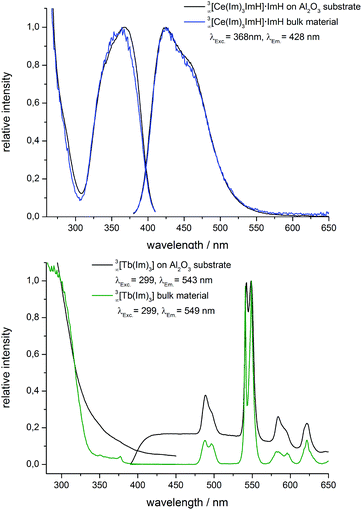 | ||
| Fig. 4 Excitation (left) and emission spectra (right) of AAO membranes coated with 3∞[Ce(Im)3ImH]·ImH (top), 3∞[Tb(Im)3] (bottom), and the corresponding bulk material. | ||
The luminescence of Ce3+ originates from parity allowed 4f–5d transitions for excitation and vice versa 5d–4f transitions for emission. The 5d–4f transitions with energy gaps <33![[thin space (1/6-em)]](https://www.rsc.org/images/entities/char_2009.gif) 000 cm−1 by crystal and ligand field splitting are an exception observed for Eu2+ and Ce3+.34 Due to the participation of d-states they are directly influenced by chemical surroundings of the Ce3+ ions. This prominent feature is demonstrated by the Y3Al5O12
000 cm−1 by crystal and ligand field splitting are an exception observed for Eu2+ and Ce3+.34 Due to the participation of d-states they are directly influenced by chemical surroundings of the Ce3+ ions. This prominent feature is demonstrated by the Y3Al5O12![[thin space (1/6-em)]](https://www.rsc.org/images/entities/char_2009.gif) :
:![[thin space (1/6-em)]](https://www.rsc.org/images/entities/char_2009.gif) Ce3+ laser (YAG
Ce3+ laser (YAG![[thin space (1/6-em)]](https://www.rsc.org/images/entities/char_2009.gif) :
:![[thin space (1/6-em)]](https://www.rsc.org/images/entities/char_2009.gif) Ce), which emits in the yellow region.35 As shown for Eu2+ above and ref. 13 this type of luminescence can be used as a fingerprint for the chemical surroundings. Almost identical excitation and emission spectra can be observed for the 3∞[Ce(Im)3ImH]·ImH coated AAO substrate and the bulk material, with no remarkable shift in excitation and emission as well as no modification of band half-width observed. It is therefore concluded that the coating of AAO membranes with 3∞[Ce(Im)3ImH]·ImH was successful.
Ce), which emits in the yellow region.35 As shown for Eu2+ above and ref. 13 this type of luminescence can be used as a fingerprint for the chemical surroundings. Almost identical excitation and emission spectra can be observed for the 3∞[Ce(Im)3ImH]·ImH coated AAO substrate and the bulk material, with no remarkable shift in excitation and emission as well as no modification of band half-width observed. It is therefore concluded that the coating of AAO membranes with 3∞[Ce(Im)3ImH]·ImH was successful.
For the MOF 3∞[Tb(Im)3] (2), the coated substrates as well as the bulk materials exhibit the previously described broadband excitation spectra based on the linking imidazolate anion.31 The observed emission spectra for coated substrates as well as for the bulk material exhibit sharp 4f–4f-transitions typical for the Tb3+ transitions between the excited 5D4 state and the 7F6−0 levels of Tb3+ ground states (Fig. 4, bottom). The quantum yield of 2 was also determined in this study with QY = 23% (investigated vs. BAM![[thin space (1/6-em)]](https://www.rsc.org/images/entities/char_2009.gif) :
:![[thin space (1/6-em)]](https://www.rsc.org/images/entities/char_2009.gif) Eu2+ as the standard).
Eu2+ as the standard).
Alike MOF 1, the photoluminescence properties of deposited 2 match with the bulk properties. This is also in accordance with the results of X-ray powder diffraction, which also proves the identity of bulk and deposited framework 2. 3∞[Tb(Im)3] was thereby successfully grown on AAO substrates retaining both crystal structure and material properties.
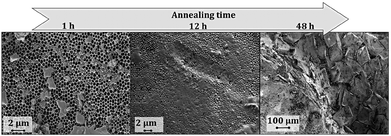
In order to also investigate time-dependent changes of grown layers by the in situ coating process, 3∞[Sr0.95Eu0.05(Im)2] (3) films were grown on 400/100-AAO membranes (pore diameter: 400 nm, pore depth: 100 μm) according to ref. 13 with three different annealing times for the imidazole melt contact (1, 12 and 48 hours). After the annealing, film growth was stopped. It can be considered that a longer annealing time results in formation of thicker layers. However, the time dependence has not previously been elaborated. SEM investigations show that the initial growth on the pore mouths and inside the pore apertures can be assigned to an annealing for a short time like 1 h. 12 h annealing leads to a thin continuous layer of 3, and longer annealing times lead to further growth of crystalline layers of several micrometers (Fig. 5). Accordingly, we can now point out that annealing and melt contact for about one hour can be used to gain the initial growth stage; 12–15 hours annealing gives continuous thin films on the nanometer scale, whereas longer growth is not useful to achieve a thin film but gives further crystalline growth.
In order to check if bulk properties are maintained, powder diffraction and photoluminescence investigations were carried out on 3∞[Sr0.95Eu0.05(Im)2] coated AAO substrates (see Fig. 6 and S5, ESI†). Comparison of powder patterns of the bulk material with the coated AAO membrane points out that all reflections of 3∞[Sr0.95Eu0.05(Im)2] can be found with different intensity ratios without a preferred crystal orientation (see S2, ESI†).
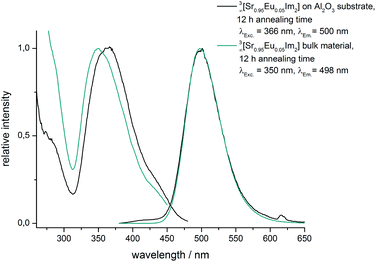 | ||
| Fig. 6 Excitation and emission spectra of 3∞[Sr0.95Eu0.05(Im)2] coated 400/100-AAO membranes and the bulk material after an annealing time of 12 hours, respectively. | ||
As observed for the luminescent MOFs, 3∞[Ce(Im)3ImH]·ImH30 (1) and 3∞[Tb(Im)3]31 (2) films of 3 retain the original framework luminescence. A broadband excitation which ranges from λ = 250–460 nm is the basis of the intense photoluminescence of the framework 3∞[Sr0.95Eu0.05(Im)2] and is caused by excitation of both the ligand 1H-imidazole and europium(II). The resulting emission exhibits an exceptionally high quantum yield for MOFs, previously reported with 80%.36
Broadband emission is typical for divalent europium and is based on transitions between 5d and the 4f8S7/2 energy levels. This luminescence can be utilized as a fingerprint for the chemical surrounding due to the participation of the 5d energy levels. Comparison between the excitation and the emission spectra of 3∞[Sr0.95Eu0.05(Im)2] films on AAO substrates and the spectra of the corresponding bulk material shows almost identity except for a slight shift of the excitation band. Emission maxima, profiles and half-width are identical (Fig. 6 and Fig. S5, ESI†). Both analytical methods demonstrate that the dense framework 3∞[Sr0.95Eu0.05(Im)2] has been successfully grown on 400/100-AAO substrates maintaining the crystal structure as well as its photoluminescence properties.
In situ deposition of 3∞[Sr0.95Eu0.05(Im)2] (3) on AAO membranes by electride induction from liquid NH3
We have recently shown that thin films of the dense framework series 3∞[Sr1−xEux(Im)2] (x = 0–1, Im− = imidazolate anion) can be achieved by the new in situ coating approach from organic melts on nanostructured macroporous AAO‡ substrates.13 Thereby, a one-pot-synthesis of non-noble alkaline earth and lanthanide metals with 1H-imidazole and AAO substrates (pore diameter of 40–400 nm, pore depth 100 μm) was utilized. The nanostructured AAO32,33 substrates were chosen to check for possible structuring effects of the MOF films. Additionally, an electride induced in situ growth was shown once again from liquid ammonia exhibiting a different growth behaviour from the melt approach that excluded the 400 nm wide channels from growth without explanation.13 We have now elaborated the initial growth process of the electride induced procedure and can now explain this behaviour.The synthesis of the dense co-doped framework 3∞[Sr0.95Eu0.05(Im)2] was carried out in liquid ammonia according to ref. 36. The ratio of strontium/europium of 95![[thin space (1/6-em)]](https://www.rsc.org/images/entities/char_2009.gif) :
:![[thin space (1/6-em)]](https://www.rsc.org/images/entities/char_2009.gif) 5 was chosen because it is known to give the highest quantum yield of >80%, which is an exception among coordination polymers.36 The use of liquid ammonia aims at mixing of the metals strontium and europium at the atomic level, as both can be dissolved in liquid ammonia.37–40 Electride induced in situ coating approaches with the dense framework 3∞[Sr0.95Eu0.05(Im)2] (3) and 400/100-AAO membranes (pore diameter: 400 nm, pore depth: 100 μm) have been repeatedly carried out followed by SEM investigations on the obtained products. Initial growth of the dense framework 3 on AAO is accompanied by extraordinarily shaped crystallites that look like barite roses in shape (see Fig. 7).
5 was chosen because it is known to give the highest quantum yield of >80%, which is an exception among coordination polymers.36 The use of liquid ammonia aims at mixing of the metals strontium and europium at the atomic level, as both can be dissolved in liquid ammonia.37–40 Electride induced in situ coating approaches with the dense framework 3∞[Sr0.95Eu0.05(Im)2] (3) and 400/100-AAO membranes (pore diameter: 400 nm, pore depth: 100 μm) have been repeatedly carried out followed by SEM investigations on the obtained products. Initial growth of the dense framework 3 on AAO is accompanied by extraordinarily shaped crystallites that look like barite roses in shape (see Fig. 7).
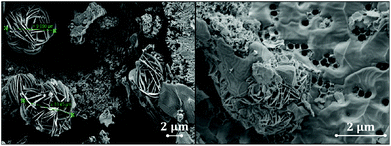 | ||
| Fig. 7 Barite rose analogous crystals of 3∞[Sr0.95Eu0.05(Im)2] (3, left) and the growth of a continuous layer by the electride coating approach (right). | ||
This remarkable crystal shape can only be found on the AAO surface and is never observed in the bulk material. Natural occurrences of these bizarre crystals are known as barite roses (desert roses, sand roses) that can be found in deserts (North America, North Africa, and Mexico), or generally in regions with arid climate conditions.41 The formation of sand roses is the result of a very rapid evaporation of surface water which requires the promotion of groundwater via capillary forces. Salts dissolved in the water crystallise and interact with the grains of sand forming the characteristic foliaceous structures.41 It is therefore likely that in the electride induced system used here, the formation of the barite analogous crystals can be occurring because of a rapid evaporation of liquid ammonia during the in situ coating process. Initial crystallisation processes of the framework on the channel wall intersections of the AAO membranes together with the fast evaporation of liquid ammonia can thereby cause formation of our barite rose analogous crystals (see Scheme 2).
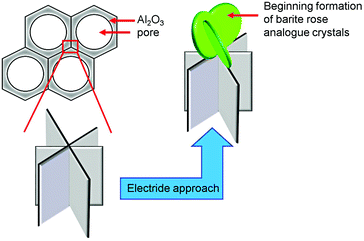 | ||
| Scheme 2 Initial growth of the barite rose analogous crystals of 3∞[Sr0.95Eu0.05(Im)2] at the intersection of the channel walls of the AAO substrates. | ||
SEM investigations allow the conclusion that the formation of the barite rose analogues of 3∞[Sr0.95Eu0.05(Im)2] is the growth following seeding (Fig. 7). Formation of a continuous layer of 3 consumes the barite rose analogues, which cannot be seen thereafter anymore. The concave macropore walls of the macropore apertures act as anchoring sites for the metal ions of 3 giving the barite roses from a low number of crystalline seeds, whereas the growth of the MOF resulting from the melt approach extracts into the apertures of AAO (see Fig. S6, ESI†).
EDX element mapping analyses were also carried out and show that all elements of the original framework 3 can be found (Fig. 8). In a previous report13 we identified a difference in the ratio of Sr![[thin space (1/6-em)]](https://www.rsc.org/images/entities/char_2009.gif) :
:![[thin space (1/6-em)]](https://www.rsc.org/images/entities/char_2009.gif) Eu between bulk and deposited layers from the imidazole melt, on the one hand, and a deposited layer, if an electride is used, on the other hand, without being able to offer an explanation. We can now explain this difference, as point-ID measurements of the barite rose analogous crystals indicate exactly this difference. The ratio of strontium/europium is lower than the original ratio of the reactant metals, with the barite rose analogous crystals exhibiting a higher europium content than the original ratio of strontium/europium (see Fig. S7 and S8, Table 1, ESI†). Accordingly, the formation of the barite roses is the source for the change in the metal ratio. This can originate from different crystallization conditions that favour europium in the formation of this extraordinary crystal shape.
Eu between bulk and deposited layers from the imidazole melt, on the one hand, and a deposited layer, if an electride is used, on the other hand, without being able to offer an explanation. We can now explain this difference, as point-ID measurements of the barite rose analogous crystals indicate exactly this difference. The ratio of strontium/europium is lower than the original ratio of the reactant metals, with the barite rose analogous crystals exhibiting a higher europium content than the original ratio of strontium/europium (see Fig. S7 and S8, Table 1, ESI†). Accordingly, the formation of the barite roses is the source for the change in the metal ratio. This can originate from different crystallization conditions that favour europium in the formation of this extraordinary crystal shape.
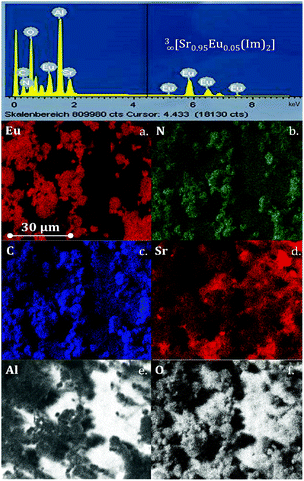 | ||
| Fig. 8 EDX spectrum of barite rose analogous crystals of 3∞[Sr0.95Eu0.05(Im)2] (3) deposited on AAO substrates (top); (a–f) EDX element mappings for Eu, N, C, Sr, Al and O. | ||
Additional photoluminescence studies and EPR spectroscopy of 3∞[Sr0.95Eu0.05(Im)2] (3)
The electride induced approach to mix the dissolved metals at an atomic level can have beneficial effects on the luminescence properties as it can avoid clustering of luminescence centers and thereby reduce quenching by concentration. This effect was successfully shown for a hydride based synthesis of the yellow emitting barium imidazolate co-doped with EuII,42 which exceeds the mixing of metal particles, but is still beyond the atomic level. We now went one step further to dissolution in liquid ammonia and thereby re-investigated the efficiency of the luminescence process accompanied by this ideal mixing. It is intriguing that the efficiency is indeed increased. For a content of 95% strontium and 5% europium, the quantum yield (determined vs. BAM![[thin space (1/6-em)]](https://www.rsc.org/images/entities/char_2009.gif) :
:![[thin space (1/6-em)]](https://www.rsc.org/images/entities/char_2009.gif) Eu2+ as the standard and absolutely) was previously determined as QY = 78% (absolute) to 83% (relative QY).36 For an isoconstitutional framework from the electride approach with the same Sr
Eu2+ as the standard and absolutely) was previously determined as QY = 78% (absolute) to 83% (relative QY).36 For an isoconstitutional framework from the electride approach with the same Sr![[thin space (1/6-em)]](https://www.rsc.org/images/entities/char_2009.gif) :
:![[thin space (1/6-em)]](https://www.rsc.org/images/entities/char_2009.gif) Eu ratio of 95
Eu ratio of 95![[thin space (1/6-em)]](https://www.rsc.org/images/entities/char_2009.gif) :
:![[thin space (1/6-em)]](https://www.rsc.org/images/entities/char_2009.gif) 5, determination of the quantum yield gives an increase up to QY = 90% (absolute) to 92% (relative QY) at an absorption of 0.7, which marks this co-doped dense framework 3 as one of the most efficient luminescent coordination polymers today, the rise in efficiency being combined with an efficient distribution of the luminescence centers. As this efficiency is combined with the parity allowed photoluminescence of EuII, which is less stable than EuIII, we also wanted to prove the divalence of europium. Moreover, a non-luminescent phase with additional coordinating imidazole molecules is known to be present in the system Eu/ImH. Due to the lack of luminescence, the presence of this compound, even as a minority phase, reduces the efficiency of the PL of a product from europium and imidazole and should be avoided.
5, determination of the quantum yield gives an increase up to QY = 90% (absolute) to 92% (relative QY) at an absorption of 0.7, which marks this co-doped dense framework 3 as one of the most efficient luminescent coordination polymers today, the rise in efficiency being combined with an efficient distribution of the luminescence centers. As this efficiency is combined with the parity allowed photoluminescence of EuII, which is less stable than EuIII, we also wanted to prove the divalence of europium. Moreover, a non-luminescent phase with additional coordinating imidazole molecules is known to be present in the system Eu/ImH. Due to the lack of luminescence, the presence of this compound, even as a minority phase, reduces the efficiency of the PL of a product from europium and imidazole and should be avoided.
We therefore employed electron paramagnetic resonance (EPR) spectroscopy to investigate the incorporation of paramagnetic S-state EuII ions with a total electron spin S = 7/2 into 3∞[Sr1−xEux(Im)2]. We have investigated three samples with different ratios of Sr![[thin space (1/6-em)]](https://www.rsc.org/images/entities/char_2009.gif) :
:![[thin space (1/6-em)]](https://www.rsc.org/images/entities/char_2009.gif) Eu, x = 0.01, 0.05, and 1. Their room temperature Q-band EPR powder spectra are displayed in Fig. 9. (For further X-band and low temperature spectra see Fig. S13–S21, ESI.†) The spectrum of the sample with x = 0.01 having the lowest Eu concentration (Fig. 9a) exhibits the best spectral resolution with a number of well resolved lines. They are caused by the zero field splitting (zfs) of EuII in a distorted octahedral crystal field,43 which leads to line splitting of about 300–500 G and a considerable smaller splitting of about 40 G due to the hyperfine interaction (hfi) with the 151Eu and 152Eu nuclei both with a nuclear spin I = 5/2. Already at Sr
Eu, x = 0.01, 0.05, and 1. Their room temperature Q-band EPR powder spectra are displayed in Fig. 9. (For further X-band and low temperature spectra see Fig. S13–S21, ESI.†) The spectrum of the sample with x = 0.01 having the lowest Eu concentration (Fig. 9a) exhibits the best spectral resolution with a number of well resolved lines. They are caused by the zero field splitting (zfs) of EuII in a distorted octahedral crystal field,43 which leads to line splitting of about 300–500 G and a considerable smaller splitting of about 40 G due to the hyperfine interaction (hfi) with the 151Eu and 152Eu nuclei both with a nuclear spin I = 5/2. Already at Sr![[thin space (1/6-em)]](https://www.rsc.org/images/entities/char_2009.gif) :
:![[thin space (1/6-em)]](https://www.rsc.org/images/entities/char_2009.gif) Eu ratios of 95
Eu ratios of 95![[thin space (1/6-em)]](https://www.rsc.org/images/entities/char_2009.gif) :
:![[thin space (1/6-em)]](https://www.rsc.org/images/entities/char_2009.gif) 5 significant line broadening effects are observed in the EuII EPR spectra due to magnetic dipole–dipole interactions among the EuII ions (Fig. 9b) and consequently the 151Eu and 152Eu hfi cannot be resolved anymore. For the magnetically non-diluted sample with x = 1 even the EuII zfs is not observable anymore and the spectrum consists of a single symmetric line (Fig. 9c). It has an almost Lorentzian line shape which is indicative of the presence of substantial magnetic exchange interactions among the EuII ions in that sample. Spectral simulations of the EPR spectra of the samples with x = 0.01 and 0.05 reveal that only a single EuII species A exists in the x = 0.01 sample with orthorhombic symmetry (for details of the spectral simulation and spin Hamiltonian parameters see ESI†) in accordance with the distorted octahedral metal site in 3∞[Sr1−xEux(Im)2]. Otherwise in the case of the sample with x = 0.05 the simulations indicate a superposition of the spectrum of species A with an additional spectrum of a second minor EuII species B, again with orthorhombic symmetry. Both EuII species A and B differ mainly in their zfs parameters B02 (310 MHz for A versus 480 MHz for B) which become slightly smaller at low temperatures.
5 significant line broadening effects are observed in the EuII EPR spectra due to magnetic dipole–dipole interactions among the EuII ions (Fig. 9b) and consequently the 151Eu and 152Eu hfi cannot be resolved anymore. For the magnetically non-diluted sample with x = 1 even the EuII zfs is not observable anymore and the spectrum consists of a single symmetric line (Fig. 9c). It has an almost Lorentzian line shape which is indicative of the presence of substantial magnetic exchange interactions among the EuII ions in that sample. Spectral simulations of the EPR spectra of the samples with x = 0.01 and 0.05 reveal that only a single EuII species A exists in the x = 0.01 sample with orthorhombic symmetry (for details of the spectral simulation and spin Hamiltonian parameters see ESI†) in accordance with the distorted octahedral metal site in 3∞[Sr1−xEux(Im)2]. Otherwise in the case of the sample with x = 0.05 the simulations indicate a superposition of the spectrum of species A with an additional spectrum of a second minor EuII species B, again with orthorhombic symmetry. Both EuII species A and B differ mainly in their zfs parameters B02 (310 MHz for A versus 480 MHz for B) which become slightly smaller at low temperatures.
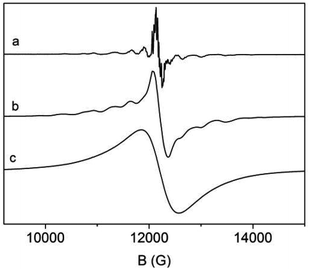 | ||
| Fig. 9 EuII Q-band EPR spectra of 3∞[Sr1−xEux(Im)2] with (a) x = 0.01, (b) x = 0.05, and (c) x = 1, recorded at T = 300 K. | ||
In order to elucidate the nature of the new species B observed at higher Eu content in 3∞[Sr1−xEux(Im)2] we further investigated a 2∞[Sr0.95Eu0.05(Im)2(ImH)2] sample that might correspond to a low temperature impurity phase of the 3∞[Sr1−xEux(Im)2] high temperature phase. However, neither species B nor species A are detected in the EPR spectrum of 2∞[Sr0.95Eu0.05(Im)2(ImH)2], which display rather the existence of a third EuII species C (see ESI†). Therefore, we can rule out a contamination of 3∞[Sr1−xEux(Im)2] by a small amount of the low temperature phase 2∞[Sr0.95Eu0.05(Im)2(ImH)2]. Furthermore, the EPR spectra of 3∞[Sr1−xEux(Im)2] with x = 0.01 and 0.05 do not give any indication of the formation of EuII pairs.
Conclusions
To summarize, we were able to show that the creation of luminescent MOF films on self-ordered AAO substrates can be achieved by the concept of an in situ coating approach from an organic melt and metal reagents. The concept covers several luminescent lanthanide imidazolate MOFs, as shown for the two highly luminescent MOFs 3∞[Ce(Im)3ImH]·ImH and 3∞[Tb(Im)3]. In both cases, thin as well as thick luminescent films, retaining of the original crystal structures and bulk properties was achieved. The concept can be further widened to additional deposition techniques: deposition of the same MOFs on AAO was successfully combined with CVD deposition of highly luminescent crystalline MOF particles. SEM/EDX investigations support these findings and confirm that the concave walls of the macropores at the macropore apertures act as anchoring sites, where the MOF growth starts.Finally, the use of electride induced coating from liquid ammonia was elaborated based on the formation of thin films of 3∞[Sr0.95Eu0.05(Im)2] regarding the initial growth phase. Independent from the melt contact, the initial formation of extraordinary barite rose analogous crystals was identified for this in situ coating process prior to the formation of highly luminescent thin films of 3∞[Sr0.95Eu0.05(Im)2] on AAO membranes. Time-dependent formation of the films and the control of layer thickness were also shown. Furthermore, the electride approach offers an improved homogenization of the co-doped metal centres at the atomic level, which even leads to improved bulk properties like an extraordinary quantum yield of QY = 92%. EPR spectroscopy of 3∞[Sr0.99Eu0.01(Im)2] and 3∞[Sr0.95Eu0.05(Im)2] reveals the presence of a major EuII species with distorted octahedral symmetry which we assign to the EuII incorporated at regular metal ion lattice sites being sufficiently magnetically diluted. On the basis of our EPR experiments, the formation of EuII pairs and clusters can be ruled out just as the presence of the non-luminescent network 2∞[Sr1−xEux(Im)2(ImH)2]. Altogether, this report adds three unusual in situ coating approaches to the formation and generation of luminescent MOF thin films. These materials can be potentially used for lighting techniques or sensing owing to the advantage that a low amount of material is required to achieve a film/coating. Due to the moisture sensitivity of the lanthanide imidazolates constituting the films (including EuII), additional water resistant coating can be recommended to allow applications under a normal atmosphere.
Experimental
X-ray powder diffraction
Powder samples of the bulk materials were prepared in Lindemann glass capillaries (Ø = 0.3 mm) under an inert gas. The powder diffractograms were recorded on a Bruker D8 Discover with Da Vinci design and a LynxEye detector in transmission geometry with a focusing Göbel mirror with CuKα-radiation (λ = 1.54056 Å). The diffractograms of the coated AAO substrates were recorded on a Si-waver, sealed with a plastic dome, in reflection geometry with CuKα-radiation (λ = 1.54056 Å).Photoluminescence and vibrational spectroscopy
Excitation and emission spectra were recorded with a Horiba Jobin Yvon Fluorolog 3 photoluminescence spectrometer with a 450 W Xe lamp, an integration sphere, Czerny–Turner double grating (1200 grooves per mm) excitation and emission monochromators, and an FL-1073 PMT detector.Excitation spectra were recorded from 250 to 450 nm and corrected for the spectral distribution of the lamp intensity using a photodiode reference detector. Emission spectra were recorded from 380 to 650 nm and corrected for the spherical response of the monochromators and the detector using typical correction spectra provided by the manufacturer.
The quantum yield was also recorded using a photoluminescence spectrometer, Horiba Jobin Yvon Spex Fluorolog 3, equipped with a 450 W xenon lamp, double monochromators for excitation and emission, an integrating sphere (Ulbricht sphere), and a photomultiplier as the detector. For excitation wavelengths >330 nm, the absolute quantum yield was determined according to Friend.44 First the diffuse reflection of the sample was determined at a certain excitation wavelength. Second, the emission was measured under excitation at the same wavelength. Integration of the reflected and emitted photons by the use of the Ulbricht sphere resulted in the absolute quantum yield. Corrections were made accounting for the spectral power of the excitation source, the reflection behaviour of the Ulbricht sphere, and the sensitivity of the detector. For excitation wavelengths <330 nm, the reflectivity of the Ulbricht sphere starts to be perceptibly below 100%, resulting in a less precise determination of the absolute quantum yield. Therefore, the relative quantum yield was determined by comparison to a reference phosphor with a defined quantum yield. For that, BaMgAl10O17![[thin space (1/6-em)]](https://www.rsc.org/images/entities/char_2009.gif) :
:![[thin space (1/6-em)]](https://www.rsc.org/images/entities/char_2009.gif) Eu2+ (BAM
Eu2+ (BAM![[thin space (1/6-em)]](https://www.rsc.org/images/entities/char_2009.gif) :
:![[thin space (1/6-em)]](https://www.rsc.org/images/entities/char_2009.gif) Eu2+, Philips) was used as a reference45.
Eu2+, Philips) was used as a reference45.
FTIR spectra in the MIR area were recorded using a Thermo Nicolet FTIR-380 spectrometer; samples were measured with an ATR crystal.
EPR spectroscopy
Continuous wave EPR experiments have been performed on Bruker EMX 10–40 Q-band (34 GHz) and ELEXYS E5080 X-band (9.5 GHz) spectrometers equipped with Oxford Instruments He cryostats CF935 and ESR910, respectively.SEM, EDX and elemental analyses
SEM, EDX: film thicknesses and morphological investigations were performed on a field emission scanning electron microscope (FE-SEM) ULTRA plus (Zeiss) with a GEMINI e-beam column. Element analysis, mapping, and point-ID measurements were carried out by electron dispersive X-ray spectroscopy (EDX) using a silicon drift detector (SDD) X-Max 50 mm2 (Oxford Instruments) at 15 keV for the ratio of Sr![[thin space (1/6-em)]](https://www.rsc.org/images/entities/char_2009.gif) :
:![[thin space (1/6-em)]](https://www.rsc.org/images/entities/char_2009.gif) Eu in the barite rose analogous crystals of 3∞[Sr0.95Eu0.05(Im)2] and for the corresponding bulk material as well as for the identification of the corresponding elements in the deposited layers of 3∞[Ce(Im)3ImH]·ImH and 3∞[Tb(Im)3]. The instruments were calibrated using calibration files of Oxford Instruments prior to the analysis.
Eu in the barite rose analogous crystals of 3∞[Sr0.95Eu0.05(Im)2] and for the corresponding bulk material as well as for the identification of the corresponding elements in the deposited layers of 3∞[Ce(Im)3ImH]·ImH and 3∞[Tb(Im)3]. The instruments were calibrated using calibration files of Oxford Instruments prior to the analysis.
Elemental analysis for C, H and N was performed with a Euro Ea CHNSO Analyzer (HEKAtech GmbH).
Acknowledgements
We acknowledge the support of the Deutsche Forschungsgemeinschaft within the priority program SPP-1362 “MOFs”.Notes and references
- (a) B. F. Hoskins and R. Robson, J. Am. Chem. Soc., 1989, 111, 5962 CrossRef CAS; (b) B. F. Hoskins and R. Robson, J. Am. Chem. Soc., 1990, 112, 1546 CrossRef CAS.
- (a) G. Ferey, Chem. Soc. Rev., 2008, 37, 191 RSC; (b) J. R. Long and O. M. Yaghi, Chem. Soc. Rev., 2009, 38, 1213 RSC; (c) L. J. Murray, M. Dincă and J. R. Long, Chem. Soc. Rev., 2009, 38, 1294 RSC; (d) C. Janiak and J. K. Vieth, New J. Chem., 2010, 34, 2366 RSC.
- (a) O. M. Yaghi, H. Li, C. Davis, T. Richardson and T. L. Groy, Acc. Chem. Res., 1998, 31, 474 CrossRef CAS; (b) S. Kitagawa and M. Kondo, Bull. Chem. Soc. Jpn., 1998, 71, 1739 CrossRef CAS; (c) H. Le, M. Eddaoudi, M. O'Keefe and O. M. Yaghi, Nature, 1999, 402, 276 CrossRef; (d) G. Ferey, Chem. Mater., 2001, 13, 3084 CrossRef CAS; (e) C. Janiak, Dalton Trans., 2003, 2781 RSC; (f) S. Kitagawa and K. Uemura, Chem. Soc. Rev., 2005, 34, 109 RSC; (g) S. Kaskel, Nachr. Chem., 2005, 53, 394 CrossRef CAS; (h) A. K. Cheetham and C. N. R. Rao, Science, 2007, 318, 58 CrossRef CAS PubMed.
- (a) T. M. Reinecke, M. Eddaoudi, M. Fehr, D. Kelley and O. M. Yaghi, J. Am. Chem. Soc., 1999, 121, 1651 CrossRef; (b) J. L. C. Rowsell and O. M. Yaghi, Microporous Mesoporous Mater., 2004, 73, 3 CrossRef CAS; (c) P. Horcajada, C. Serre, M. Vallet-Regi, M. Sebban, F. Taulelle and G. Férey, Angew. Chem., Int. Ed., 2006, 45, 5974 CrossRef CAS PubMed.
- (a) S. Kitagawa, R. Kitaura and S. Noro, Angew. Chem., Int. Ed., 2004, 43, 2334 CrossRef CAS PubMed; (b) G. Fèrey, Chem. Soc. Rev., 2008, 191, 191 RSC; (c) N. Stock and S. Biswas, Chem. Rev., 2012, 112, 933 CrossRef CAS PubMed; (d) S. Kaskel, Chem.-Ing.-Tech., 2010, 82, 1019 CrossRef CAS.
- (a) M. D. Allendorf, C. A. Bauer, R. K. Bhakta and R. J. T. Houk, Chem. Soc. Rev., 2009, 38, 1330 RSC; (b) Y. Cui, Y. Yue, G. Qian and B. Chen, Chem. Rev., 2012, 112, 1126 CrossRef CAS PubMed.
- (a) C. Gomes Silva, A. Corma and H. Gracia, J. Mater. Chem., 2010, 20, 3141 RSC; (b) H. Khajavi, J. Gascon, J. M. Schins, L. D. A. Siebbeles and F. Kapteijn, J. Phys. Chem. C, 2011, 115, 12487 CrossRef CAS; (c) R. E. Morris and X. Bu, Nat. Chem., 2010, 2, 353 CrossRef CAS PubMed.
- (a) A. K. Cheetham, C. N. R. Rao and R. K. Feller, Chem. Commun., 2006, 4780 RSC; (b) J. Rocha, L. D. Carlos, F. A. Almeida Paz and D. Ananias, Chem. Soc. Rev., 2011, 40, 926 RSC.
- (a) D. F. Sava, L. E. S. Rohwer, M. A. Rodriguez and T. M. Nenoff, J. Am. Chem. Soc., 2012, 134, 3983 CrossRef CAS PubMed; (b) A. Ablet, S.-M. Li, W. Cao, X.-J. Zheng, W.-T. Wong and L.-P. Jin, Chem. – Asian J., 2013, 8, 95 CrossRef CAS PubMed; (c) P. Falcaro and S. Furukawa, Angew. Chem., Int. Ed., 2012, 51, 8431 CrossRef CAS PubMed; (d) M. D. Allendorf, C. A. Bauer, R. K. Bhakta and R. J. T. Houk, Chem. Soc. Rev., 2009, 38, 1330 RSC.
- P. R. Matthes, C. J. Höller, M. Mai, J. Heck, S. J. Sedlmaier, S. Schmiechen, C. Feldmann, W. Schnick and K. Müller-Buschbaum, J. Mater. Chem., 2012, 22, 10179 RSC.
- J.-C. Rybak, L. V. Meyer, J. Wagenhöfer, G. Sextl and K. Müller-Buschbaum, Inorg. Chem., 2012, 51, 13204 CrossRef CAS PubMed.
- J. Heine, T. Wehner, R. Bertermann, A. Steffen and K. Müller-Buschbaum, Inorg. Chem., 2014, 53, 7197 CrossRef CAS PubMed.
- L. V. Meyer, J. Vogt, F. A. Brede, H. Schäfer, M. Steinhart and K. Müller-Buschbaum, CrystEngComm, 2013, 15, 9382 RSC.
- D. Zacher, R. Schmid, C. Wöll and R. A. Fischer, Angew. Chem., Int. Ed., 2011, 50, 176 CrossRef CAS PubMed.
- O. Shekhah, J. Liu, R. A. Fischer and C. Wöll, Chem. Soc. Rev., 2011, 40, 1081 RSC.
- A. Bétard and R. A. Fischer, Chem. Rev., 2012, 112, 1055 CrossRef PubMed.
- (a) J. Liu, F. Sun, F. Zhang, Z. Wang, R. Zhang, C. Wang and S. Qiu, J. Mater. Chem., 2011, 21, 3775 RSC; (b) M. D. Allendorf, A. Bétard and R. A. Fischer, in Metal–Organic Frameworks: Applications from Catalysis to Gas Storage, ed. D. Farrusseng, Wiley-VCH, Weinheim, 2011 Search PubMed.
- J. Gascon and F. Kapteijn, Angew. Chem., Int. Ed., 2010, 49, 1530 CrossRef CAS PubMed.
- H. Liu, H. Wang, T. Chu, M. Yua and Y. Yang, J. Mater. Chem. C, 2014, 2, 8683 RSC.
- N. Campagnol, E. R. Souza, D. E. De Vos, K. Binnemans and J. Fransaer, Chem. Commun., 2014, 50, 12545 RSC.
- V. Stavila, A. A. Talin and M. D. Allendorf, Chem. Soc. Rev., 2014, 43, 5994 RSC.
- (a) R. Ranjan and M. Tsapatsis, Chem. Mater., 2009, 21, 4920 CrossRef CAS; (b) C. M. Lew, R. Cai and Y. Yan, Acc. Chem. Res., 2010, 43, 210 CrossRef CAS PubMed; (c) V. Varela-Guerrero, Y. Yoo, M. C. McCarthy and H.-K. Jeong, J. Mater. Chem., 2010, 20, 3938 RSC; (d) X. Zou, G. Zhu, F. Zhang, M. Guo and S. Qiu, CrystEngComm, 2010, 12, 352 RSC.
- (a) R. Makiura, S. Motoyama, Y. Umemura, H. Yamanaka, O. Sakata and H. Kitagawa, Nat. Mater., 2010, 9, 565 CrossRef CAS PubMed; (b) S. Motoyama, R. Makiura, O. Sakata and H. Kitagawa, J. Am. Chem. Soc., 2011, 133, 5640 CrossRef CAS PubMed.
- (a) C. M. Bell, M. F. Arendt, L. Gomez, R. H. Schmehl and T. E. Mallouk, J. Am. Chem. Soc., 1994, 116, 8374 CrossRef CAS; (b) S. Cobo, G. Molnar, J. A. Real and A. Bousseksou, Angew. Chem., Int. Ed., 2006, 45, 5786 CrossRef CAS PubMed.
- (a) S. Hausdorf, F. Baitalow, T. Böhle, D. Rafaja and F. O. Mertens, J. Am. Chem. Soc., 2010, 132, 10978 CrossRef CAS PubMed; (b) A. Bétard, S. Wannapaiboon and R. A. Fischer, Chem. Commun., 2012, 48, 10493 RSC.
- (a) S. Hermes, F. Schröder, R. Chelmowski, C. Wöll and R. A. Fischer, J. Am. Chem. Soc., 2005, 127, 13744 CrossRef CAS PubMed; (b) H. Bux, F. Liang, Y. Li, J. Cravillon, M. Wiebcke and J. Caro, J. Am. Chem. Soc., 2009, 131, 6000 CrossRef PubMed; (c) S. R. Venna and M. A. Carreon, J. Am. Chem. Soc., 2010, 132, 76 CrossRef CAS PubMed.
- (a) J. Gascon, S. Aguado and F. Kapteijn, Microporous Mesoporous Mater., 2008, 113, 132 CrossRef CAS; (b) E. Biemmi, C. Scherb and T. Bein, J. Am. Chem. Soc., 2007, 129, 8054 CrossRef CAS PubMed; (c) E. Biemmi, A. Darga, N. Stock and T. Bein, Microporous Mesoporous Mater., 2008, 114, 380 CrossRef CAS.
- (a) M. Arnold, P. Kortunov, D. J. Jones, Y. Nedellec, J. Kärger and J. Caro, Eur. J. Inorg. Chem., 2007, 60 CrossRef CAS; (b) J. Yao, D. Dong, D. Li, L. He, G. Xu and H. Wang, Chem. Commun., 2011, 47, 2559 RSC; (c) A. Centrone, Y. Yang, S. Speakman, L. Bromberg, G. C. Rutledge and T. A. Hatton, J. Am. Chem. Soc., 2010, 132, 15687 CrossRef CAS PubMed.
- (a) K. Binnemans, Chem. Rev., 2009, 109, 4283 CrossRef CAS PubMed; (b) L.-W. Han, J. Lü, T.-F. Liu, S.-Y. Gaoa and R. Cao, Dalton Trans., 2010, 39, 10967 RSC; (c) H. Guo, Y. Zhu, S. Qiu, J. A. Lercher and H. Zh, Adv. Mater., 2010, 22, 4190 CrossRef CAS PubMed; (d) A. Feinle, F. Lavoie-Cardinal, J. Akbarzadeh, H. Peterlik, M. Adlung, C. Wickleder and N. Huesing, Chem. Mater., 2012, 24, 3674 CrossRef CAS PubMed.
- L. V. Meyer, F. Schönfeld, A. Zurawski, M. Mai, C. Feldmann and K. Müller-Buschbaum, Dalton Trans. Search PubMed , submitted.
- K. Müller-Buschbaum, S. G. Torres, P. Larsen and C. Wickleder, Chem. Mater., 2007, 19, 655 CrossRef.
- (a) H. Masuda and K. Fukuda, Science, 1995, 268, 1466 CAS; (b) H. Masuda, K. Yada and A. Osaka, Jpn. J. Appl. Phys., 1998, 37, L1340 CrossRef.
- (a) W. Lee, K. Nielsch and U. Gösele, Nanotechnology, 2007, 18, 475713 CrossRef; (b) K. Schwirn, W. Lee, R. Hillenbrand, M. Steinhart, K. Nielsch and U. Gösele, ACS Nano, 2008, 2, 302 CrossRef CAS PubMed; (c) W. Lee, K. Schwirn, M. Steinhart, E. Pippl, R. Scholz and U. Gösele, Nat. Nanotechnol., 2008, 3, 234 CrossRef CAS PubMed; (d) M. Steinhart, Adv. Polym. Sci., 2008, 220, 123 CAS.
- P. Dorenbos, J. Lumin., 2000, 91, 91 CrossRef CAS.
- S. P. Nakamura, Proc.Soc. Photo-Opt. Instrum. Eng., 1997, 3002, 26 CrossRef CAS.
- A. Zurawski, M. Mai, D. Baumann, C. Feldmann and K. Müller-Buschbaum, Chem. Commun., 2011, 47, 496 RSC.
- C. Hadenfeldt, H. Jacobs and R. Juza, Z. Anorg. Allg. Chem., 1970, 379, 144 CrossRef CAS.
- C. C. Quitmann and K. Müller-Buschbaum, Z. Anorg. Allg. Chem., 2004, 630, 2422 CrossRef CAS.
- K. Müller-Buschbaum, Z. Anorg. Allg. Chem., 2004, 630, 895 CrossRef.
- U. Schindewolf, Chem. unserer Zeit, 1970, 4, 37 CrossRef CAS.
- W. A. Tarr, Am. Mineral., 1933, 18, 260 CAS.
- J.-C. Rybak, M. Hailmann, P. R. Matthes, A. Zurawski, J. Nitsch, A. Steffen, J. G. Heck, C. Feldmann, S. Götzendörfer, J. Meinhardt, G. Sextl, H. Kohlmann, S. J. Sedlmaier, W. Schnick and K. Müller-Buschbaum, J. Am. Chem. Soc., 2013, 135, 6896 CrossRef CAS PubMed.
- S. Scheizer, G. Corradi, A. Edgar and J.-M. Spaeth, J. Phys.: Condens. Matter, 2001, 13, 2331 CrossRef.
- J. V. de Mello, H. F. Wittmann and R. H. Friend, Adv. Mater., 1997, 9, 230 CrossRef CAS.
- (a) A. L. I. Stevels and A. J. M. Schrama de Pauw, J. Electrochem. Soc., 1974, 123, 691 CrossRef; (b) S. Marks, J. Heck, P. O. Burgos, C. Feldmann and P. W. Roesky, J. Am. Chem. Soc., 2012, 134, 16983 CrossRef CAS PubMed.
Footnotes |
| † Electronic supplementary information (ESI) available: Experimental details, XRPD data, photoluminescence spectra, SEM/EDX, EPR spectra and analysis. See DOI: 10.1039/c4qi00184b |
| ‡ Self-ordered AAO with a pore diameter of 400 nm and a pore depth of 100 μm was prepared following the two-step anodization of aluminium introduced by Masuda and coworkers.32 The porous alumina layer formed by the first anodization was selectively removed by etching with a solution consisting of 1.8 g chromium(VI) oxide and 7.1 g 85% phosphoric acid filled up to 100 ml with deionized water. Al substrates patterned with hexagonal arrays of indentations (replicas of the pore bottoms of the first Al layer) obtained in this way were subjected to a second anodization step carried out as described above (anodization time 20 h). The second anodization yielded AAO with pores ∼100 μm in depth and ∼180 nm in diameter. The pores were isotropically widened to 400 nm for 2 h at 30° C by treatment with an aqueous solution of 10 wt% phosphoric acid (13.3 g H3PO4 (85%) + 100 g H2O) under continuous stirring. |
| This journal is © the Partner Organisations 2015 |

