
Pressure-triggered aggregation-induced emission enhancement in red emissive amorphous carbon dots†
Qi
Wang‡
a,
Shijie
Zhang‡
b,
Boyang
Wang
a,
Xinyi
Yang
 *c,
Bo
Zou
c,
Bai
Yang
d and
Siyu
Lu
*a
*c,
Bo
Zou
c,
Bai
Yang
d and
Siyu
Lu
*a
aCollege of Chemistry and Molecular Engineering, Zhengzhou University, 100 Kexue Road, Zhengzhou 450001, China. E-mail: sylu@2013.zzu.edu.cn
bSchool of Life Sciences, Zhengzhou University, Zhengzhou 450001, China
cState Key Laboratory of Superhard Materials, College of Physics, Jilin University, Changchun, 130012, People's Republic of China. E-mail: yangxinyi@jlu.edu.cn
dState Key Laboratory of Supramolecular Structure and Materials, College of Chemistry, Jilin University, Changchun, 130012, China
First published on 4th June 2019
Abstract
Carbon dots have received extensive attention due to their unique chemical structure, excellent optoelectronic properties and convenient synthesis. However, the synthesis of carbon dots with stable red wavelength luminescence remains a challenge. Here, we used the ethanol solvothermal method with 1,3,5-benzenetrithiol as the raw material to prepare carbon dots with red emission (R-CDs). When the concentration of R-CDs increased, the fluorescence emission of the R-CDs red-shifted to the near infrared region. Importantly, the as-synthesized R-CDs offer fluorescence enhancement under external pressure due to pressure-triggered aggregation-induced emission. Fluorescence measurements of the depressurization process show that the R-CDs also have a reversible piezochromic luminescence (1 atm–1.2 GPa). The R-CDs have notable optical properties and great biocompatibility, and we used them for a transparent fluorescent thin film, light emitting diode (LED) and cell imaging. The excellent optical properties of R-CDs indicate their broad potential applicability in biomedical and luminescent materials.
New conceptsSince 2013, the synthesis of red emissive carbon dots (CDs) and study of the luminescence origination of CDs have been the most important research topics in carbon nanomaterials. In our previous work, we firstly discovered piezochromism of CDs, providing a new method for studying the luminescence mechanism of CDs. However, the fluorescence of most CDs is quenched under high pressure, thus pressure-triggered fluorescence enhancement is of great value for the application of piezochromic materials. Here, we synthesized red emissive CDs via a solvothermal route with an absolute photoluminescence quantum yield of 31.82%. We observed that the as-synthesized CDs offer 2.7-fold fluorescence enhancement under external pressure and reversible piezochromic luminescence. Furthermore, our theoretical studies further support our prediction that the blocked intraparticle oscillations triggered emission enhancement. As far as we know, this is the first report of pressure-triggered aggregation-induced emission enhancement in red emissive CDs. We expect that this work will be beneficial for fabricating red emissive CDs with high quantum yields and provide new information for understanding the luminescence mechanism under high pressure, which will promote their application in bio-imaging, pressure sensors and light-emitting devices. |
Introduction
Carbon dots (CDs) have attracted broad research interest due to their unique chemical structures, excellent optoelectronic properties and convenient synthesis, which give them wide potential applicability.1–8 However, most known CDs show only blue emission with ultraviolet (UV) or blue excitation, which limits their further applications in biomedical and luminescent devices.9–12 Red emissive CDs have significant potential value, especially in biomedicine, as they can penetrate tissues with less damage compared with blue emissive CDs.13–18 Red phosphors represent an indispensable component of full-colour emitting display devices.3,19–21 Therefore, the development of efficient and reproducible strategies to produce red emissive CDs would promote their applicability in biomedicine and imaging displays.Recently, luminescent materials sensitive to environmental stimuli have attracted increased research attention due to their potential applications in luminescent devices.22–25 Pressure variations are common in nature, and thus pressure-responsive luminescent materials have a broad range of potential applications.26–31 As a new type of potential piezochromic material, CDs show red- or blue-shifted PL emission under external pressure.26 However, the structures of most CDs are damaged under high pressure, thereby quenching their fluorescence.
Our previous work reported a blue-shift in the fluorescence of two-photon absorptive yellow emissive CDs (Y-CDs) after a pressure trigger.32 First-principles calculations confirmed that the shift occurred in response to a change in the type of Y-CD hybridization under high pressure. Zou et al. reported that the piezochromic properties of CDs are related to the number of carbonyl groups and the π-electron system.33 As the external pressure increases, enhanced π–π stacking in the conjugated structure of CDs leads to red-shifted PL emission; a decrease in the number of carbonyl groups induces a blue-shifted PL emission. Xiao et al. reported that nitrogen-doped CDs have reversible piezochromic luminescence.34 Qu et al. reported solvent-dependent red- and blue-shifted piezochromism in CDs under high pressure.35 Pressure induced enhanced intermolecular hydrogen bonding and addition reactions between water molecules and surface electron withdrawing groups on the CDs led to the observed piezochromism. These findings show that the fluorescence of most CDs will be quenched under high pressure, thus pressure-triggered fluorescence enhancement is of great value for the application of piezochromic materials.
Here, we used 1,3,5-benzenetrithiol to synthesize red-emitting CDs with an absolute photoluminescence quantum yield (PLQY) of 31.82%. The as-synthesized R-CDs showed reversible fluorescence enhancement under external pressure without any shift in fluorescence. Pressurization and depressurization did not irreversibly change the optical properties of R-CDs. When the pressure is increased above 1.2 GPa, the molecular structure of R-CDs is destroyed and leads to a decrease in the fluorescence intensity. The R-CDs showed good performance in cell imaging and luminescent devices and are thus likely to be useful in luminescent materials.
Results and discussion
The synthesis of R-CDs (Fig. 1a) involves the solvothermal treatment of 1,3,5-benzenetrithiol with sulfuric acid at 200 °C. Transmission electron microscopy (TEM) showed the as-prepared R-CDs to be dispersed without apparent aggregation and the inset high-resolution TEM showed that the R-CDs have no crystal lattice (Fig. 1b). Their average size distribution was about 15.40 ± 0.27 nm (Fig. 1c). The corresponding fast Fourier transform pattern in Fig. 1d shows the amorphous nature of the R-CDs. Fig. 1e shows a typical X-ray diffraction (XRD) pattern with a single broad peak at about 2θ = 24.9°, which was also attributed to highly disordered carbon atoms.12 The chemical structure of the R-CDs was further characterized by X-ray photoelectron spectroscopy (XPS) (Fig. 1f) and Fourier transform infrared spectroscopy (FTIR) (Fig. 1g). C 1s analysis found three peaks with binding energies at 284.8, 286.2 and 288.6 eV, corresponding to C–C/C![[double bond, length as m-dash]](https://www.rsc.org/images/entities/char_e001.gif) C, C–S, and C–O bonds, respectively. The S 2p analysis (Fig. S1a, ESI†) shows three peaks with binding energies of 168.3, 169.2 and 170.3 eV corresponding to C–S, S–O, and SO bonds, respectively. The O 1s analysis (Fig. S1b, ESI†) found two peaks with binding energies of 531.7 and 533.2 eV corresponding to C–O and S–O bands, respectively. The bands at 1400 and 920–850 cm−1 in the FTIR spectrum indicate the existence of a conjugated aromatic structure. The bands at 1220 and 1020 cm−1 are the stretching vibrations of C–O and O–H, respectively and those at 790 and 610 cm−1 reflect S–O and C–S bonds, respectively. The bands at 3130 and 2520 cm−1 are attributed respectively to C–H and S–H stretching vibrations. Fig. 1a shows that the 1,3,5-benzenetrithiol molecules were linked together by releasing H2S, and a large conjugated system rich in sulfhydryl groups was gradually formed. Sulfuric acid promotes the carbonization nucleation of R-CDs, and some carboxyl groups are formed on the surface, and thus amorphous light red carbon dots are finally formed.
C, C–S, and C–O bonds, respectively. The S 2p analysis (Fig. S1a, ESI†) shows three peaks with binding energies of 168.3, 169.2 and 170.3 eV corresponding to C–S, S–O, and SO bonds, respectively. The O 1s analysis (Fig. S1b, ESI†) found two peaks with binding energies of 531.7 and 533.2 eV corresponding to C–O and S–O bands, respectively. The bands at 1400 and 920–850 cm−1 in the FTIR spectrum indicate the existence of a conjugated aromatic structure. The bands at 1220 and 1020 cm−1 are the stretching vibrations of C–O and O–H, respectively and those at 790 and 610 cm−1 reflect S–O and C–S bonds, respectively. The bands at 3130 and 2520 cm−1 are attributed respectively to C–H and S–H stretching vibrations. Fig. 1a shows that the 1,3,5-benzenetrithiol molecules were linked together by releasing H2S, and a large conjugated system rich in sulfhydryl groups was gradually formed. Sulfuric acid promotes the carbonization nucleation of R-CDs, and some carboxyl groups are formed on the surface, and thus amorphous light red carbon dots are finally formed.
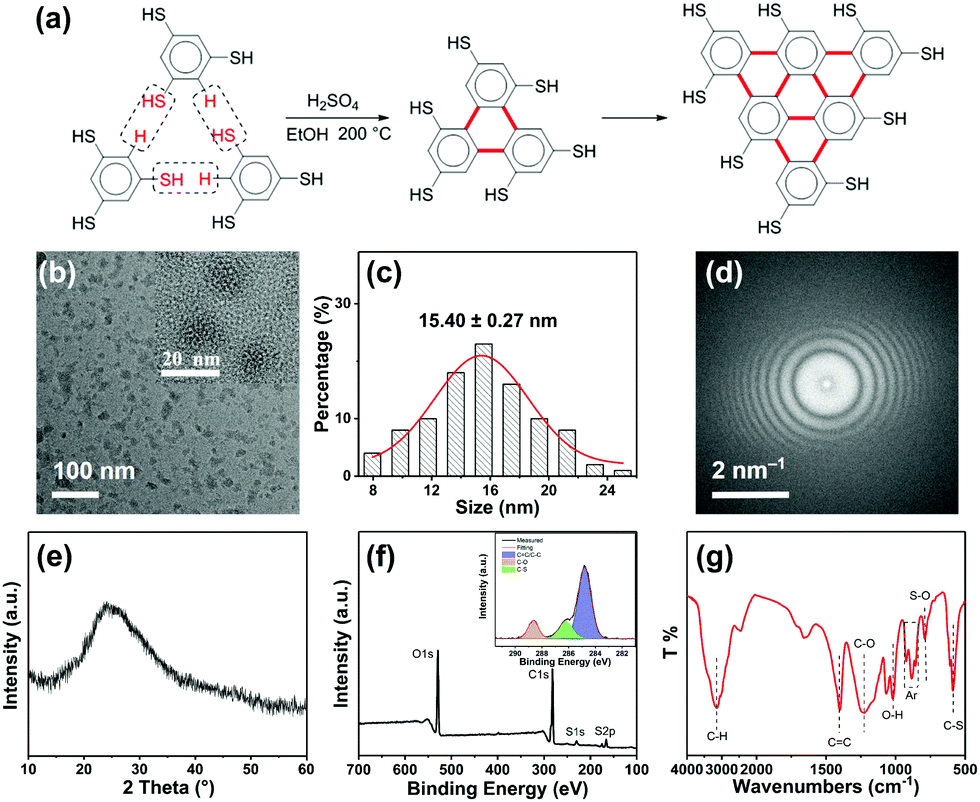 | ||
| Fig. 1 (a) Synthesis route of R-CDs; (b) TEM and high-resolution TEM (inset) images, (c) the corresponding particle size distribution, (d) fast Fourier transform patterns, (e) XRD patterns, (f) XPS survey spectrum (inset: high-resolution XPS of C 1s), and (g) FTIR of R-CDs. | ||
The UV-vis absorption spectrum of the R-CDs has two absorption maxima at 237 nm and 300 nm (Fig. 2a, blue line), which were attributed to the π → π* transition of the aromatic CC band and the n → π* transition of the S groups, respectively.7 The PL spectra of the R-CDs show strong PL emission, with the maximum located near 586 nm (Fig. 2a, yellow line) and a broad excitation peak with a maximum near 552 nm (Fig. 2a, green line). The R-CD aqueous solution emitted strong red light under 365 nm UV irradiation (Fig. 2a, right inset). Fig. 2b presents the excitation-independent emission spectra of the R-CDs from 340 to 600 nm. The time-resolved photoluminescence (TRPL) spectra of the R-CDs show a two exponential function fitting over the entire spectra, with an average long PL lifetime of 8.97 ns (Fig. 2c). Due to fluorescence resonance energy transfer, the fluorescence emission of the R-CDs red-shifted to 672 nm as the concentration of R-CDs increased (HR-CDs, Fig. 2d). The PL excitation spectrum of the HR-CDs also red-shifted to 626 nm (Fig. 2d, green line). Fig. 2e presents the PL emission spectra of the HR-CDs from 380 to 700 nm. The average PL lifetime of the HR-CDs was 8.95 ns, and it showed a two exponential function fitting (Fig. 2f).
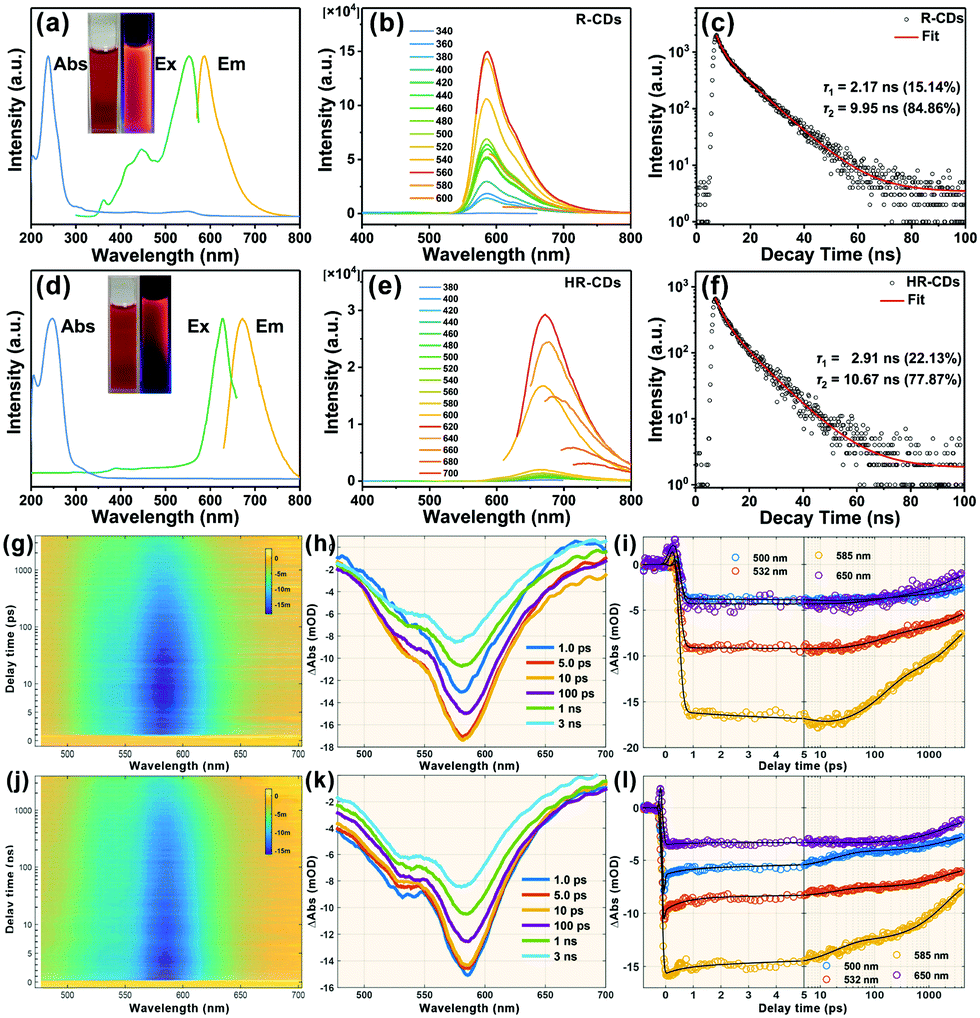 | ||
| Fig. 2 Corresponding UV-vis absorption, PL and time-resolved PL decay spectra of (a–c) R-CDs and (d–f) HR-CDs, respectively. (g) Two-dimensional pseudo-colour map of the TA spectra of the R-CDs. (h) TA spectra of R-CDs at the indicated delay times from 1 ps to 3 ns. (i) Kinetic traces at different probe wavelengths. The pump wavelength of (g–i) is 360 nm and (j–l) is 450 nm. | ||
Femtosecond transient absorption (fs-TA) measurements at 360 nm excitation revealed the carriers’ relaxation dynamics and the luminescence mechanism of the R-CDs. Fig. 2g shows the pseudo-3D plot of the TA spectra of the R-CDs probed at 480–710 nm and scanned with delay times from −1 ps to 4 ns. There is only a large blue region (negative signal) from 500 nm to 650 nm. That is assigned to ground state bleaching and stimulated emission (SE) according to steady state absorption spectra and PL spectra. The TA spectra with different time delays are shown in Fig. 2h; the SE signal gradually increased before 10 ps, and then decreased with increasing delay time. We can infer that the R-CDs were excited to a higher state by 360 nm and transit in a lower luminescent state over several picoseconds. Fig. 2i presents kinetic traces of four characteristic wavelengths in terms of delay time.
To explore the relaxation channels and luminescence mechanism, four exponent decay functions were convolved with the instrument response function to globally fit the TA spectra. The fitted lifetimes were: 5.8 ± 0.3 ps, 143 ± 4 ps, 2.9 ± 0.2 ns and >10 ns. Fig. S2 (ESI†) shows the fitted decay associated difference spectrum (DADS) of the R-CDs. The first DADS shows a positive signal amplitude distributed near 580 nm, which corresponds to a fluorescence increasing process. The other DADS amplitudes are all negative, showing that the other three channels experienced decay. The TRPL spectra show that the R-CDs had two fluorescence lifetimes (2.17 ns and 9.95 ns). The values are almost the same as the last two lifetimes of the TA spectra, suggesting that the last two channels are related to the fluorescence emission of R-CDs, with different DADS corresponding to different luminescence ranges. The third DADS (2.9 ns) have more near-infrared spectra compared to the previous DADS.
For further understanding the fluorescence mechanism, the TA spectra of the R-CDs were measured under 450 nm excitation. Fig. 2j shows the pseudo-3D plot of the TA spectra of the R-CDs. The single blue region is similar to that observed under excitation at 360 nm. However, no increase process of SE is shown in Fig. 2k. Fig. 2l presents kinetic traces of four characteristic wavelengths in terms of delay time. The TA spectra were also globally fitted with four exponent decay functions to obtain four lifetimes: 0.65 ± 0.2 ps, 19 ± 2 ps, 2.1 ± 0.4 ns and >10 ns. The last two lifetimes are similar to the previous experiment despite different excitations. The four DADS amplitudes (Fig. S3, ESI†) are all negative indicating that the R-CDs experienced four decay channels under 450 nm excitation. The third and fourth DADS (Fig. S4, ESI†) at two different excitation wavelengths have similar shapes, suggesting that the luminescent state of the R-CDs had the same fluorescence relaxation channels. This indicates that the PL spectra of the R-CDs did not depend on the excitation wavelength.
The piezochromic effect was investigated by measuring the luminescence of R-CDs while applying pressure. The in situ high-pressure experiments shown here used a symmetric diamond anvil cell (DAC) at room temperature (Fig. 3a) and used ethanol as a pressure transfer medium (PTM). Upon compression, the R-CDs first exhibited distinct emission enhancement in the beginning at 0.05 GPa, but the fluorescence intensity then gradually decreased (Fig. 3b). Note that the fluorescence intensities within the applied pressure range of 0.05–0.5 GPa were superior to the one at 1 atm. The normalized fluorescence intensities and fluorescence images at each pressure during pressurization follow this trend (Fig. 3c). The brightness of the fluorescence image corresponds to the fluorescence intensity. During decompression, the fluorescence intensity gradually increased, and then recovered to the original level at atmospheric pressure (Fig. 3e). The normalized fluorescence intensity and fluorescence images during pressure release are shown in Fig. 3f. The brightness of the fluorescence image increases with decreasing pressure. The intensity at 0.05 GPa was inferior to the one beginning at 0.05 GPa due to the hysteresis effect. UV-vis spectroscopy also revealed this reversibility during the entire compression and release cycle.
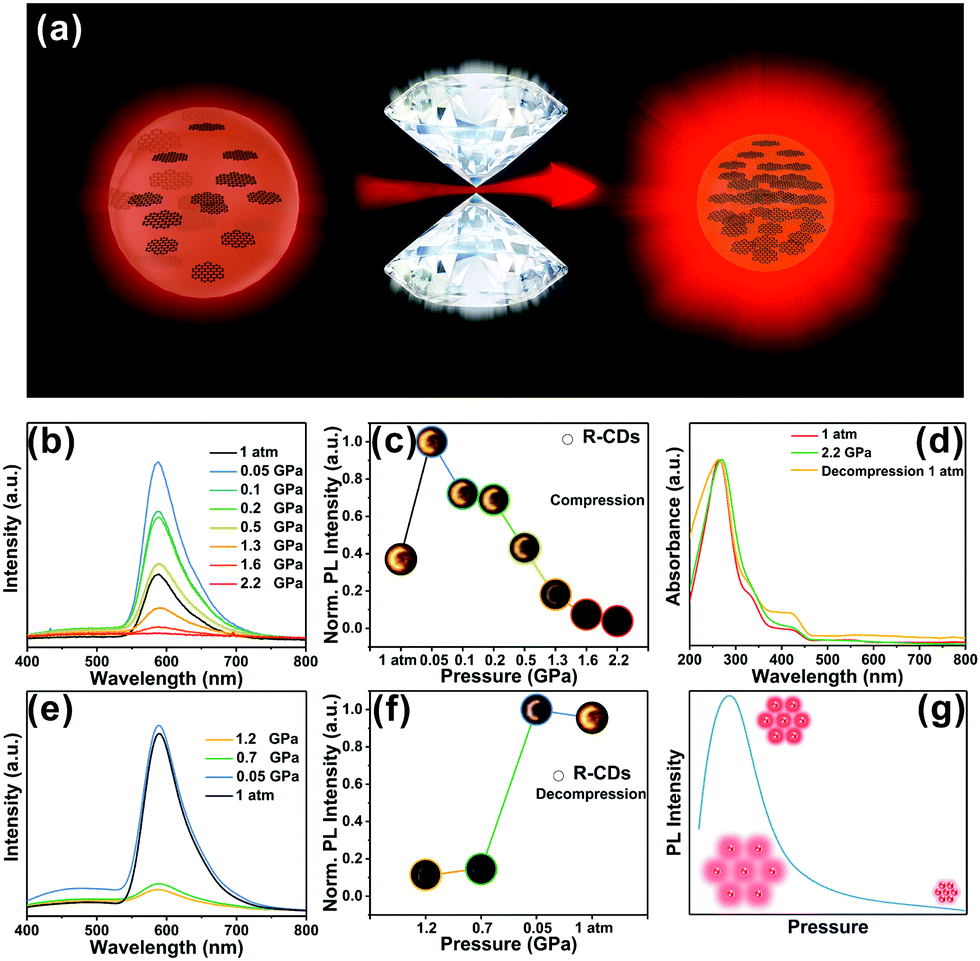 | ||
| Fig. 3 (a) Illustration of the fluorescence enhancement of R-CDs under high pressure; (b and e) PL spectra of R-CDs as the pressure increases and releases under ambient conditions. (c and f) PL emissive peak changes of R-CDs with increasing and releasing pressure. (d) UV-vis spectra of R-CDs as the pressure increases and releases under ambient conditions. (g) The R-CDs’ reversible process. | ||
For structural scrutinization, the R-CDs were composed of aromatic rings cross-linked by weak interactions. Thus, aromatic rings in the R-CDs undergo dynamic intraparticle oscillations against each other. This consumed the excited-state energy in a nonradiative decay pathway. Compression greatly restricted these intraparticle oscillations owing to the physical constraint, and thus blocked the non-radiative pathway and opened up the radiative channel. As a result, R-CDs exhibited obvious emission enhancement at this applied pressure. At a subsequent pressure level, the intermolecular distance between the R-CDs continued to shrink, causing them to agglomerate. The resulting formation of detrimental species such as excimers decreased the fluorescence intensity; i.e., it resulted in aggregation-caused quenching. This process was also confirmed by fluorescence intensity measurements during pressure release. Pressurization and pressure release did not irreversibly change the optical properties of the R-CDs, indicating that the phase transition under high pressure could not be successfully intercepted. This reversible process broadens the applicability of R-CDs in various materials (Fig. 3g). The R-CDs could be effectively exploited as promising pressure-sensing materials due to the fluorescence enhancement at low applied pressure (tens of MPa).
The pressure-triggered fluorescence enhancement was further examined via density functional theory (DFT) and time-dependent DFT (TDDFT) calculations. The B3LYP hybrid functional and 6-31+g(d,p) basis set were used to study the ground and excited states. The emission spectrum was computed based on the excited states. Upon compression at low pressure (<0.5 GPa), the two R-CDs are brought close together to form a “dimer” and the intraparticle oscillations are blocked. The dimer shows strong intra-molecular charge transfer (from the natural transition orbitals shown in Fig. 4), which is responsible for the enhanced emissions. These calculations further support the prediction that suppressed intraparticle oscillations triggered the enhanced emission.
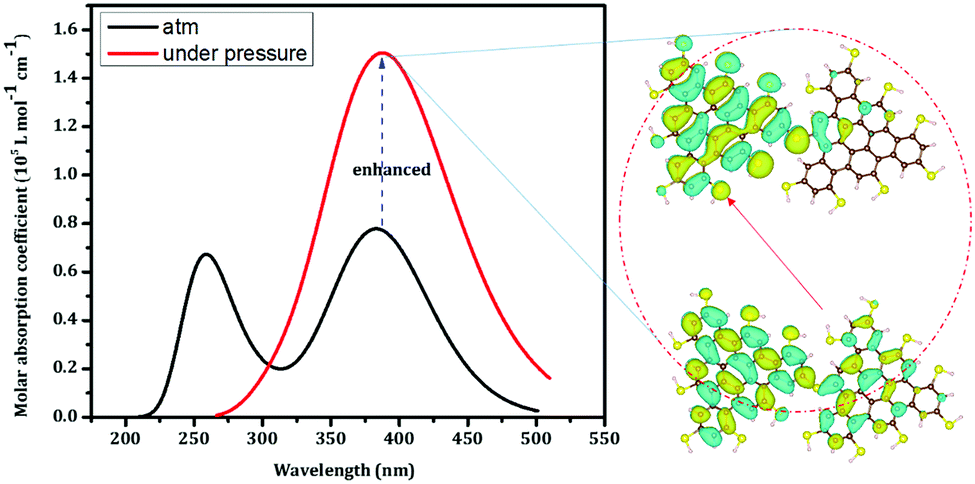 | ||
| Fig. 4 The computed emission spectrum of R-CDs under ambient conditions and compressed at low pressure together with the natural transition orbitals for enhanced emission near 380 nm for the compressed R-CDs. | ||
As the R-CDs showed good stability (Fig. S5, ESI†) and biocompatibility, they were applied to cell imaging using three different light excitations (three channels). Fig. S6 (ESI†) presents bright-field and fluorescent images of AGS and K562 cells incubated with R-CDs. The images appear consistent for both types of cells labelled with R-CDs. When excited at three excitation wavelengths (405, 488, and 561 nm), the cells fluoresced bright blue, green and red, respectively. The variable emission colour provides a broad range of detectable wavelengths for use during cell imaging. Close observation shows that R-CDs are mainly distributed in the cytoplasm of cells. This result indicates that R-CDs easily penetrated the cell membrane to stain the cytoplasm outside the nucleus. Therefore, the R-CDs are an ideal cellular imaging agent.
With remarkable optical properties, low self-absorption and relatively long emission wavelengths, the R-CDs lend themselves to use in luminescent devices. We fabricated R-CDs in a thin film-on-slab structure (5 cm × 5 cm) as shown in Fig. 5a. When exposed to natural light, the film is highly transparent: a pattern behind it is clearly visible. As shown in Fig. 5b, the film emitted strong pink light from its edges when UV light was illuminated on the front surface. In addition, natural light excited the film to some extent, leading to a pink tint at its edges. The film has promising potential as a window material.
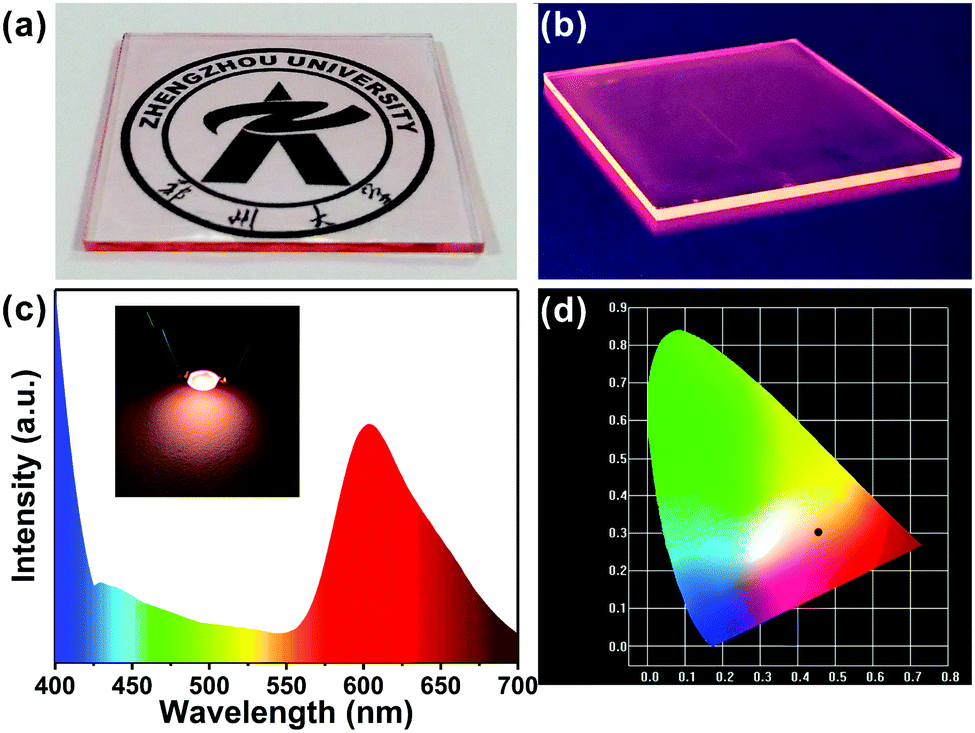 | ||
| Fig. 5 (a) Photographs of the transparent film comprising R-CDs under natural light and (b) under UV light. (c) The photograph and emission spectrum of the working LED with pink emission. (d) The colour coordinates of the pink LED (0.46, 0.31). | ||
The excellent optical properties of the R-CDs were put to use in a pink LED: polymerizing the R-CDs in polydimethylsiloxane (PDMS) solution formed nanocomposites that exhibited red emission. The PDMS/R-CD nanocomposites were coated on 365 nm excitation light-emitting chips and cured in an oven to form a solid-state lighting unit. The emission spectra of the devices (Fig. 5c) covered the range from 400 to 700 nm and showed CIE (Commission Internationale de L’Eclairage) colour coordinates of (0.46, 0.31) (Fig. 5d). The red emission of the PDMS/R-CD phosphors appears suitable for use in practical lighting applications.
Conclusions
In summary, we synthesized red emissive CDs via a solvothermal route from 1,3,5-benzenetrithiol using ethanol as the solvent with an absolute PLQY of 31.82%. To the best of our knowledge, this is the first report of R-CDs showing pressure-triggered aggregation-induced emission enhancement and reversible piezochromic luminescence. Theoretical calculations reveal that the accumulation of R-CD molecules triggered enhanced emissions under high pressure. Moreover, the R-CDs showed good biocompatibility and optical properties, and we imaged them in living cells and applied them to transparent luminescent thin films and LEDs. We are currently investigating the applications of pressure-triggered fluorescence emission-enhancement of R-CDs.Conflicts of interest
There are no conflicts to declare.Acknowledgements
This work was supported in part by the China Postdoctoral Science Foundation (No. 2017M621198 and 2018M640681) and National Natural Science Foundation of China (No. 31601587, 81870095, 21725304, 11874027 and 11504126).Notes and references
- Y. Yan, J. Gong, J. Chen, Z. Zeng, W. Huang, K. Pu, J. Liu and P. Chen, Adv. Mater., 2019, 1808283 CrossRef PubMed.
- K. J. Mintz, Y. Zhou and R. M. Leblanc, Nanoscale, 2019, 11, 4634–4652 RSC.
- X. Miao, D. Qu, D. Yang, B. Nie, Y. Zhao, H. Fan and Z. Sun, Adv. Mater., 2018, 30, 1704740 CrossRef PubMed.
- H. Ding, J.-S. Wei, P. Zhang, Z.-Y. Zhou, Q.-Y. Gao and H.-M. Xiong, Small, 2018, 14, 1800612 CrossRef PubMed.
- S. Zhu, Y. Song, J. Wang, H. Wan, Y. Zhang, Y. Ning and B. Yang, Nano Today, 2017, 13, 10–14 CrossRef CAS.
- Z. Tian, X. Zhang, D. Li, D. Zhou, P. Jing, D. Shen, S. Qu, R. Zboril and A. L. Rogach, Adv. Opt. Mater., 2017, 5, 1700416 CrossRef.
- S. Lu, L. Sui, J. Liu, S. Zhu, A. Chen, M. Jin and B. Yang, Adv. Mater., 2017, 29, 1603443 CrossRef PubMed.
- S. Anwar, H. Ding, M. Xu, X. Hu, Z. Li, J. Wang, L. Liu, L. Jiang, D. Wang, C. Dong, M. Yan, Q. Wang and H. Bi, ACS Appl. Bio Mater., 2019 DOI:10.1021/acsabm.9b00112.
- Z. Wei, B. Wang, Y. Liu, Z. Liu, H. Zhang, S. Zhang, J. Chang and S. Lu, New J. Chem., 2019, 43, 718–723 RSC.
- W. Li, Y. Liu, M. Wu, X. Feng, S. A. T. Redfern, Y. Shang, X. Yong, T. Feng, K. Wu, Z. Liu, B. Li, Z. Chen, J. S. Tse, S. Lu and B. Yang, Adv. Mater., 2018, 30, 1800676 CrossRef PubMed.
- S. Lu, X. Zhao, S. Zhu, Y. Song and B. Yang, Nanoscale, 2014, 6, 13939–13944 RSC.
- S. Zhu, Q. Meng, L. Wang, J. Zhang, Y. Song, H. Jin, K. Zhang, H. Sun, H. Wang and B. Yang, Angew. Chem., Int. Ed., 2013, 52, 3953–3957 CrossRef CAS PubMed.
- J. Liu, D. Li, K. Zhang, M. Yang, H. Sun and B. Yang, Small, 2018, 14, 1703919 CrossRef PubMed.
- Y. Liu, W. Duan, W. Song, J. Liu, C. Ren, J. Wu, D. Liu and H. Chen, ACS Appl. Mater. Interfaces, 2017, 9, 12663–12672 CrossRef CAS PubMed.
- W. Gao, H. Song, X. Wang, X. Liu, X. Pang, Y. Zhou, B. Gao and X. Peng, ACS Appl. Mater. Interfaces, 2017, 10, 1147–1154 CrossRef PubMed.
- S. Sun, L. Zhang, K. Jiang, A. Wu and H. Lin, Chem. Mater., 2016, 28, 8659–8668 CrossRef CAS.
- J. Xu, X. Jie, F. Xie, H. Yang, W. Wei and Z. Xia, Nano Res., 2018, 11, 3648–3657 CrossRef CAS.
- Z. Wang, F. Yuan, X. Li, Y. Li, H. Zhong, L. Fan and S. Yang, Adv. Mater., 2017, 29, 1702910 CrossRef PubMed.
- K. Holá, M. Sudolská, S. Kalytchuk, D. Nachtigallová, A. L. Rogach, M. Otyepka and R. Zbořil, ACS Nano, 2017, 11, 12402–12410 CrossRef PubMed.
- L. Pan, S. Sun, A. Zhang, K. Jiang, L. Zhang, C. Dong, Q. Huang, A. Wu and H. Lin, Adv. Mater., 2015, 27, 7782–7787 CrossRef CAS PubMed.
- H. Ding, S.-B. Yu, J.-S. Wei and H.-M. Xiong, ACS Nano, 2015, 10, 484–491 CrossRef PubMed.
- D. Lv, R. Wang, G. Tang, Z. Mou, J. Lei, J. Han, S. De Smedt, R. Xiong and C. Huang, ACS Appl. Mater. Interfaces, 2019, 11, 12880–12889 CrossRef CAS PubMed.
- S. Gao, G. Tang, D. Hua, R. Xiong, J. Han, S. Jiang, Q. Zhang and C. Huang, J. Mater. Chem. B, 2019, 7, 709–729 RSC.
- X. Li, Y. Wu, S. Zhang, B. Cai, Y. Gu, J. Song and H. Zeng, Adv. Funct. Mater., 2016, 26, 2435–2445 CrossRef CAS.
- J. Song, J. Li, X. Li, L. Xu, Y. Dong and H. Zeng, Adv. Mater., 2015, 27, 7162–7167 CrossRef CAS PubMed.
- C. Liu, G. Xiao, M. Yang, B. Zou, Z.-L. Zhang and D.-W. Pang, Angew. Chem., Int. Ed., 2018, 57, 1893–1897 CrossRef CAS PubMed.
- Y. Cao, G. Qi, C. Liu, L. Wang, Z. Ma, K. Wang, F. Du, G. Xiao and B. Zou, J. Phys. Chem. C, 2018, 122, 9332–9338 CrossRef CAS.
- Y. Chen, F. Ke, P. Ci, C. Ko, T. Park, S. Saremi, H. Liu, Y. Lee, J. Suh, L. W. Martin, J. W. Ager, B. Chen and J. Wu, Nano Lett., 2016, 17, 194–199 CrossRef PubMed.
- L. Wang, K. Wang, B. Zou, K. Ye, H. Zhang and Y. Wang, Adv. Mater., 2015, 27, 2918–2922 CrossRef CAS PubMed.
- Y. Dong, B. Xu, J. Zhang, X. Tan, L. Wang, J. Chen, H. Lv, S. Wen, B. Li, L. Ye, B. Zou and W. Tian, Angew. Chem., Int. Ed., 2012, 51, 10782–10785 CrossRef CAS PubMed.
- Z. Chi, X. Zhang, B. Xu, X. Zhou, C. Ma, Y. Zhang, S. Liu and J. Xu, Chem. Soc. Rev., 2012, 41, 3878 RSC.
- S. Lu, G. Xiao, L. Sui, T. Feng, X. Yong, S. Zhu, B. Li, Z. Liu, B. Zou, M. Jin, J. S. Tse, H. Yan and B. Yang, Angew. Chem., Int. Ed., 2017, 56, 6187–6191 CrossRef CAS PubMed.
- Y. Zhan, T. Geng, Y. Liu, C. Hu, X. Zhang, B. Lei, J. Zhuang, X. Wu, D. Huang, G. Xiao and B. Zou, ACS Appl. Mater. Interfaces, 2018, 10, 27920–27927 CrossRef CAS PubMed.
- T. Geng, T. Feng, Z. Ma, Y. Cao, Y. Chen, S. Tao, G. Xiao, S. Lu, B. Yang and B. Zou, Nanoscale, 2019, 11, 5072–5079 RSC.
- P. Jing, D. Han, D. Li, D. Zhou, D. Shen, G. Xiao, B. Zou and S. Qu, Nanoscale Horiz., 2019, 4, 175–181 RSC.
Footnotes |
| † Electronic supplementary information (ESI) available: Synthesis, experimental procedures and supplementary spectra. See DOI: 10.1039/c9nh00287a |
| ‡ These authors contributed equally to this work. |
| This journal is © The Royal Society of Chemistry 2019 |