High performance SERS active substrates fabricated by directly growing graphene on Ag nanoparticles†
Shicai Xu*a,
Jihua Wang*a,
Yan Zoua,
Hanping Liua,
Guiying Wanga,
Xiumei Zhanga,
Shouzhen Jiangb,
Zhen Lib,
Dongyan Caoa and
Rongxia Tanga
aCollege of Physics and Electronic Information, Shandong Provincial Key Laboratory of Biophysics, Dezhou University, Dezhou 253023, China. E-mail: shicaixu@dzu.edu.cn; jhw25336@126.com
bSchool of Physics and Electronics, Shandong Normal University, Jinan 250014, China
First published on 16th October 2015
Abstract
An efficient surface enhanced Raman scattering (SERS) substrate of graphene-isolated Ag nanoparticle (G/AgNP) has been developed by using excimer laser to ablate the ordered pyrolytic graphite in high vacuum onto Ag nanoparticles. By combining the electromagnetic activity of AgNPs and unique physical/chemical properties of graphene, the G/AgNP substrates shows high performance in terms of sensitivity, signal-to-noise ratio and reproducibility. The average enhancement factor obtained from the G/AgNP substrates for rhodamine 6G probe molecules is over 108. The maximum deviations of SERS intensities from 20 positions of a same SERS substrate are in the range of 4.20% to 6.75% and from 20 different substrates in various batches are in the range of 4.43% to 7.71%, depending on different vibration modes. As a practical application of this SERS system, we detect the adenosine concentration in human serum. The detection results show a good linear correlation between SERS intensity and adenosine concentration within the range of 2 to 200 nM. This work may open up new opportunities in developing the applications of SERS in biomedical diagnostics, biological sensing and other biotechnology.
Introduction
Surface-enhanced Raman scattering spectroscopy has been widely used as a fingerprint method for ultrasensitive and selective detection in biology and chemistry.1–3 It is generally considered that SERS enhancement results from a combination of an electromagnetic mechanism (EM) and a chemical mechanism (CM).4 The EM originates from the dramatic increase in the local electromagnetic field, which can boost the pristine Raman signal by 108 times or more.5,6 Yet for CM, it is caused by charge transfer between the target molecules and the substrate, usually has a minor enhancement factor of 10 to 102.7 It has been demonstrated that the EM enhancement of SERS is from metal nanoparticles (NPs) and the enhancement factor depends on the gap between adjacent NPs.8–10 A great deal of research effort has been done to fabricate the controllable and reproducible metallic nanostructures incorporating as much as possible the hot spots, such as colloidal clusters of noble metallic NPs,11–13 surface-roughened noble metals,14 and well-defined metal architectures.15–17 During the past four decades, great efforts and ingenuity have gone towards creating a more desirable SERS substrate, resulting in extraordinary sensitivity.18–22 Yet SERS has not entered the widespread real world application stage. To date, the SERS as a routine analysis tool is still facing many other challenges: first, besides the regular nanostructures, it is also required to capture the interested molecules effectively and homogenously on the surface of the SERS substrate; second, the spurious signals induced by the metal will cause additional fluctuation, including instability of the metal substrate, distortion of SERS spectra arising from metal–molecule interactions, and low reproducibility of the Raman signal caused by photo-induced damage;23 third, the drift of analyte molecules on substrate surfaces caused by excitation laser will also result in the blinking of SERS signals. These challenges cause large fluctuation of SERS signal even in the most sophisticated measurements. While the SERS community have strived to create reproducible structures by fabricating well-defined SERS active substrates,8,15 the above mentioned problems may be equally important but ignored to some extent.Recently, a thin and pinhole free layer of SiO2 or Al2O3 as an inert shell was employed in the SERS substrates to isolate metal nanostructures from their surroundings.24 This strategy shows one overwhelmingly attractive feature that the SERS signal derives only from the target analytes and spurious signals induced by the metal is locked by inert shell. Fabrication of SERS substrates with an ultrathin passivated surface at a lowest loss of electromagnetic enhancement activity is the key to shell-isolated SERS. The main challenge is to get a pinhole-free coating layer with a very small thickness. Graphene, a 2D atomic crystal with densely packed carbon atoms in a honeycomb crystal lattice,25 is well-known for its unique electrical performance and the amazing applications in nanoscale electronics.26 As well as the wide use in electronics field, the atomic thickness and seamless structure of graphene also makes it a natural candidate material for shell-isolated SERS.27 To achieve this goal, many efforts have been done to fabricate graphene-isolated metallic nanostructure for SERS. Xie's group fabricated a hybrid SERS-active platform consisting of a single layer graphene covering a quasiperiodic Au nanopyramid that enabled single molecule detection for rhodamine 6G (R6G).27 Qu's group has shown that silver nanoparticles protected by monolayer graphene can serve as a stabilized substrate for surface enhanced Raman spectroscopy.28 Li et al. fabricated graphene oxide wrapped Ag nanoparticles for surface-enhanced Raman scattering.29 These works provided facile methods to use graphene to wrap all kinds of metal nanoparticles and more stable SERS signals were obtained. Nevertheless, there is still a principal disadvantage in signal stability and reproducibility for these methods. As in all the above mentioned methods, the graphene-metal hybrids were obtained either through transferring a graphene sheet on the surface of metal nanoparticles27,28 or spin-coating a mixed solution of graphene and metal nanoparticles.29 However, both approaches are hard to provide a close contact between metallic nanoparticles and graphene shell. The space between graphene and metal nanoparticles will inevitably cause apparent loss of electromagnetic enhancement activity as the electromagnetic enhancement efficiency decays rapidly with distance between the metal nanoparticles and analytes. Moreover, the suspended and wrinkled graphene structures always formed nearby the gaps of nanoparticles,27,29 making graphene-metal hybrids nonuniform and easy to damage, further reducing in the homogeneity and reproducibility of the SERS substrates. Thus, it is desired to develop a new way to directly grow graphene layer on Ag nanoparticles to fabricate Ag–graphene SERS substrates with good stability and reproducibility.
In this work, we directly grew a graphene on Ag nanoparticles by using excimer laser to ablate the ordered pyrolytic graphite in high vacuum. This method provides an atomically thin, seamless, and chemically inert net to tightly wrap the metallic nanoparticles. Compared with previously reported works, this approach exhibits three advantages. Firstly, the direct growth mode make graphene layer tightly wrap the metal nanoparticles, minimize the loss of electromagnetic enhancement activity. Secondly, the direct grown graphene shell is free from suspended and wrinkled structures and effectively avoids graphene damage, thus providing enhanced chemical stability and reproducibility of SERS. Thirdly, direct grown graphene can cover every place of the G/AgNPs, even the narrow gaps of particles (hot spots). So the target molecules can be more effectively absorbed on the hot spots and thus more sensitive Raman signals are expected. The G/AgNPs boost a high density of hot spots with average SERS enhancement factor over 108 for R6G detection. The added graphene layer enables SERS analysis with more well-defined molecular interactions and thus improves the reproducibility of SERS signals. The maximum fluctuations from 20 positions of a same SERS substrate are less than 7% and from 20 different substrates in various batches are less than 8%. The high reproducibility of the enhanced Raman signals can be attributed to the uniform morphology of AgNPs and multi-functions of graphene layer including metal-molecule isolation, surface adsorption, and fluorescence quenching. On the basis of the G/AgNPs, the adenosine SERS signals with high selectivity and reproducibility were detected in human serum. Adenosine is the metabolite of adenine nucleotides, which has been regarded as one of the major neuromodulators. As the core molecule of nucleic acids, adenosine forms a unique link among cell energy, gene regulation, and neuronal excitability.30 The successful detection of adenosine in human serum indicated that the G/AgNPs have great potential for detecting other analytes in real biological systems.
Experimental
Materials and instruments
R6G and adenosine were purchased from Aladdin Industrial Corp. Ltd (Shanghai, China) as test samples. Human serum was purchased from Sigma-Aldrich Corp. Ltd (Shanghai, China) for the feasibility test of G/AgNPs substrates. The morphologies of AgNPs were characterized by scanning electron microscopy (SEM, ZEISS, SUPRATM-55). The crystal structure of AgNPs was characterized by X-ray diffraction (XRD, Rigaku D/MAX-RB). X-ray photoelectron spectroscopy (XPS) was carried out on a VG ESCA Lab-250 using Al Kα X-rays as the excitation source. The transmission electron microscopy (TEM) images were obtained by a transmission electron microscope system (JEOL JEM-2100). For TEM analysis, the samples were immersed into the mixed solution of HNO3 and HF in water (1![[thin space (1/6-em)]](https://www.rsc.org/images/entities/char_2009.gif) :
:![[thin space (1/6-em)]](https://www.rsc.org/images/entities/char_2009.gif) 2
2![[thin space (1/6-em)]](https://www.rsc.org/images/entities/char_2009.gif) :
:![[thin space (1/6-em)]](https://www.rsc.org/images/entities/char_2009.gif) 5, v/v) for 50 min. The AgNPs were corroded away and graphene film was liberated from the quartz substrates. The SERS experiments and the graphene characterization were carried out in a Raman Spectrometer (Horiba HR-800) with laser excitation at 532 nm.
5, v/v) for 50 min. The AgNPs were corroded away and graphene film was liberated from the quartz substrates. The SERS experiments and the graphene characterization were carried out in a Raman Spectrometer (Horiba HR-800) with laser excitation at 532 nm.
Preparation of G/AgNPs
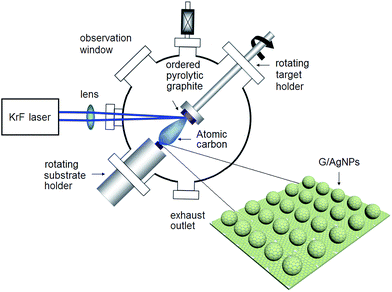
The commercial experimental setup called laser molecular beam epitaxy (LMBE) for G/AgNPs fabrication is shown in Fig. 1. It consists of two major components: one is an external laser source and another is a stainless steal vacuum chamber. Inside the chamber, a target and a substrate holder are aligned on the same line with a distance of 5 cm. The substrate holder can provide high temperature up to 800 °C. When the incident laser beam bombards the rotating target, the high-energy laser causes localized vaporization of the material, forming energetic atomic species. These species subsequently fly toward the substrate and finally evolve into film at the high temperature provided by the substrate holder. G/AgNP substrates were fabricated by a two-step procedure. The first step is to fabricate AgNPs by a deposition and a following annealing procedure. The Ag target (99.999%) with dimensions 5 cm × 4 cm × 0.3 cm was initially cleaned by laser ablation for 2 min under vacuum conditions to remove the surface contaminants. Then the Ag target was irradiated by the excimer KrF pulsed laser with a wavelength of 248 nm in high vacuum with a base pressure of 10−7 mbar. The laser fluence was 1.5 J cm−2 and the repetition was 10 Hz. The quartz substrates (100) were fixed on the substrate holder of 300 °C for Ag atoms deposition. The thickness of Ag film was monitored by SQM 180 thickness gauge and was controlled to ∼10 nm. The whole deposition process was 5 min with a low growing rate of ∼2 nm min−1. After deposition, the Ag film was in situ annealed for 10 min and formed the AgNPs. The second step is to fabricate graphene shell on AgNPs by ablation of an ordered pyrolytic graphite target using the KrF laser (pulse width = 25 ns, repetition rate = 5 Hz). The deposition chamber was evacuated to a base pressure of less than 10−7 mbar and the graphene films were grown in high purity (5 N) argon gas of 10 Pa. The typical graphene growth was carried out using laser fluence of 4 J cm−2 and growth temperature of 700 °C. After ablation the ordered pyrolytic graphite for 90 s, the atomic graphene layer was directly grown on the AgNPs, forming the hybrid structure of G/AgNPs.SERS experiments
SERS experiments were carried out using a Raman system with laser excitation at 532 nm. The excitation laser spot was about 1 μm, and the effective power of the laser source was kept at 0.05 mW for R6G molecules, and 0.25 mW for adenosine molecules. The system was connected to a microscope, and the laser light was coupled through an objective lens of 20×, which was used for exciting the samples as well as collecting the Raman signals. Prior to each Raman experiment, calibration of the instrument was done with the Raman signal from a silicon standard centered at 520 cm−1. SERS substrates were incubated for 3 h in different analyte solutions and then were placed into a vacuum drying oven to evaporate any moisture. The substrates were taken out and fixed onto the glass slide for SERS measurements. The SERS measurements were performed from at least 8 random locations that were more than 3 mm apart with an accumulation time of 10 s. If there is no special instruction, the mentioned Raman spectra are expressed in terms of average spectra.Results and discussion
Characterization of G/AgNPs
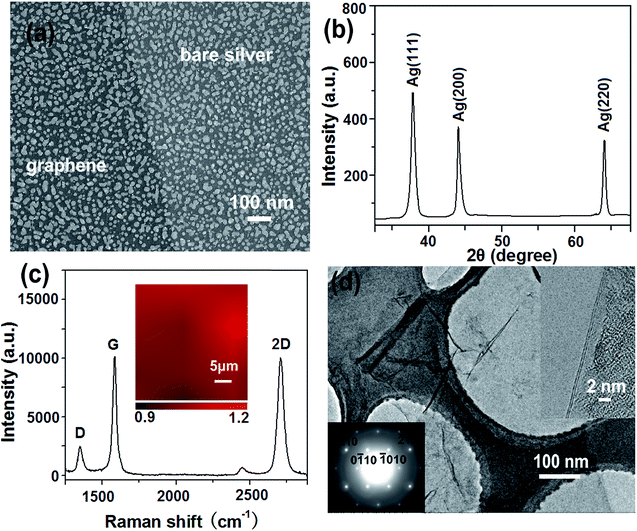
Fig. 2a shows a typical SEM image of G/AgNPs. The AgNPs were uniformly distributed on quartz substrate and their sizes are in the range of 10 to 30 nm. A clear boundary was formed by covering the parts of the AgNPs during the carbon species deposition process. Although the SEM image shows high color contrast between the graphene-veiled and bare silver regions, the SEM morphology of silver nanoislands in the regions with and without graphene layer is similar. Fig. 2b shows the XRD pattern of G/AgNP substrate. The typical peaks of diffraction peaks of Ag (111), Ag (220) and Ag (220) are observed.31,32 All the peaks are sharp and clear, indicating the well developed crystallinity of AgNPs. Probably due to the unique structure of single atom layer, the graphene signal was not detected. The sample morphology and the evidence of graphene are further characterized by Raman spectroscopy and TEM. A conventional Raman measurement was performed on the samples to demonstrate the existence of graphene. As shown in Fig. 3c, the typical peaks of D, G and 2D graphene are clearly observed at ∼1360, ∼1580 and ∼2695 cm−1, respectively. These peaks can be regarded as the fingerprint of graphene.33,34 The Raman spectrum displays a comparable intensity relationship between 2D and G, corresponding to bilayer graphene.35,36 To evaluate the uniformity of graphene, Raman mapping of 2D-peak to G-peak of graphene on AgNP substrates were implemented over 30 μm × 30 μm area as shown in the inset of Fig. 2c. From the color scale in the inset, the intensity ratios of 2D-peak to G-peak (I2D/IG) show a very small fluctuation from 0.9 to 1.2, indicating that the graphene have a uniform structure even in a large area. These results demonstrate that the graphene film with a bilayer structure is actually grown on AgNPs. Fig. 2d shows the bright-field TEM image of graphene. The extra-thin film structure of graphene was clearly observed. Some folds were formed on the central parts of the graphene. Such folds can provide a clear TEM signature for the number of graphene layers by direct visualization. To confirm the exact layer number of the samples, we observed their folded regions by using an electron beam parallel to them at various positions on graphene sheets. Almost all the folds exhibit the feature of two dark lines (top left inset), indicating bilayer graphene.37,38 The typical six-fold symmetry patterns of graphene are also observed by selected-area electron diffraction (SAED) (bottom right inset). The SAED patterns show typical hexagonally symmetrical patterns with a ratio of I{1100}/I{2110} < 1, revealing the nice crystallinity and disordered A-B stacking structure of bilayer-graphene.37 The thickness of the graphene shell, very detailed structural information of a nearby interface was captured by cross section HRTEM image of G/AgNPs (Fig. S1†). The Ag particles are covered by an ultrathin film of about 0.34 or 0.68 nm in thickness, indicative of monolayer or bilayer graphene. XPS was also used to further characterize the G/AgNPs hybrids (Fig. S2†). The C1s XPS of G/AgNPs (Fig. S2a†) clearly indicates the presence of graphene. The main peak at 284.4 eV indicates the formation of a sp2 C–C network for the grown film.39 The discernible tail at 285.6 eV is assigned to the hydroxyl carbon C–O.40 Ag3d peak for G/AgNPs hybrids as shown in Fig. S2b† could be detected and the binding energies of 3d3/2 and 3d5/2 electrons for Ag were identified to be 374.06 and 368.06 eV, respectively. The spin–orbit splitting of doublet components for Ag 3d5/2 and Ag 3d3/2 was measured to be 6 eV, indicating the presence of Ag0 in the hybrids.41SERS activity of G/AgNPs
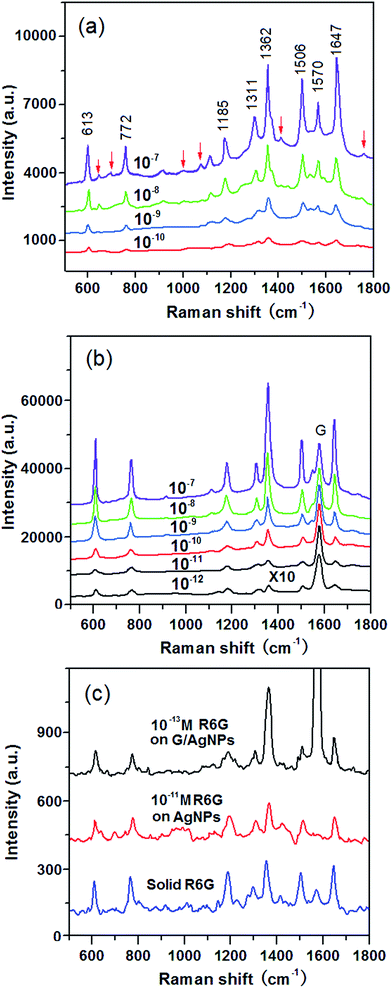
To verify the SERS activity of G/AgNP substrates, we compared the performance of G/AgNP substrates with that of AgNP substrates. By maintaining the same measurement conditions, the R6G aqueous solutions with varied concentrations were used as the probe molecule. Fig. 3a shows the SERS spectra of R6G molecules from AgNP substrates with various concentrations of 10−7, 10−8, 10−9, 10−10 M, respectively. The Raman peaks at 613, 772, 1185, 1311, 1362, 1506, 1570 and 1647 cm−1 are in good agreement with previous reports for R6G.42,43 Beside of characteristic peaks of R6G, some additional weak peaks (spurious signals) are also observed as marked by red arrows. These additional peaks are difficult to be assigned precisely, which can be attributed to the various possible interactions between AgNPs and the R6G molecules. The quality of SERS signals in terms of sensitivity and signal-to-noise ratio was improved on the G/AgNP substrates. As shown in Fig. 3b, the additional weak peaks and fluorescence background in the SERS spectra are obviously reduced and the characteristic signals of R6G are still visible at 10−12 M. The lowest detected concentration of 10−13 M is obtained as shown in Fig. 3c are still visible at 10−12 M. The lowest detected concentration of 10−13 M is obtained as shown in Fig. 3c. Because of the additional graphene layer, the R6G molecules are isolated from AgNPs and the spurious SERS signals from various possible metal–molecule interactions are thus reduced. The reduction of fluorescence background can be explained by the fluorescence quenching effect of graphene. This effect is basically due to a resonance energy transfer process from dye molecules to graphene as reported from Swathi et al.44 The G peaks of graphene are also clearly observed, which are nearly independent of the concentrations of R6G. The SERS enhancement factors (EF) for R6G on the G/AgNP substrates were calculated according to the standard equation:45–47
 | (1) |
Reproducibility and stability of the G/AgNP substrates
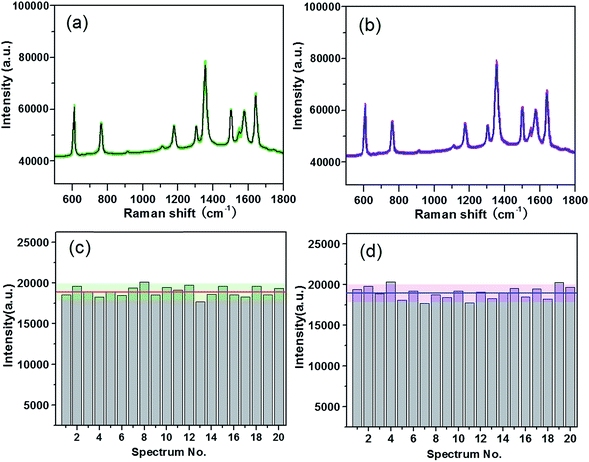
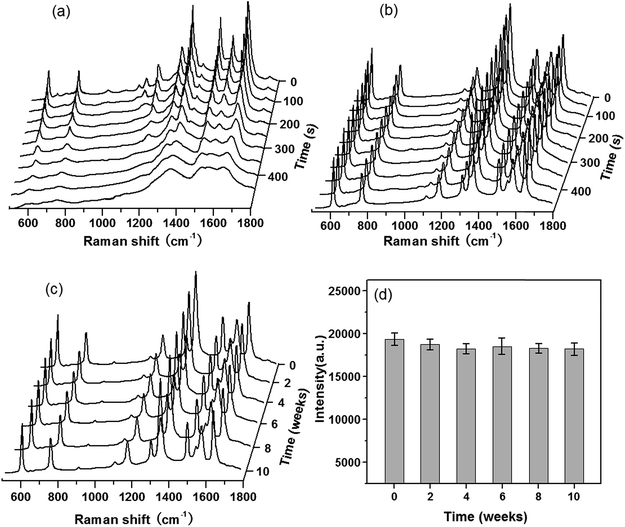
Besides the high enhancement activity, what we also concerned is to obtain high reproducible SERS signal in millimeter-scale range or even from the SERS substrates in different batches for practical application.52 The reproducibility of the SERS signals collected from random locations spacing more than 3 mm apart and from different substrates in various batches was evaluated. Fig. 4a shows the SERS spectra of R6G molecules at 10−7 M from 20 positions in a same G/AgNP substrate. These spectrum signals overlap to form a shaded area as filled with green. The black curve in the green shaded area is the average SERS spectrum of the 20 spectra of R6G molecules. The narrow shaded area (green color) indicates that the fluctuations of SERS signals for various vibration modes are all very small. The maximum intensity deviation of the SERS spectra with respect to the average intensity is given by the formula:
 | (2) |
| Peak position (cm−1) | From different positions on the same substrate | From different substrates in various batches | ||||
|---|---|---|---|---|---|---|
| Ī (counts) | ΔI (counts) | D (%) | Ī (counts) | ΔI (counts) | D (%) | |
| 613 | 19![[thin space (1/6-em)]](https://www.rsc.org/images/entities/char_2009.gif) 129 129 |
1000.4 | 5.23 | 19![[thin space (1/6-em)]](https://www.rsc.org/images/entities/char_2009.gif) 305 305 |
1088.1 | 5.64 |
| 772 | 11![[thin space (1/6-em)]](https://www.rsc.org/images/entities/char_2009.gif) 688 688 |
561.6 | 4.80 | 12![[thin space (1/6-em)]](https://www.rsc.org/images/entities/char_2009.gif) 039 039 |
702.0 | 5.80 |
| 1185 | 8845 | 596.7 | 6.75 | 8775 | 676.9 | 7.71 |
| 1362 | 31![[thin space (1/6-em)]](https://www.rsc.org/images/entities/char_2009.gif) 590 590 |
1930.5 | 6.11 | 31![[thin space (1/6-em)]](https://www.rsc.org/images/entities/char_2009.gif) 239 239 |
2106.1 | 6.74 |
| 1506 | 13![[thin space (1/6-em)]](https://www.rsc.org/images/entities/char_2009.gif) 514 514 |
572.1 | 4.23 | 13![[thin space (1/6-em)]](https://www.rsc.org/images/entities/char_2009.gif) 689 689 |
9023.5 | 6.75 |
| G | 12![[thin space (1/6-em)]](https://www.rsc.org/images/entities/char_2009.gif) 110 110 |
509.0 | 4.20 | 12![[thin space (1/6-em)]](https://www.rsc.org/images/entities/char_2009.gif) 285 285 |
544.3 | 4.43 |
| 1647 | 21![[thin space (1/6-em)]](https://www.rsc.org/images/entities/char_2009.gif) 832 832 |
1404.0 | 6.43 | 21![[thin space (1/6-em)]](https://www.rsc.org/images/entities/char_2009.gif) 762 762 |
1579.5 | 7.26 |
Practical applicability of the G/AgNP substrates
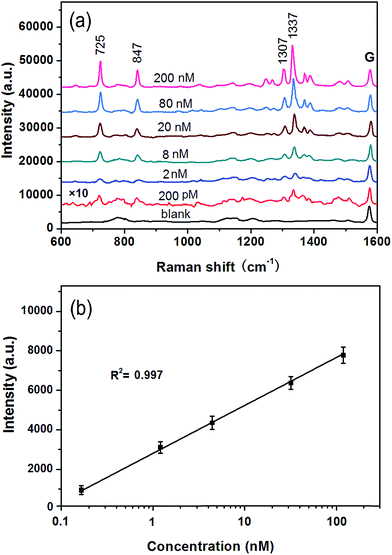
To investigate the feasibility of the G/AgNP substrates in practical application, the adenosine from 200 pM to 200 nM added to the diluted human serum (one percent of serum in water) was measured. The SERS spectra of adenosine in different concentrations in diluted serum are illustrated in Fig. 6a. Many peaks at about 725, 847, 1307 and 1337 cm−1 are observed. These peaks are all belong to adenosine according to the reported literatures.53–55 The intensities of the SERS spectra of adenosine are proportional to the concentration of the adenosine in diluted serum. There are only a few weak additional peaks in the spectrum derived from blank serum (black curve in Fig. 6a). The lowest detected concentration of adenosine in serum is 200 pM as shown in red curve in Fig. 6a. To show the capability of the quantitative detection of adenosine in serum and its reproducibility, the linear fit calibration curve (R2 = 0.997) with error bars is illustrated in Fig. 6b. The good linear response of SERS is obtained from 2 to 200 nM. According to the error bars, the maximum deviation was calculated to be about 5.5% with respect to the concentration at 200 nM. The small deviation further conform the good reproducibility of the G/AgNP substrates. The ignorable protein background and the good line correlation indicate a great potential application of the G/AgNP substrates to detect other analytes in real biological systems.The high selectivity for adenosine with respect to the complicated protein matrices in human serum is compelling. Because of the finite number of SERS-active sites, the competition for surface active sites is a very real concern. Compared to the complicated protein matrices in human serum, adenosine is a kind of small molecule and it can be more readily absorbed on the narrow gaps of Ag nanoparticles (hot spots) and thus more sensitive Raman signals are obtained. On the other hand, because of the heterocyclic aromatic structure of adenosine, the π–π interactions of graphene–adenosine can serve as a strong driving force to bring adenosine in close proximity to hot spot of G/AgNP substrates,51 which can be another important factor for the high selectivity of adenosine.
Conclusions
We have presented a kind of SERS-active substrate based on the hybrid structure of graphene and AgNPs by directly growing graphene on AgNP substrates. By the virtue of good plasmatic properties of AgNP substrates and unique physical/chemical properties of graphene, the G/AgNP substrates show high performance in terms of sensitivity, signal-to-noise ratio and reproducibility. Using R6G molecules as a probe, the G/AgNP substrates display excellent SERS activity with a minimum detected concentration of 10−13 M. The maximum deviations of SERS intensities from 20 positions of one SERS substrate are less than 7% and from 20 different substrates in various batches are less than 8%. On the basis of the G/AgNP substrates, a good linear relationship between SERS peak intensity and adenosine concentration is obtained in a range from 2 to 200 nM. This work may offer a novel and practical method to facilitate biosensing applications.Acknowledgements
The authors are grateful for financial support from the Shandong Province Natural Science Foundation (ZR2014FQ032), the funding from the Taishan Scholars Program of Shandong province, and National Natural Science Foundation of China (61205174).Notes and references
- A. Barhoumi and N. J. Halas, J. Am. Chem. Soc., 2010, 132, 12792–12793 CrossRef CAS PubMed.
- K. Lee, V. P. Drachev and J. Irudayaraj, ACS Nano, 2011, 5, 2109–2117 CrossRef CAS PubMed.
- G. B. Jung, Y. M. Bae, Y. J. Lee, S. H. Ryu and H. K. Park, Appl. Surf. Sci., 2013, 282, 161–164 CrossRef CAS PubMed.
- A. Campion and P. Kambhampati, Chem. Soc. Rev., 1998, 27, 241–250 RSC.
- D. Cialla, A. März, R. Böhme, F. Theil, K. Weber, M. Schmitt and J. Popp, Anal. Bioanal. Chem., 2012, 403, 27–54 CrossRef CAS PubMed.
- J. P. Singh, H. Chu, J. Abell, R. A. Tripp and Y. Zhao, Nanoscale, 2012, 4, 3410–3414 RSC.
- F. Bonaccorso, Z. Sun, T. Hasan and A. C. Ferrari, Nat. Photonics, 2010, 4, 611–622 CrossRef CAS PubMed.
- C. Mu, J. P. Zhang and D. Xu, Nanotechnology, 2010, 21, 015604 CrossRef PubMed.
- A. Eshkeiti, B. B. Narakathu, A. S. G. Reddy, A. Moorthi, M. Z. Atashbar, E. Rebrosova, E. Rebrosova, M. Rebros and M. Joyce, Sens. Actuators, B, 2012, 171, 705–711 CrossRef PubMed.
- S. Emamian, A. Eshkeiti, B. B. Narakathu, S. G. R. Avuthu and M. Z. Atashbar, Sens. Actuators, B, 2015, 217, 129–135 CrossRef CAS PubMed.
- J. M. Romo-Herrera, R. A. Alvarez-Puebla and L. M. Liz-Marzán, Nanoscale, 2011, 3, 1304–1315 RSC.
- J. Krajczewski, K. Kołątaj and A. Kudelski, Chem. Phys. Lett., 2015, 625, 84–90 CrossRef CAS PubMed.
- L. Guerrini, I. Rodriguez-Loureiro, M. A. Correa-Duarte, Y. H. Lee, X. Y. Ling, F. J. G. de Abajo and R. A. Alvarez-Puebla, Nanoscale, 2014, 6, 8368–8375 RSC.
- W. Xu, J. Xiao, Y. Chen, Y. Chen, X. Ling and J. Zhang, Adv. Mater., 2013, 25, 928–933 CrossRef CAS PubMed.
- S. Yi, L. Sun, S. C. Lenaghan, Y. Wang, X. Chong, Z. Zhang and M. Zhang, RSC Adv., 2013, 3, 10139–10144 RSC.
- Y. Li, G. Duan, G. Liu and W. Cai, Chem. Soc. Rev., 2013, 42, 3614–3627 RSC.
- K. Sivashanmugan, J. D. Liao, B. H. Liu, C. K. Yao and S. C. Luo, Sens. Actuators, B, 2015, 207, 430–436 CrossRef CAS PubMed.
- H. W. Kang, J. Leem and H. J. Sung, RSC Adv., 2015, 5, 51–57 RSC.
- Y. He, X. Han, D. Chen, L. Kang, W. Jin, R. Qiang, X. Ping and Y. Du, RSC Adv., 2014, 4, 7202–7206 RSC.
- M. Potara, M. Baia, C. Farcau and S. Astilean, Nanotechnology, 2012, 23, 055501 CrossRef PubMed.
- J. Perumal, K. V. Kong, U. S. Dinish, R. M. Bakker and M. Olivo, RSC Adv., 2014, 4, 12995–13000 RSC.
- S. C. Luo, K. Sivashanmugan, J. D. Liao, C. K. Yao and H. C. Peng, Biosens. Bioelectron., 2014, 61, 232–240 CrossRef CAS PubMed.
- E. C. le Ru and P. G. Etchegoin, Principles of surface enhanced Raman spectroscopy: and related plasmonic effects, Elsevier, Amesterdam, 2009 Search PubMed.
- J. F. Li, Y. F. Huang, Y. Ding, Z. L. Yang, S. B. Li, X. S. Zhou, F. R. Fan, W. Zhang, Z. Y. Zhou, D. Y. Wu, B. Ren, Z. L. Wang and Z. Q. Tian, Nature, 2010, 464, 392–395 CrossRef CAS PubMed.
- K. S. Novoselov, A. K. Geim, S. V. Morozov, D. Jiang, Y. Zhang, S. V. Dubonos, I. V. Grigorieva and A. A. Firsov, Science, 2004, 306, 666–669 CrossRef CAS PubMed.
- A. K. Geim and K. S. Novoselov, Nat. Mater., 2007, 6, 183–191 CrossRef CAS PubMed.
- P. Wang, O. Liang, W. Zhang, T. Schroeder and Y. H. Xie, Adv. Mater., 2013, 25, 4918–4924 CrossRef CAS PubMed.
- X. Li, J. Li, X. Zhou, Y. Ma, Z. Zheng, X. Duan and Y. Qu, Carbon, 2014, 66, 713–719 CrossRef CAS PubMed.
- S. Chen, X. Li, Y. Zhao, L. Chang and J. Qi, Carbon, 2015, 81, 767–772 CrossRef CAS PubMed.
- C. G. Dulla and S. A. Masino, Physiologic and metabolic regulation of adenosine: mechanisms, Springer, New York 2013, pp. 87–107 Search PubMed.
- J. Chen, H. Bi, S. Sun, Y. Tang, W. Zhao, T. Lin, D. Wan, F. Huang, X. Zhou, X. Xie and M. Jiang, ACS Appl. Mater. Interfaces, 2013, 5, 1408–1413 CAS.
- S. C. Xu, B. Y. Man, S. Z. Jiang, M. Liu, C. Yang and C. Zhang, CrystEngComm, 2014, 16, 3532–3539 RSC.
- A. C. Ferrari, J. C. Meyer, V. Scardaci, C. Casiraghi, M. Lazzeri, F. Mauri, S. Piscanec, D. Jiang, K. S. Novoselov, S. Roth and A. K. Geim, Phys. Rev. Lett., 2006, 97, 187401 CrossRef CAS.
- S. C. Xu, B. Y. Man, S. Z. Jiang, C. S. Chen, C. Yang, M. Liu, X. G. Gao, Z. C. Sun and C. Zhang, Appl. Phys. Lett., 2013, 102, 151902 CrossRef PubMed.
- X. S. Li, W. W. Cai, J. An, S. Kim, J. Nah, D. X. Yang, R. Piner, A. Velamakanni, I. Jung, E. Tutuc, S. K. Banerjee, L. Colombo and R. S. Ruoff, Science, 2009, 324, 1312–1314 CrossRef CAS PubMed.
- S. C. Xu, B. Y. Man, S. Z. Jiang, C. S. Chen, C. Yang, M. Liu, X. G. Gao, Z. C. Sun and C. Zhang, CrystEngComm, 2013, 15, 1840–1844 RSC.
- J. C. Meyer, A. K. Geim, M. I. Katsnelson, K. S. Novoselov, T. J. Booth and S. Roth, Nature, 2007, 446, 60–63 CrossRef CAS PubMed.
- S. C. Xu, B. Y. Man, S. Z. Jiang, A. H. Liu, G. D. Hu, C. S. Chen, M. Liu, C. Yang, D. J. Feng and C. Zhang, Laser Phys. Lett., 2014, 11, 096001 CrossRef.
- P. Y. Teng, C. C. Lu, K. A. Hasegawa, Y. C. Lin, C. H. Yeh, K. Suenaga and P. W. Chiu, Nano Lett., 2012, 12, 1379–1384 CrossRef CAS PubMed.
- H. W. Tien, Y. L. Huang, S. Y. Yang, J. Y. Wang and C. C. M. Ma, Carbon, 2011, 49, 1550–1560 CrossRef CAS PubMed.
- S. Liu, J. Q. Tian, L. Wang and X. P. Sun, J. Nanopart. Res., 2011, 13, 4539–4548 CrossRef CAS.
- Y. Chen, G. Tian, K. Pan, C. Tian, J. Zhou, W. Zhou, Z. Ren and H. Fu, Dalton Trans., 2012, 41, 1020–1026 RSC.
- Y. K. Kim, S. W. Han and D. H. Min, ACS Appl. Mater. Interfaces, 2012, 4, 6545–6551 CAS.
- R. S. Swathi and K. L. Sebastian, J. Chem. Phys., 2009, 130, 086101 CrossRef CAS PubMed.
- E. C. le Ru, E. Blackie, M. Meyer and P. G. Etchegoin, J. Phys. Chem. C, 2007, 111, 13794–13803 CAS.
- Z. Huang, G. Meng, Q. Huang, B. Chen, C. Zhu and Z. Zhang, J. Raman Spectrosc., 2013, 44, 240–246 CrossRef CAS PubMed.
- L. Jin, G. She, X. Wang, L. Mu and W. Shi, Appl. Surf. Sci., 2014, 320, 591–595 CrossRef CAS PubMed.
- A. Hakonen, M. Svedendahl, R. Ogier, Z. J. Yang, K. Lodewijks, R. Verre, T. Shegai, P. O. Andersson and M. Käll, Nanoscale, 2015, 7, 9405–9410 RSC.
- Y. Du, Y. Zhao, Y. Qu, C. H. Chen, C. M. Chen, C. H. Chuang and Y. Zhu, J. Mater. Chem. C, 2014, 2, 4683–4691 RSC.
- X. Ling, L. Xie, Y. Fang, H. Xu, H. Zhang, J. Kong, M. S. Dresselhaus, J. Zhang and Z. Liu, Nano Lett., 2010, 10, 553–561 CrossRef CAS PubMed.
- W. Xu, N. Mao and J. Zhang, Small, 2013, 9, 1206–1224 CrossRef CAS PubMed.
- M. J. Natan, Faraday Discuss., 2006, 132, 321–328 RSC.
- G. L. Liu and L. P. Lee, Appl. Phys. Lett., 2005, 87, 074101 CrossRef PubMed.
- J. W. Chen, X. P. Liu, K. J. Feng, Y. Liang, J. H. Jiang, G. L. Shen and R. Q. Yu, Biosens. Bioelectron., 2008, 24, 66–71 CrossRef CAS PubMed.
- S. Xu, B. Man, S. Jiang, J. Wang, J. Wei, S. Xu, H. Liu, S. Gao, H. Liu, Z. Li, H. Li and H. Qiu, ACS Appl. Mater. Interfaces, 2015, 7, 10977–10987 CAS.
Footnote |
| † Electronic supplementary information (ESI) available: Additional XPS, HRTEM and the stability of SERS spectra over time on bare AgNP substrates is presented. See DOI: 10.1039/c5ra18333b |
| This journal is © The Royal Society of Chemistry 2015 |

