DOI:
10.1039/C5RA23678A
(Paper)
RSC Adv., 2015,
5, 104862-104869
Highly modified spontaneous emission in NaY(MoO4)2:Yb3+/Er3+ inverse opal photonic crystals†
Received
10th November 2015
, Accepted 1st December 2015
First published on 2nd December 2015
Abstract
The up-conversion luminescence (UCL) of rare earth (RE) ion doped nanomaterials has attracted extensive interest because of its wide and great potential application. However, the lower UCL efficiency due to the local thermal effect among the ions is still an obstacle for real application. Photonic modulation is a novel way to suppress the local thermal effect and cross relaxation. In this work, NaY(MoO4)2:Yb3+/Er3+ inverse opal photonic crystals (IOPCs) were fabricated through the poly methylmethacrylate (PMMA) template and the modification of the IOPC structure on the emission spectra and dynamic of Er3+ ions was systemically studied. It is interesting to observe that in the IOPCs, the high-order UCL 2H9/2 → 4I15/2 was relatively enhanced. At the same time, the local thermal effect induced by laser irradiation was suppressed. The studies on UCL dynamics indicated that the nonradiative transition rate of Er3+ was considerably suppressed. The facts above indicated that in the IOPCs, the UCL efficiency of Er3+ was improved due to the periodic macroporous structure.
1. Introduction
In recent years, nanocrystals (NCs) doped with trivalent lanthanide ions have attracted extensive attention because of their outstanding properties such as large Stokes shift, sharp emissions, and long luminescence lifetimes.1,2 Based on these outstanding properties, lanthanide ion doped NCs play an important role in biomedical applications, display devices, optical communications, spectral conversion of solar cells, etc.3–6 Among all the lanthanide ions doped NCs, up-conversion (UC) nanocrystals, which can convert a low frequency excitation photon into a high frequency emission photon through two-photon or multi-photon processes, have attracted increasing attention because of their intriguing properties, such as tunable multicolor emission, no autofluorescence from biological samples, a remarkable light penetration depth, and exceptional photostability.7–11 Yb3+/Er3+ co-activated fluorides (such as the NaYF4) have been paid more attention because Yb3+ has relatively strong absorption around 980 nm and the fluoride host matrix has relatively low phonon energy, which can suppress the quenching effect of the excited state of the lanthanide ions and consequently improve the efficiencies of their emission from the excited levels.12–14 It should be highlighted that some recent studies indicate that in some oxide compounds with relatively large phonon thresholds, Er3+/Yb3+ co-activated phosphors also demonstrate intense UC emissions.15 Actually, in UC phosphors, the existence of large phonons may also offer some novel population channels and may sometimes favor UCL.16
The microstructure of the host material is another key factor, which influences the photoluminescence of the doping ions.17,18 Photonic crystals (PCs), which is proposed by Yablonovitch and John in 1987, as a kind of materials with a periodically varying refractive index, have attracted intense efforts.19,20 The periodic electromagnetic modulation created by the PCs can yield a photonic stop band (PSB), a band of frequencies for which light propagation in the PCs is forbidden, and thus drastically alter the optical properties. Because of their ability to confine, control, and manipulate photons, PSB materials have demonstrated a wide variety of applications, for example, in miniature lasers, light-emitting diodes, biomarkers, and enhancing light harvesting efficiency of dye sensitized solar cells.21–26 Among these applications, one has such interesting physical issue is the modification of the spontaneous emission. Up to now, a number of works have been performed in the field, and some interesting phenomenas have been observed such as the observation of the Lamb shift, inhibited long-scale energy transfer (ET) and local thermal effect, and improvement of the luminescent quantum yield in RE ions embedded PCs.27–31 Despite this, the work related to the modification of PCs on the UCL of embedded RE ions is still rare and further work should be performed to fabricate more UC PCs and deeply understand its unique physical nature.
Double molybdate crystals with the general formula ARE(MoO4)2 (A = Li+, Na+, K+, Cs+; RE = trivalent RE ions) have been regarded as promising materials, because double molybdates structure framework is composed of tetrahedral (MoO4)2−, the alkaline ions and rare-earth ions are distributed over the cation sites, the different cations with different radii in the host compound would arouse some change in the sub-lattice structure around the luminescent center ions and then result in different photoluminescent properties, which show high physical and chemical stability, strong water persistence.32,33 RE-doped ARE(MoO4)2 materials have been widely studied as attractive laser host materials due to their excellent chemical durability in air atmosphere, large admittance, and the large absorption and emission cross-sections of rare earth ions in their lattices.34 Moreover, the RE ions doped double molybdate phosphors have high brightness levels, long lifetimes, and the preparation method is easy and low-lost. It is implies that the RE-doped ARE(MoO4)2 materials can be widely used in catalysts, high-performance phosphors, up-conversion materials, negative thermal expansion materials and so forth.35–37 Hence, the ARE(MoO4)2 materials have received great attention, and the NaY(MoO4)2 phosphor is one of a typical in ARE2(MoO4)2 materials. Despite this, as is well known, work related to NaY(MoO4)2:Yb3+/Er3+ PCs has not been reported yet. It is necessary to study the optical properties of NaY(MoO4)2:Yb3+/Er3+ PCs. In this work, the three-dimensional (3D) inverse opal photonic crystals (IOPC), NaY(MoO4)2:Yb3+/Er3+ were fabricated by the PMMA template method. The modulated optical properties of the NaY(MoO4)2:Yb3+/Er3+ IOPC were carefully studied.
2. Experimental section
2.1 Sample preparation
All chemicals were of analytical grade and were used as received without further purification. All the lanthanide nitrates were purchased from the National Engineering Research Centre of Rare Earth Metallurgy and Function Materials. Sodium nitrate, ammonium metatungstate, methylmethacrylate (MMA), ethanol, and citric acid were received from Beijing Chemical Plant (Beijing, P. R. China).
NaY(MoO4)2:Yb3+/Er3+ IOPCs with the different PSBs and doping concentrations, were prepared by the sol–gel method with the PMMA latex sphere template technique. Firstly, monodisperse PMMA latex spheres with controllable sizes (∼315, 340, 390, 410 and 425 nm) were synthesized. Then, a thin-film template was self-assembled through the vertical deposition process. The colloid suspension of PMMA microspheres was dropped onto a glass substrate and placed in a 30 °C oven for 2 days. The PMMA colloidal spheres were slowly self-organized into highly ordered colloidal arrays on the glass substrate, driven by the surface tension of the liquid in the evaporating process. Following deposition, the opals were sintered for 40 min at 120 °C to enhance their physical strength. In the preparation of the NaY(MoO4)2:Yb3+/Er3+ precursor sol, stoichiometric amounts of Y(NO3)3·6H2O, Yb(NO3)3·6H2O, Er(NO3)3·6H2O, NaNO3 and (NH4)6Mo7O24·4H2O were dissolved in a 5 mL mixture solution of deionized water and ethanol (volume ratio of 1![[thin space (1/6-em)]](https://www.rsc.org/images/entities/char_2009.gif) :1). The mixed solution contained 500 mg citric acid and was used as the chelating agent. After stirring for 30 minutes, the prepared precursor solutions were used to infiltrate the voids of the opal template through capillary force. After infiltration, the resulting products were dried in air at room temperature for one day. A thermal treatment consists of a slow rising time of 300 min from room temperature to 600 °C and keeping at 600 °C for 3 hours. Samples prepared by the opal templates were constructed with PMMA microspheres of 315, 340, 390, 410 and 425 nm in diameter and were denoted as samples IOPC1 to IOPC5 respectively. For comparison, a corresponding reference sample (REF) was prepared by grinding the IOPC sample to destroy the regular 3D order structure.
:1). The mixed solution contained 500 mg citric acid and was used as the chelating agent. After stirring for 30 minutes, the prepared precursor solutions were used to infiltrate the voids of the opal template through capillary force. After infiltration, the resulting products were dried in air at room temperature for one day. A thermal treatment consists of a slow rising time of 300 min from room temperature to 600 °C and keeping at 600 °C for 3 hours. Samples prepared by the opal templates were constructed with PMMA microspheres of 315, 340, 390, 410 and 425 nm in diameter and were denoted as samples IOPC1 to IOPC5 respectively. For comparison, a corresponding reference sample (REF) was prepared by grinding the IOPC sample to destroy the regular 3D order structure.
2.2 Measurements
The morphology of the samples was measured with a JEOL JSM-7500 field emission scanning electron microscope (FE-SEM) at an accelerating voltage of 15 kV. The phase structure of the samples were characterized by an X-ray diffractometer using a monochromatized Cu target radiation resource (λ = 1.54 Å). The transmittance spectra were taken with a Shimadzu UV-1800 spectrophotometer. In the measurements of the UCL emission spectra, a continuous 980 nm wavelength was used to pump the samples. A visible photomultiplier (300–850 nm) were used for spectral collection in the range of 400–750 nm. In the measurement of luminescent dynamics, the samples were pumped by a laser-system consisting of a Nd:YAG pumping laser (1064 nm), a third-order Harmonic-Generator (355 nm), and a tunable optical parameter oscillator (OPO, Continuum Precision II 8000) with the pulse duration of 10 ns, repetition frequency of 10 Hz, and line width of 4–7 cm−1. The low-temperature emission spectra and dynamics were measured by placing the samples into a helium–gas cycling system, where the temperature varied from 10 to 400 K.
3. Results and discussion
3.1 Characterization
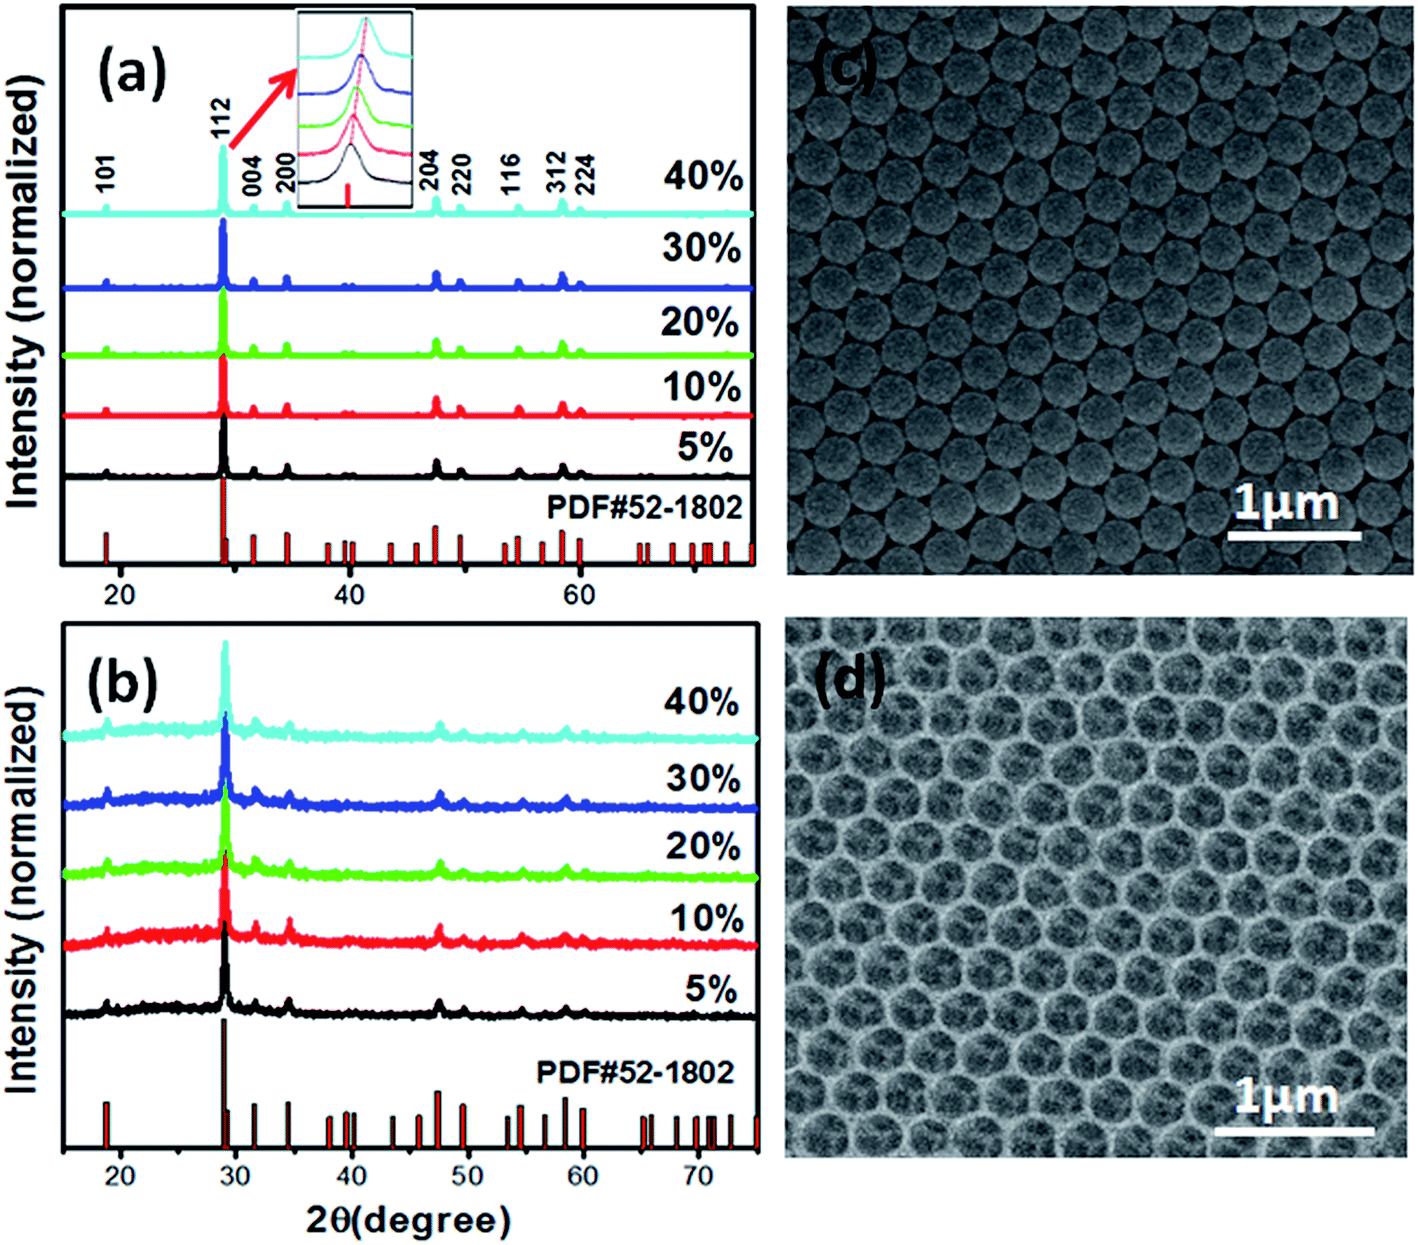
Firstly, the crystallinity and phase purity of the product were investigated by X-ray diffraction (XRD). The XRD patterns of the as-prepared inverse opals photonic crystals (IOPCs) and REF samples are exhibited in Fig. 1(a) and (b). It can be observed from the XRD patterns that all the diffraction peaks are indexed to the tetragonal phase structure of NaY(MoO4)2, which is in accordance with JCPDS card no. 52-1802, indicating that the prepared samples are phase pure and the doping ions do not change the phase pure of the samples. It is confirmed that all the samples are well crystallized. However, the inset of Fig. 1(a) shows a small difference among all the XRD patterns. Compared with the standard card, as the Yb3+ doping concentration increases from 5% to 40%, the main peak shifts to a slightly higher degree due to the ionic radius of the replaced Y3+ (0.893 Å) being bigger than the ionic radius of Yb3+ (0.858 Å). From the analysis of the XRD patterns, it can be concluded that the Yb3+ ions have been effectively doped into the NaY(MoO4)2 host lattices.
 |
| | Fig. 1 XRD patterns of NaY(MO4)2:xYb3+, 2% Er3+ (x = 5%, 10%, 20%, 30%, 40%) samples. (a) Reference (REF) samples, (b) inverse opal photonic crystals (IOPCs); (c) SEM image of the PMMA opal template sample; (d) SEM image of the IOPC sample. | |
The IOPC samples on the glass substrates can be tuned from blue to red, when observed in a vertical direction. As the direction of observation was changed, the color also gradually varied, indicating the formation of well-ordered IOPCs. The SEM images of the PCs were analyzed to determine the local structure and quality of the samples. Fig. 1(c) and (d) show the SEM images of the PMMA opal template and the IOPC sample. Fig. 1(c) shows that a long range original PMMA opal is formed, with a lattice period of 310 nm. Fig. 1(d) displays the top-view SEM image of the IOPC sample, a long range ordered hexagonal arrangement of inverse opal with a center-to-center distance of 290 nm, which is about 30% smaller than the original size of the PMMA template due to the shrinkage of spheres' diameters during calcination. Note that except for the center-to-center distances, the samples IOPC1, IOPC2, IOPC3, and IOPC5 are similar to IOPC4.
Fig. 2 shows the optical transmittance spectra of the IOPC samples when the incidence is vertical to the (111) plane. It can be obviously observed that the IOPCs have deep photonic bands centered at ∼426, 477, 507, 579 and 646 nm. It should be noted that the photonic stop bands of the corresponding PMMA opal PCs are centered at 707, 853, 930, 993, and 1102 nm, respectively. All of the opal PCs and IOPC samples present beautiful structural colors under normal indoor illumination. The photonic stop bands of IOPCs shift to the shorter wavelength side remarkably compared with the opals, which is due to a lower average refractive index caused by air spheres instead of polymer spheres and the shrinkage of the spheres' diameters during calcination. The inset of Fig. 2 shows the dependence of the location of the PSBs on the lattice constants of the NaY(MoO4)2:Yb3+/Er3+ IOPCs. Evidently, the location of the PSB demonstrates a linear relationship with the lattice constant and the linear slope is determined to be 1.72. Theoretically, the normal positions of the PSBs in face-centered-cubic (FCC) PCs can be estimated by Bragg's law of diffraction combined with Snell's law as follows:38
| |
 | (1) |
| | |
neff = xnNaY(MoO4)2 + (1 − x)nair,
| (2) |
where,
λ is the central wavelength of the PSB,
m is the order of the Bragg diffraction,
dhkl is the
hkl plane distance,
neff is the average refractive index,
nNaY(MO4)2 is the refractive index of NaY(MO
4)
2 (∼1.56),
nair is the refractive index of air,
x is the filling factor,
θ is the angle from the incident light to the normal of the substrate surface (
θ = 0°), and
D is the center-to-center distances of the neighboring hollow spheres. Based on the linear slope (1.73) in the inset of
Fig. 2 and
eqn (1), the practical
neff is determined to be 1.11. Furthermore, according to
eqn (2), air takes about 80% (
x = 0.2) of the space in the IOPC samples, which is less than the ideal condition (
x = 0.26). This is reasonable if the shrinkage process of the lattice constants is taken into account.
 |
| | Fig. 2 The transmittance spectra of the NaY(MO4)2:20% Yb3+, 2% Er3+ IOPC measured at the normal (θ = 0°) direction. Inset: dependence of the center-to-center distances on the PSB positions. | |
3.2 Concentration-dependent UCL of Er3+ ions
The UCL properties of the doped UC nanocrystals depend strongly on the concentration of the doping ions of the activator and the sensitizer. In order to reveal the concentration-dependent UCL properties and obtain the optimum concentration of doping ions in the NaY(MO4)2 host lattices, the Er3+ and Yb3+ concentration-dependent UCL spectra of NaY(MO4)2 samples are shown in Fig. 3(a–d). It can be seen from Fig. 3(a) that there are two dominant emission lines, located at 533 nm and 558 nm, which are assigned to the 2H11/2 → 4I15/2 and 4S3/2 → 4I15/2 transitions, respectively. Moreover, there is another UC emission line peaking at 660 nm, which comes from the 4F9/2 → 4I15/2 transition.39 As shown in Fig. 3, the intensity ratio of the 4F9/2 → 4I15/2 to the 2H11/2 + 4S3/2 → 4I15/2 transition varies greatly with doping concentration of the Yb3+ and Er3+ ions. It can be seen from Fig. 3(a) that, as the concentration of Yb3+ is fixed at 20%, and Er3+ concentration increases from 0.5% to 4% in molar ratio, the ratio of 4F9/2 → 4I15/2 to the 2H11/2 + 4S3/2 → 4I15/2 transition gradually increases, and this phenomenon can be attributed to the improved 4F7/2 + 4I11/2 → 4F9/2 + 4F9/2 cross relaxation process between nearby Er3+ ions and local thermal effect. Fig. 3(c) and (d) demonstrate that the UCL intensity of the multiple emissions can be tuned by controlling the Yb3+ concentration. It can be seen that when the Yb3+ ions concentration changes from 5% to 40%, the UCL emissions vary quickly, this typical experimental result is due to the efficient ET energy processes from Yb3+ to Er3+, moreover, the relative emission intensity ratio of the 2H11/2 → 4I15/2 to the 4S3/2 → 4I15/2 transition also changes. As the Er3+ ions concentration is fixed at 2%, and the Yb3+ ions concentration changes from 5% to 40%, the intensity ratio of the 2H11/2 → 4I15/2 to the 4S3/2 → 4I15/2 transition gradually increase, this phenomenon can be attributed to the local thermal effect. Based on the well-known thermal activation equation, RHS = RHS(0)exp−ΔE/kT, the intensity ratio of the 2H11/2 → 4I15/2 to the 4S3/2 → 4I15/2 is proportional to the sample temperature. The temperature of the samples will rise with increasing the Yb3+ ions concentration. It is reasonable that the intensity ratio of the 2H11/2 → 4I15/2 to the 4S3/2 → 4I15/2 transition gradually increases as the Yb3+ ions concentration changes from 5% to 40%. However, the intensity ratio of the 2H11/2 → 4I15/2 to the 4S3/2 → 4I15/2 transition changes slightly in IOPC samples due to better thermal diffusion of the sample. Similar results were also observed in the other IOPC samples, which indicated that the inhibited local thermal is induced by three-dimensional ordered porous structure of PCs, rather than overlapping effect between PSB and UC emission.40 The UCL integral emission intensity plotted with different doping concentration of Yb3+ and Er3+ ions are shown in Fig. 4(a) and (b). Evidently, with increasing the Yb3+ and Er3+ ions concentration, the luminescent intensities of UCL in the REF and IOPC samples both increase at the beginning and approach a maximum at 2% Er3+ concentration or 20% Yb3+ concentration in the REF samples and 3% Er3+ concentration or 20% Yb3+ concentration in the IOPC samples, and then decrease. Moreover, in the IOPC samples, the UCL intensity decreases more slowly when the Yb3+ or Er3+ ions concentration further increases. This suggests that in the IOPC samples, the concentration quenching effect was considerably suppressed. Similar results were also observed in the IOPC samples such as NaY(MO4)2:Tb3+, Eu3+ and LaPO4:Ce3+ and Tb3+.41,42 It is suggested that in the IOPCs because the IOPCs layers consist of small nanoparticles with sizes of 10–20 nm, the long scale ET among the RE ions are suppressed due to the boundary effect. As is well known, the concentration quenching effect originates from the ET from luminescent centers to defect states. In the IOPCs, this ET path is also blocked, leading to the suppressed concentration quenching.
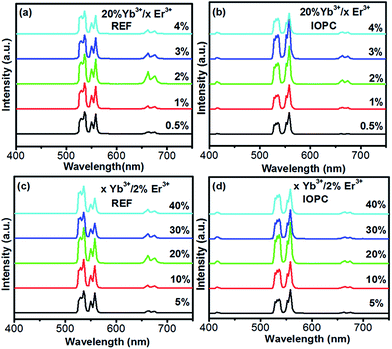 |
| | Fig. 3 The UCL emission spectra of the NaY(MO4)2:Yb3+, Er3+ samples under the same 980 nm NIR excitation power density. (a) The REF and (b) IOPC samples with the changed doped concentration of Er3+ from 0.5% to 4%. (c) The REF and (d) IOPC samples with the different Yb3+ doped concentration from 5% to 40%. | |
 |
| | Fig. 4 Dependence of UCL emission integrated intensity on different Yb3+ and Er3+ doping concentrations in IOPC and REF samples. | |
In the IOPC and REF samples, the relative intensity of the UCL for any transition changes largely. Fig. 5 displays a comparison for the normalized UCL spectra between the IOPCs and the REF samples under the same conditions. It is interesting to observe that in the IOPC sample the intensity ratio of the 2H11/2 → 4I15/2 to the 4S3/2 → 4I15/2 transition decreases remarkably compared to the REF sample as well as the 4F9/2 → 4I15/2 to the 2H11/2 + 4S3/2 → 4I15/2 transition. It can be concluded that under the excitation of the 980 nm light with the same power density, the IOPC sample has a lower temperature increase. This indicates that the IOPC structure can suppress the local thermal effect induced by laser irradiation, which is attributed to its better thermal diffusion property due to the empty cavity structure. Moreover, the 2H9/2 → 4I15/2 (three-photon population, 415 nm) is also observed in the IOPC but not in the REF sample. This suggests that the IOPC structure is helpful of the occurrence of high-order UCL. This could be explained by the effective suppression of the temperature quenching and local thermal effect due to the thin layer structure and connected air cavity in the IOPCs.
 |
| | Fig. 5 The typical UCL spectra of the IOPC and REF samples with the doping concentration of 20% Yb3+/2% Er3+. | |
In order to better understand the UC processes of Yb3+, Er3+ coped phosphors, Fig. 6 describes the energy level diagrams of Yb3+ and Er3+ and the possible up-conversion population processes of the Yb3+, Er3+ co-doped samples under 980 nm excitation. In the Yb3+, Er3+ co-doped systems, Yb3+ acts as the sensitizer that absorbs the 980 nm NIR light and successively transfers energy to Er3+, the population of 4F7/2, 4F9/2 comes from two-step ET process, the population of 2H9/2 is from three-step ET process. Moreover, some cross relaxation channels may also have great contribution to the UC population, particularly in the case of heavy doping of Er3+ and Yb3+ ions.
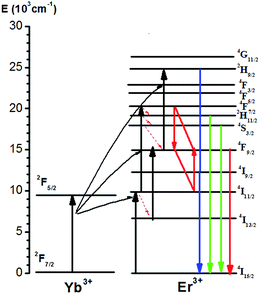 |
| | Fig. 6 The energy–level diagram of Yb3+, Er3+ co-doped crystalline and population processes under 980 nm excitation. | |
As excitation power density is too strong, local thermal effect induced by laser exposure and the corresponding UCL quenching usually happens for UC phosphors. Here, we highlight that in the UCL of NaY(MO4)2:Yb3+, Er3+ IOPCs, the local thermal effect can be suppressed considerably. For any mechanism, the visible output intensity (IV) is proportional to some power (n) of the infrared excitation (IIR) power: IV ∝ IIRn, where the value of n presents the number of IR photons absorbed per visible photon emitted. However, the saturation effect will induce n to deviate from the required photon number, depending on the competition between linear decay and UC processes for the depletion of the intermediate excited states. Fig. 7 shows UCL intensity of the green and red emissions as a function of excitation powder in REF and IOPC samples. It is observed that the slopes in the REF samples are lower than the IOPC samples for green and red emissions. And more, in the IOPC samples the UCL intensity increased continuously in the studied power range, while in the REF samples, the quenching of UCL was observed at a certain power density. It can be mainly attributed to the improved saturation effect and local thermal effect induced by laser exposure.43 The fact above indicates that the IOPCs is a very helpful device for the improvement of UCL and its nature is due to thin layer structure and connected air cavity, which is useful of thermal diffusion.
 |
| | Fig. 7 Ln–Ln plots of the (a) 4S3/2 → 4I15/2, (b) 4F9/2 → 4I15/2 emission intensity versus excitation power in NaY(MO4)2:20% Yb3+, 2% Er3+ IOPC and REF samples. | |
3.3 UCL dynamics
The electron transition processes could be further revealed by the luminescent dynamics of the excited states. The temporal evolution of the UCL for the excited states exhibits the same behavior in the IOPC and REF samples, as shown in Fig. S1† (2H11/2 → 4I15/2 transition in NaY(MoO4)2:20% Yb3+/xEr3+) and S2 (2H11/2 → 4I15/2 transition in NaY(MoO4)2:xYb3+/2% Er3+). The luminescent intensity rises quickly at the beginning until it reaches a maximum and then decays following a non-exponential process due to the ET and cross relaxation process. The curves can be well fitted by the following luminescent dynamical equation:44| | |
It = I1e−τdecayt − I2e−τriset,
| (3) |
where τdecay and τrise represent the decay and rising rate constants, respectively, and I1 and I2 are both the positive intensity constants. τrise depends strongly on the ET rate from Yb3+ to Er3+ and the decay time constant of Yb3+.
The time constants of rise and decay for the transition of 2H11/2 → 4I15/2 in the IOPC and REF samples with the different Yb3+ and Er3+ doping concentration are calculated and listed in Table 1. It can be observed that τrise and τdecay in all of the IOPC and REF samples decrease rapidly when the Er3+ ion and Yb3+ ion concentration increases. As the Yb3+ or Er3+ concentration increases, on the one hand, the decreased average interaction distance leads to more effective ET from Yb3+ to Er3+, resulting in a shorter τrise. On the other hand, the populations of Er3+ on the 2H11/2 and the others excited states increase largely, which results in the shortened τdecay.
Table 1 The variation of the rise and decay time constants of the 2H11/2 → 4I15/2 transition with different Yb3+ and Er3+ concentrations in the as-prepared NaY(MoO4)2:Yb3+/Er3+ IOPCs and REF samples
| Yb concentration (mol%) |
|
5% |
10% |
20% |
30% |
40% |
| IOPC |
τrise (μs) |
113 |
57 |
32 |
25 |
16 |
| τdecay (μs) |
396 |
220 |
107 |
76 |
45 |
| Ref. |
τrise (μs) |
150 |
72 |
40 |
33 |
22 |
| τdecay (μs) |
221 |
122 |
72 |
53 |
42 |
| Er concentration (mol%) |
|
0.5 |
1 |
2 |
3 |
4 |
| IOPC |
τrise (μs) |
62 |
46 |
32 |
27 |
12 |
| τdecay (μs) |
165 |
127 |
107 |
73 |
49 |
| Ref. |
τrise (μs) |
76 |
52 |
40 |
32 |
20 |
| τdecay (μs) |
113 |
86 |
72 |
60 |
42 |
Curves for the inverse of the fluorescence lifetime constants of the 2H11/2 → 4I15/2 of Er3+ versus Er3+ concentrations in the IOPC and REF samples are shown in Fig. 8. It can be seen that the inverse of the fluorescence lifetime increased linearly with the increasing concentration of Er3+ ions. This phenomenon demonstrates not only the existence of ET from Yb3+ or Er3+, but also the difference between IOPCs and REF samples. The experimental dots can be fitted with the following function:
where
k is the total electronic transition rate of Er
3+, including the radiative and nonradiative transitions, and
kET is the average energy transfer rate among Er
3+ ions, [Er
3+] is the concentration of Er
3+. Through fitting,
k was deduced to be 3.8 m s
−1 in the IOPCs and 6.5 m s
−1 in the REF.
kET was deduced to be 5.1 m s
−1 mol
−1 in the IOPCs and 5.4 m s
−1 mol
−1 in the REF. This further indicates that in the electronic transition rate of Er
3+ on
2H
11/2 in the IOPC samples decreases largely, which can be attributed to the modulation of the effective index on the radiative transition rate from
2H
11/2 and the evident decrease of the nonradiative transition rate in the IOPC samples, which can be proven by the temperature-dependent luminescent dynamics.
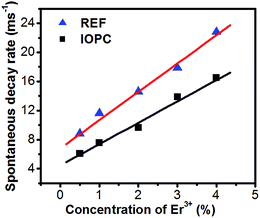 |
| | Fig. 8 The changed reciprocal of fluorescence lifetime of the 2H11/2 → 4I15/2 transition with different Er3+ concentration in the IOPC and REF samples. | |
4. Temperature-dependent emission spectra and dynamics
To further reveal the temperature quenching of the emission intensity, the UCL emission intensity of Er3+ ions as a function of temperature in the IOPCs and REF samples under 980 nm excitation is displayed in Fig. 9. It can be seen that, following the increase of temperature (above 50 K), a rapid decrease of UCL intensity in the REF samples was observed, whereas the UCL changed slowly with the elevated temperature in the IOPCs. This indicates that the temperature-quenching of Er3+ UCL can be suppressed considerably in the IOPCs. It is suggested that in traditional phosphors the quenching of UCL occurs due to the energy transfer (ET) from luminescent centers to defect states, which randomly distributes in the lattices of the phosphors. This process is strongly dependent on temperature. In the IOPCs, the significant ET should be restrained largely because of thin thickness of each NaY(MO4)2:Yb3+, Er3+ layer and the existence of long periodic and connected air cavities between the two layers. In this case, the ET among the Er3+ and defect states can occur only within one NaY(MO4)2:Yb3+, Er3+ layer and then the emitted photons are scattered into the air cavities rather than largely captured by the defect states through further long-range ET. To further reveal the analysis mentioned above, the UCL dynamics of the 2H11/2 → 4I15/2 transition in the IOPCs and REF samples as a function of temperature are shown in the inset of Fig. 9. Based on the multi-phonon-relaxation theory, the total spontaneous decay rate (SDR) for 2H11/2 (WTotal) can be written as follows:
| WTotal = WR + WET + WNR(0)(1 − e−ħω/kT)−ΔE/ħω, |
where, WR is the radiative transition rate of 2H11/2–4I15/2, WET the ET rate, including cross relaxation from 2H11/2 of Er3+ and ET from 2H11/2 of Er3+ to Yb3+, and WNR(0) the nonradiative relaxation rate from 2H11/2 at 0 K. By fitting, we deduced that in the IOPCs, WR + WET = 7.08 m s−1, WNR(0) = 0.27 m s−1, whereas in the REF samples, WR + WET = 8.34 m s−1, WNR(0) = 1.01 m s−1. It is evident that in the IOPCs, WNR(0) is considerably inhabited in contrast to the REF samples.
 |
| | Fig. 9 The overall UCL intensity of Er3+ ions as a function of temperature in the IOPC and REF samples. Inset: dependence of spontaneous decay rate of the Er3+ ions on temperature (dots) and the fitting function (line). | |
5. Conclusion
In summary, three-dimensional NaY(MoO4)2:Yb3+/Er3+ IOPCs were prepared by the self-assembly method using PMMA as the template. The modification of the PC effect on the emission spectra and dynamics of Er3+ ions was systemically. First, remarkable enhancement of the three-phonon UCL of 2H9/2 → 4I15/2 was observed in IOPCs, which did not appear in the REF samples, indicating that the IOPCs is a helpful microstructure to realize high-order UCL. These facts can be both attributed to the inhibition of radiative and nonradiative relaxation in the IOPCs, which was further evidenced by UCL dynamic. Second, in the IOPCs the local thermal effect induced by laser exposure in suppressed due to the periodic macroporous structure of IOPCs. The work indicates that the IOPC structure is an effective device for realizing effective UCL in oxide with relatively large phonon energy.
Acknowledgements
This work was supported by the Major State Basic Research Development Program of China (973 program) (no. 2014CB643506), the National Natural Science Foundation of China (grant no. 11374127, 11304118, 61204015, 81201738, 81301289, 61177042, 11174111, and 51202019), the program of Chang Jiang Scholars and Innovative Research Team in University (no. IRT13018), the Graduate Innovation Fund of Jilin University (no. 2015064).
References
- M. Haase and H. Schafer, Angew. Chem., Int. Ed., 2011, 50, 5808–5829 CrossRef CAS.
- F. Wang and X. G. Liu, Chem. Soc. Rev., 2009, 38, 976–989 RSC.
- E. M. Chan, Chem. Soc. Rev., 2015, 44, 1653 RSC.
- Y. L. Dai, H. H. Xiao, J. H. Liu, Q. G. Yuan, P. Ma, D. M. Yang, C. X. Li, Z. Y. Cheng, Z. Y. Hou, P. P. Yang and J. Lin, J. Am. Chem. Soc., 2013, 135, 18920–18929 CrossRef CAS.
- Y. Liu, M. Chen, T. Y. Cao, Y. Sun, C. Y. Li, Q. Liu, T. S. Yang, L. M. Yao, W. Feng and F. Y. Li, J. Am. Chem. Soc., 2013, 135, 9869–9876 Search PubMed.
- Q. Ju, D. T. Tu, Y. S. Liu, R. F. Li, Z. Chen and X. Y. Chen, J. Am. Chem. Soc., 2012, 134, 1323–1330 CrossRef CAS PubMed.
- J. H. Zhang, Z. D. Hao, J. Li, X. Zhang, Y. S. Luo and G. H. Pan, Light: Sci. Appl., 2015, 4, e239 CrossRef.
- A. Bednarkiewicz, M. Nyk, M. Samoc and W. Strek, J. Phys. Chem. C, 2010, 114, 17535–17541 CAS.
- L. Q. Xiong, Z. G. Chen, Q. W. Tian, T. Y. Cao, C. J. Xu and F. Y. Li, Anal. Chem., 2009, 81, 8687–8694 CrossRef CAS.
- M. Nyk, R. Kumar, T. Y. Ohulchanskyy, E. J. Bergey and P. N. Prasad, Nano Lett., 2008, 8, 3834 CrossRef CAS PubMed.
- M. X. Yu, F. Y. Li, Z. G. Chen, H. Hu, C. Zhan, H. Yang and C. H. Huang, Anal. Chem., 2009, 81, 930–935 CrossRef CAS PubMed.
- J. Wang, H. W. Song, W. Xu, B. Dong, S. Xu, B. T. Chen, W. Yu and S. Zhang, Nanoscale, 2013, 5, 3412–3420 RSC.
- Y. Zhang, X. J. Li, Z. Y. Hou and J. Lin, Nanoscale, 2014, 6, 6763–6771 RSC.
- Q. P. Lu, Y. B. Hou, A. W. Tang, H. H. Wu and F. Teng, Appl. Phys. Lett., 2013, 102, 233103 CrossRef.
- Y. Zhou, X. H. He and B. Yan, Opt. Mater., 2014, 36, 602–607 CrossRef CAS.
- Y. F. Wang, W. Xu, Y. S. Zhu, S. Xu, H. N. Cui and H. W. Song, J. Mater. Chem. C, 2014, 2, 4642–4650 RSC.
- X. J. Xie, N. Y. Gao, R. R. Deng, Q. Sun, Q. H. Xu and X. G. Liu, J. Am. Chem. Soc., 2013, 135, 12608–12611 CrossRef CAS.
- F. Zhang and D. Y. Zhao, Nano Res., 2009, 2, 292–305 CrossRef CAS.
- E. Yablonovitch, Phys. Rev. Lett., 1987, 58, 2059 CrossRef CAS PubMed.
- S. John, Phys. Rev. Lett., 1987, 58, 2486–2489 CrossRef CAS.
- D. L. R. Richard and S. Chirs, Nature, 2000, 408, 653–655 CrossRef PubMed.
- Y. Chassagneux, R. Colombelli, W. Maineult, S. Barbieri, H. E. Beere, D. A. Ritchie, S. P. Khanna, E. H. Linfield and A. G. Davies, Nature, 2009, 457, 174–178 CrossRef CAS.
- K. Kompe, H. Borchert, J. Storz, A. Lobo, S. Adam, T. Moller and M. Haase, Angew. Chem., Int. Ed., 2003, 42, 5513–5516 CrossRef PubMed.
- Y. S. Liu, D. T. Tu, H. M. Zhu, E. Ma and X. Y. Chen, Nanoscale, 2013, 5, 1369–1384 RSC.
- C. S. Huang, S. George, M. Lu, V. Chaudhery, R. Tan, R. C. Zangar and B. T. Cunningham, Anal. Chem., 2011, 83, 1425–1430 CrossRef CAS.
- E. Bovero and F. C. van Veggel, J. Am. Chem. Soc., 2008, 130, 15374–15380 CrossRef CAS PubMed.
- Q. Liu, H. W. Song, W. Wang, X. Bai, Y. Wang, B. Dong, L. Xu and W. Han, Opt. Lett., 2010, 35, 2898–2990 CrossRef CAS PubMed.
- Y. S. Zhu, W. Xu, H. Z. Zhang, W. Wang, S. Xu and H. W. Song, J. Phys. Chem. C, 2012, 116, 2297–2302 CAS.
- Y. S. Zhu, W. Xu, H. Z. Zhang, S. Xu, Y. F. Wang, Q. L. Dai, B. Dong, L. Xu and H. W. Song, Opt. Express, 2012, 20, 29673–29678 CrossRef CAS PubMed.
- F. Zhang, Y. H. Deng, Y. F. Shi, R. Y. Zhang and D. Y. Zhao, J. Mater. Chem., 2010, 20, 3895–3900 RSC.
- Z. X. Li, L. L. Li, H. P. Zhou, Q. Yuan, C. Chen, L. D. Sun and C. H. Yan, Chem. Commun., 2009, 6616–6618 RSC.
- D. Errandonea, L. Gracia, R. Lacomba-Perales, A. Polian and J. C. Chervin, J. Appl. Phys., 2013, 113, 123510 CrossRef.
- Y. Q. Zhai, J. Ma, Z. C. Hu, J. J. Zhao, M. Y. Yang and L. Zhao, Arabian J. Chem., 2014, 26, 3129–3133 CAS.
- X. Mateos, R. Solé, J. Gavaldà, M. Aguiló, J. Massons and F. Díaz, Opt. Mater., 2006, 28, 423–431 CrossRef CAS.
- H. J. Yang, F. Peng, Q. L. Zhang, W. P. Liu, D. L. Sun, Y. P. Zhao and X. T. Wei, Opt. Mater., 2013, 35, 2338–2342 CrossRef CAS.
- Y. Li, G. F. Wang, K. Pan, Y. Qu, S. Liu and L. Feng, Dalton Trans., 2013, 42, 3366–3372 RSC.
- J. H. Ryu, J. W. Yoon, C. S. Lim, W. C. Oh and K. B. Shim, J. Alloys Compd., 2005, 390, 245–249 CrossRef CAS.
- M. Aloshyna, S. Sivakumar, M. Venkataramanan, A. G. Brolo and V. Veggel, J. Phys. Chem. C, 2007, 111, 4047–4051 CAS.
- M. Y. Peng, N. Zhang, L. Wondraczek, J. R. Qiu, Z. M. Yang and Q. Y. Zhang, Opt. Express, 2011, 19, 20799 CrossRef CAS PubMed.
- Y. F. Wang, W. Xu, S. B. Cui, S. Xu, Z. Yin, H. W. Song, P.
W. Zhou, X. Y. Liu, L. Xu and H. N. Cui, Nanoscale, 2015, 7, 1363–1373 RSC.
- S. B. Cui, Y. S. Zhu, W. Xu, P. W. Zhou, L. Xia, X. Chen, H. W. Song and W. Han, Dalton Trans., 2014, 43, 13293–13298 RSC.
- Y. S. Zhu, Z. P. Sun, Z. Yin, H. W. Song, W. Xu, Y. F. Wang, L. G. Zhang and H. Z. Zhang, Dalton Trans., 2013, 42, 8049–8057 RSC.
- X. Bai, H. W. Song, G. H. Pan, Y. Q. Lei, T. Wang, X. G. Ren, S. Z. Lu, B. Dong, Q. L. Dai and L. B. Fan, J. Phys. Chem. C, 2007, 111, 13611 CAS.
- D. Li, B. Dong, X. Bai, Y. Wang and H. W. Song, J. Phys. Chem. C, 2010, 114, 8219–8226 CAS.
Footnote |
| † Electronic supplementary information (ESI) available. See DOI: 10.1039/c5ra23678a |
|
| This journal is © The Royal Society of Chemistry 2015 |
Click here to see how this site uses Cookies. View our privacy policy here.