
Detection of cardiovascular disease associated miR-29a using paper-based microfluidics and surface enhanced Raman scattering†
Samuel
Mabbott
 abc,
Syrena C.
Fernandes
d,
Monika
Schechinger
bc,
Gerard L.
Cote
bc,
Karen
Faulds
a,
Charles R.
Mace
d and
Duncan
Graham
*a
abc,
Syrena C.
Fernandes
d,
Monika
Schechinger
bc,
Gerard L.
Cote
bc,
Karen
Faulds
a,
Charles R.
Mace
d and
Duncan
Graham
*a
aDepartment of Pure and Applied Chemistry, Technology and Innovation Centre, University of Strathclyde, 99 George Street, Glasgow, G1 1RD, UK. E-mail: duncan.graham@strath.ac.uk
bDepartment of Biomedical Engineering, Texas A&M University, MS 3120, College Station, Texas 77842-3120, USA
cHealth Technology and Innovation Building, Texas A&M University, MS 3006, College Station, Texas 77843-3006, USA
dDepartment of Chemistry, Tufts University, 62 Talbot Avenue, Medford, MA 02155, USA
First published on 28th November 2019
Abstract
The development of viable point-of-care diagnostic formats is integral to achieving better patient care and improved outcomes. The need for robust and low-cost tests is especially important in under-resourced and rural settings. Perhaps the greatest challenge is ensuring that an untrained individual is capable of operating and interpreting the test, out with a care facility. Here we present a paper-based diagnostic device capable of sensing miR-29a using both colorimetric and surface enhanced Raman scattering (SERS) analysis. Rather, than carry out the two types of analyses in tandem, we envisage that the colorimetric output is easy enough to be interpreted by the untrained-individual administering the test to provide them with qualitative feedback. If deemed positive, the test can be further validated at a centralized care facility using a handheld-Raman spectrometer to provide a semi-quantitative result. Detection of miR-29a, a microRNA associated with myocardial infarction, was achieved at a level of pg μL−1 through the combination of three-dimensional paper-based microfluidics, colorimetric detection, and surface enhanced Raman scattering (SERS) analysis. RGB analysis of the colorimetric output generated from samples containing miR-29a at different concentrations (18–360 pg μL−1) showed differentiation from the control sample, however significant repeat variability indicated that it could not be used for quantifying miR-29a levels. However, the SERS analysis exhibited greater reproducibility at varying concentrations, achieving an LoD of 47 pg μL−1. The union of the paper-based device and the two analysis methods resulted in the production of a sensitive, reproducible and facile, point of care test (POCT), which paves the way for future implementation in the diagnosis of a range of diseases.
Introduction
According to the World Health Organization (WHO), cardiovascular diseases (CVDs) account for 31% of all global deaths.1 Statistics from 2017 suggest that around every 40 seconds someone in the United States has a heart attack (myocardial infarction or MI) caused by reduced blood flow to the heart muscle due to blockages in the surrounding arteries. It is estimated that 790![[thin space (1/6-em)]](https://www.rsc.org/images/entities/char_2009.gif) 000 Americans suffer from a heart attack and for around 73% of them it is their first. This causes permanent damage to the muscle tissue, the extent of which is dependent on the size of the blockage and the time between the occurrence and treatment. Clinicians are able to assess a patient's CVD risk by evaluating a range of non-invasive values (body mass index and systolic blood pressure) as well as assessing personal and family medical histories. To get more detailed information for CVD diagnosis, clinicians will utilize blood panels to assess cholesterol and plasma ceramide levels or will carry out chest X-rays, echocardiograms and electrocardiograms.2–4 Conducting in-depth analysis for CVD diagnosis requires sophisticated instrumentation and trained healthcare practitioners. The requirement for advanced infrastructure and support in a centralized facility presents a significant challenge, particularly in underserved areas that are in remote locations and/or are of low economic status. It is now well recognized that there is an immediate need for targeted testing worldwide, particularly in these underserved populations who are at increased risk of CVD due to contributors such as higher rates of hypertension, obesity and diabetes.5 It is thought that improved diagnostic testing of CVD—ideally using affordable tests that can be used by anyone and anywhere—is integral to improving patient care and outcomes.6
000 Americans suffer from a heart attack and for around 73% of them it is their first. This causes permanent damage to the muscle tissue, the extent of which is dependent on the size of the blockage and the time between the occurrence and treatment. Clinicians are able to assess a patient's CVD risk by evaluating a range of non-invasive values (body mass index and systolic blood pressure) as well as assessing personal and family medical histories. To get more detailed information for CVD diagnosis, clinicians will utilize blood panels to assess cholesterol and plasma ceramide levels or will carry out chest X-rays, echocardiograms and electrocardiograms.2–4 Conducting in-depth analysis for CVD diagnosis requires sophisticated instrumentation and trained healthcare practitioners. The requirement for advanced infrastructure and support in a centralized facility presents a significant challenge, particularly in underserved areas that are in remote locations and/or are of low economic status. It is now well recognized that there is an immediate need for targeted testing worldwide, particularly in these underserved populations who are at increased risk of CVD due to contributors such as higher rates of hypertension, obesity and diabetes.5 It is thought that improved diagnostic testing of CVD—ideally using affordable tests that can be used by anyone and anywhere—is integral to improving patient care and outcomes.6
Point-of-care testing (POCT) is performed to address accessibility challenges outside of the usual clinical laboratory setting. This type of testing can also be applied discreetly at a patient's location for rapid results and informed treatment. Several technologies that enable the detection of CVD biomarkers are being used at the point-of-care. One example is the Roche cobas b 101 system capable of testing for hemoglobin A1c, lipids, and c-reactive protein within 15 minutes from small volumes of blood.7 Similarly, Abbott's I-STAT handheld blood analyzer system is able to test blood for cardiac troponin I and B-type natriuretic peptide (BNP).8 Although both of these systems are considered to enable POCT, their cartridge format and reliance on expensive and dedicated readers severely restricts the broader use of such technologies.
To guide the development of accessible POCT, the WHO established the ASSURED criteria (Affordable, Sensitive, Specific, User-friendly, Rapid and robust, Equipment-free, and Deliverable to end users).9 The acronym was originally formulated to address issues associated with the detection of sexually transmitted diseases, but is now more broadly applied for the design of ‘in-field’ tests for the diagnosis of a range of disease and infections. Recently, the ASSURED criteria has been updated to REASSURED,10 which acknowledges the importance of “Real-time connectivity” that can be accomplished in some cases using external devices such as mobile phones and “Ease of specimen collection and environmental friendliness” for instance by eliminating the use of non-recycled plastics that often give out toxic fumes when burned. Lateral flow tests (LFTs) satisfy many of the ASSURED criteria and as a result have formed the basis for numerous single-use POCTs with applications in field-based healthcare settings (e.g., malaria, influenza) and direct consumer markets (e.g., pregnancy, HIV).11–14 Coupled with an abundance of target specific biomolecules, including DNA,15–18 antibodies19,20 and aptamers,21 LFTs offers potential solutions for the clinical diagnosis of CVD at the point-of-care.22,23 LFTs have shown significant promise towards the sensitive and specific detection of cardiac troponin (cTnI) and high sensitivity C-reactive protein, with both markers being clinically validated.24–26 The colorimetric output associated with many LFTs also lends itself extremely well to the semi-quantitative evaluation of the biomarker levels. However, LFTs have several disadvantages that create obstacles to their application in CVD. First, signal generation requires the affinity-based capture of reagents (e.g., colloidal particles), which makes it difficult to create tests for metabolic biomarkers.27 Second, multiplexing is problematic because reagents are co-formulated for storage in a common pad and all assays must be performed in a common fluidic pathway. As a result, most LFTs are limited to 1–3 test lines per device.
To address these challenges, paper-based microfluidic devices have been developed as an alternative technology to LFTs.28–30 Paper can be easily patterned with hydrophobic barriers to control the distribution of a sample within a device and support the storage of assay reagents in spatially-separated zones. Three-dimensional microfluidic networks can be created by stacking multiple layers of patterned paper or by making a series of folds in a single sheet of paper, much like origami.29,31 Both approaches enable multi-step assays that are not easily accessible in LFTs. Paper-based microfluidic devices facilitate the development of a wide range of diagnostic assays that can utilize a variety of methods to transduce measurable signals such as electrochemical, fluorescent, and/or colorimetrics.32 This inherent adaptability of paper-based microfluidic platforms can also permit the combination of multiple assay strategies simultaneously within a single device or even a single test zone. Further, paper has the potential to be more environmentally friendly over standard plastic materials.
Here we demonstrate such a strategy by developing an assay for the detection of miR-29a, a microRNA (miRNA) biomarker of CVD, in a three-dimensional paper-based microfluidic device that combines both colorimetric and SERS readouts using gold nanoparticle-based reagents. Elevated levels of the short non-coding RNA molecule miR-29a have been shown to be associated with the onset of diverse cardiovascular and cerebrovascular diseases, including vascular inflammation, myocardial infarction, and heart failure. One major advantage of miR-29a as a biomarker for CVD is that, unlike other miRNAs that are confined to cell nuclei, it can be found circulating freely in the bloodsteam.33 As a result, detection of miR-29a may be possible at the point-of-care where fingerstick sampling of blood is routine.
In the combined approach for measuring this biomarker, the generation of a colorimetric result can be interpreted by the person carrying out the testing (i.e., qualitatively), allowing the test to be performed in environments that lack access to instrumentation. The result will then inform the person as to whether further evaluation and treatment is needed. It is envisaged that a result validation procedure could be carried out using a Raman instrument contained within a centralized healthcare unit. When paired with a handheld Raman instrument, we show that SERS analysis can validate the colorimetric results and achieve improved signal reproducibility, which offers the potential for a quantitative paper-based assay. Further, with commercial Raman instruments being made smaller and becoming more affordable, the use of both modalities at the POC is a near-future possibility for an inexpensive and accessible POCT for CVD.
Experimental
Synthesis of gold nanoparticles (AuNPs)
AuNPs were synthesized using a citrate reduction method. To 100 mL of deionized water, sodium tetrachloroaurate(III) dihydrate (4 mg, 0.1 mM) was added and heated. Once boiling, 7.5 mL of trisodium citrate dihydrate (84 mg, 38 mM) was added and the solution was allowed to boil under vigorous stirring for 15 min. The appearance of a red sol signified the formation of AuNPs. Extinction spectroscopy revealed a λmax = 521 nm and absorbance of 0.505. According to published results the nanoparticles were estimated to be ∼20 nm in diameter.34 The concentration of the nanoparticles was calculated to be 0.5 nM using an extinction coefficient of 9.28 × 10⁸.Functionalisation of the AuNPs with DNA and MGITC
The AuNPs were functionalized using single-stranded 5′thiol-modified DNA with 3 hexaethylene glycol spacers incorporated to separate the DNA from the thiol terminal group. The strand consisted of 10 bases and represents around half of the complementary sequence of miR-29a. To allow for fast attachment of the thiolated-DNA to the NP surface, a pH-assisted methodology was employed. To 1 mL of AuNPs, 30 μL of monothiolated DNA was added at a concentration of 5000 oligos per NP, immediately after DNA addition 60 μL of citrate buffer was added (0.3 M, pH 3) and the sol was left to shake for 30 min. The DNA functionalized nanoparticles were centrifuged for 20 min at 6000 rpm and the supernatant was removed and replaced with 0.1 M PBS, pH 7.4. The centrifugation steps and supernatant replacement was carried out twice more to ensure the removal of unbound DNA.In order to acquire a SERS read out it was crucial that the DNA conjugated AuNPs were modified using a Raman reporter. In this case malachite green isothiocyanate (MGITC) was chosen, as it forms a strong attachment to the nanoparticles surface via its isothiocyanate group. The modified nanoparticles were mixed with MGITC dye at ∼5000 molecules per NP for 2 h. The number of oligos and dye molecules per nanoparticle were calculated based on the AuNP concentration of 0.5 nM.
Following the successful modification of the NPs with single stranded DNA and dye, they were then centrifuged for 20 min at 6000 rpm and resuspended in a buffer containing sodium phosphate (20 mM), TWEEN 20 (0.25% v/v) and sucrose (10% w/v) at an optical density (O.D.) of 7. Additives in the suspension buffer stabilizes the nanoparticles while ensuring they will not stick to the papers fibers when flowing though the microfluidic channels.
Preparation of wax printed layers
The three-dimensional paper-based microfluidic devices are assembled from a combination of Whatman 4 chromatography paper (W4C), immunodyne ABC nylon membrane (0.45 μM pore size) and Fisherbrand chromatography paper (FCP, 0.35 mm thickness). The device is composed of 6 wax-patterned layers, which define hydrophilic and hydrophobic zones on the paper and control solution follow throughout the device. Wax is deposited onto the paper using a Xerox ColorQube 8580 printer. The wax-coated paper is then heated in an oven at 150 °C for 30 s, until the wax has penetrated completely through to the other side.Fig. 3 shows the layer architecture and the black/yellow zones indicate the areas where wax has been deposited. From top-to-bottom the 3-D device is composed of a sample addition layer (W4C), this is where the solution sample is introduced and shields the device from environmental contamination. The conjugate layer (W4C) stores the signal transducing reagent (DNA-modified AuNPs). The incubation layer (W4C) promotes the binding between the biofunctionalized NPs and the miRNA as the sample travels laterally. The capture layer (nylon membrane) features immobilized ssDNA oligo strands. It is here that nanoparticles will be retained if the miR-29a sequence is present in a sample. After the assay is complete, this layer is revealed to enable visualization and spectral interrogation of the test result. The wash layer (W4C) wicks free sample and reagents away from the capture layer into the blot layer (FCP). Each layer is backed using double-sided adhesive tape to attach the layers together.
The functionalized AuNPs (5 μL, OD 7) were deposited onto the conjugate storage layer, suspension buffer (15 mL) was spotted onto the incubation layer and streptavidin (1 mg mL−1, 1 μL) followed by biotin modified single stranded DNA (12 bases, 5 μL, 12.5 μM) was added sequentially to the capture layer. This layer was washed with 0.3 M PBS to remove any unbound Biotin-ssDNA. The streptavidin–biotin complex is not washed through the layer because its large size is unable to navigate through the pores of the nylon, which means that it is available to hybridize to the complementary miR-29a sequence when the assay is run.
All layers were left to dry (∼30 min) before running the assay. The adhesive backing on each layer was revealed and the device constructed according to Fig. 3. Other layers not mentioned above include the self-explanatory sample addition layer and also the wash and wick-pad, which pull the assay solution through the assembled device by capillary action.
Running of the device
Once assembled, the device is rolled through a cold laminator to ensure that the layers are in satisfactory conformal contact to enable the flow of solution throughout. An assay is carried out on the device by first spotting a sample onto the sample addition layer. In the experiments carried out here, this usually involves the deposition of either complementary (miR-29a) or non-complementary (miR-21, negative control) miRNA, followed by PBS (40 μL, 0.3 M). The PBS solution is referred to as the running buffer. It takes around 20 min to run a single device, after which time the capture layer is peeled back to reveal the result. The capture layer is left to dry fully for a further 30 min before SERS analysis is carried out.SERS analysis
SERS analysis is carried out using a CBEX handheld Raman spectrometer (Snowy Range Instruments, Laramie, USA). The handheld device operates at 638 nm (40 mW) and is equipped with a point and shoot adjustable tip. The distance from the device aperture to tip end is set at ∼26 mm, this was found to be the optimal distance for SERS interrogation of the detection layer of the paper based devices. Spectra were acquired for 0.01 s, in orbital raster scan mode over a range of 400–1700 cm−1. A 3D printed (PLA) adaptor was created to ensure consistent collections were made. Fig. 2 shows the handheld Raman instrument together with the adaptor. Raw Raman data were extracted in spc format and processed in Matlab (Mathworks, MA, USA). Initially, the spectra were cropped to display the 1100–1700 cm−1 region which contained vibrational bands of interest for MGITC. The spectra were then baseline corrected using an asymmetric least squares algorithm.35 To generate the concentration curve (Fig. 4B) the intensity of the benzene in-plane vibration at 1174 cm−1 was used. The intensities of these peaks were isolated from the data sets and averaged for each repeat concentration and their standard deviations were calculated to show the variation in signal. The curve fitted to the data is generated using a 2nd order polynomial in Matlab.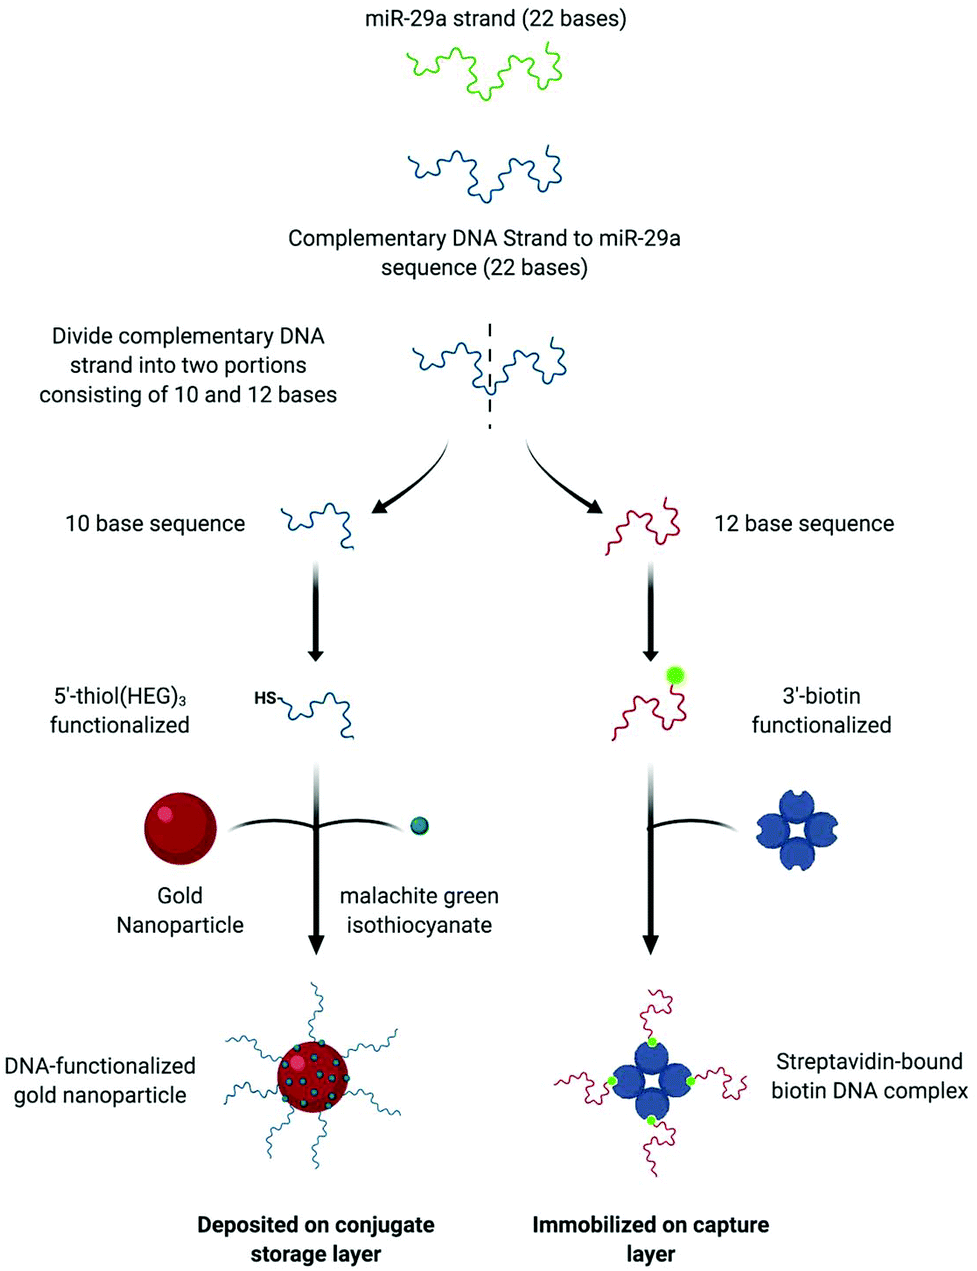 | ||
| Fig. 1 The schematic shows how the components comprising the split-probe hybridization assay are designed. A 22 base DNA strand complementary to the miR-29a sequence is first developed, then divide the split into two portions consisting of 10 and 12 bases. The 10 base sequences is modified at the 5′ end using a thiol attached to 3 hexaethylene glycol groups (HEG). The functionalized oligos are then attached to the surface of the gold nanoparticles using a pH-modified methodology (procedure details are given in the experimental section of the manuscript) followed by the surface attachment of malachite green isothiocyanate Raman reporter. After attachment of the DNA and reporter the functionalized gold nanoparticles are deposited onto the conjugate storage layer of the device. For the capture portion of the assay a streptavidin-bound DNA complex is formed. To do this the 12 base sequences is functionalized with biotin at the 3′ end. Streptavidin is then deposited on the capture layer and incubated with the biotin-modified DNA to form an immobilized complex. Unbound biotin–DNA is then removed through successive washes with 0.3 M PBS pH 7.4. | ||
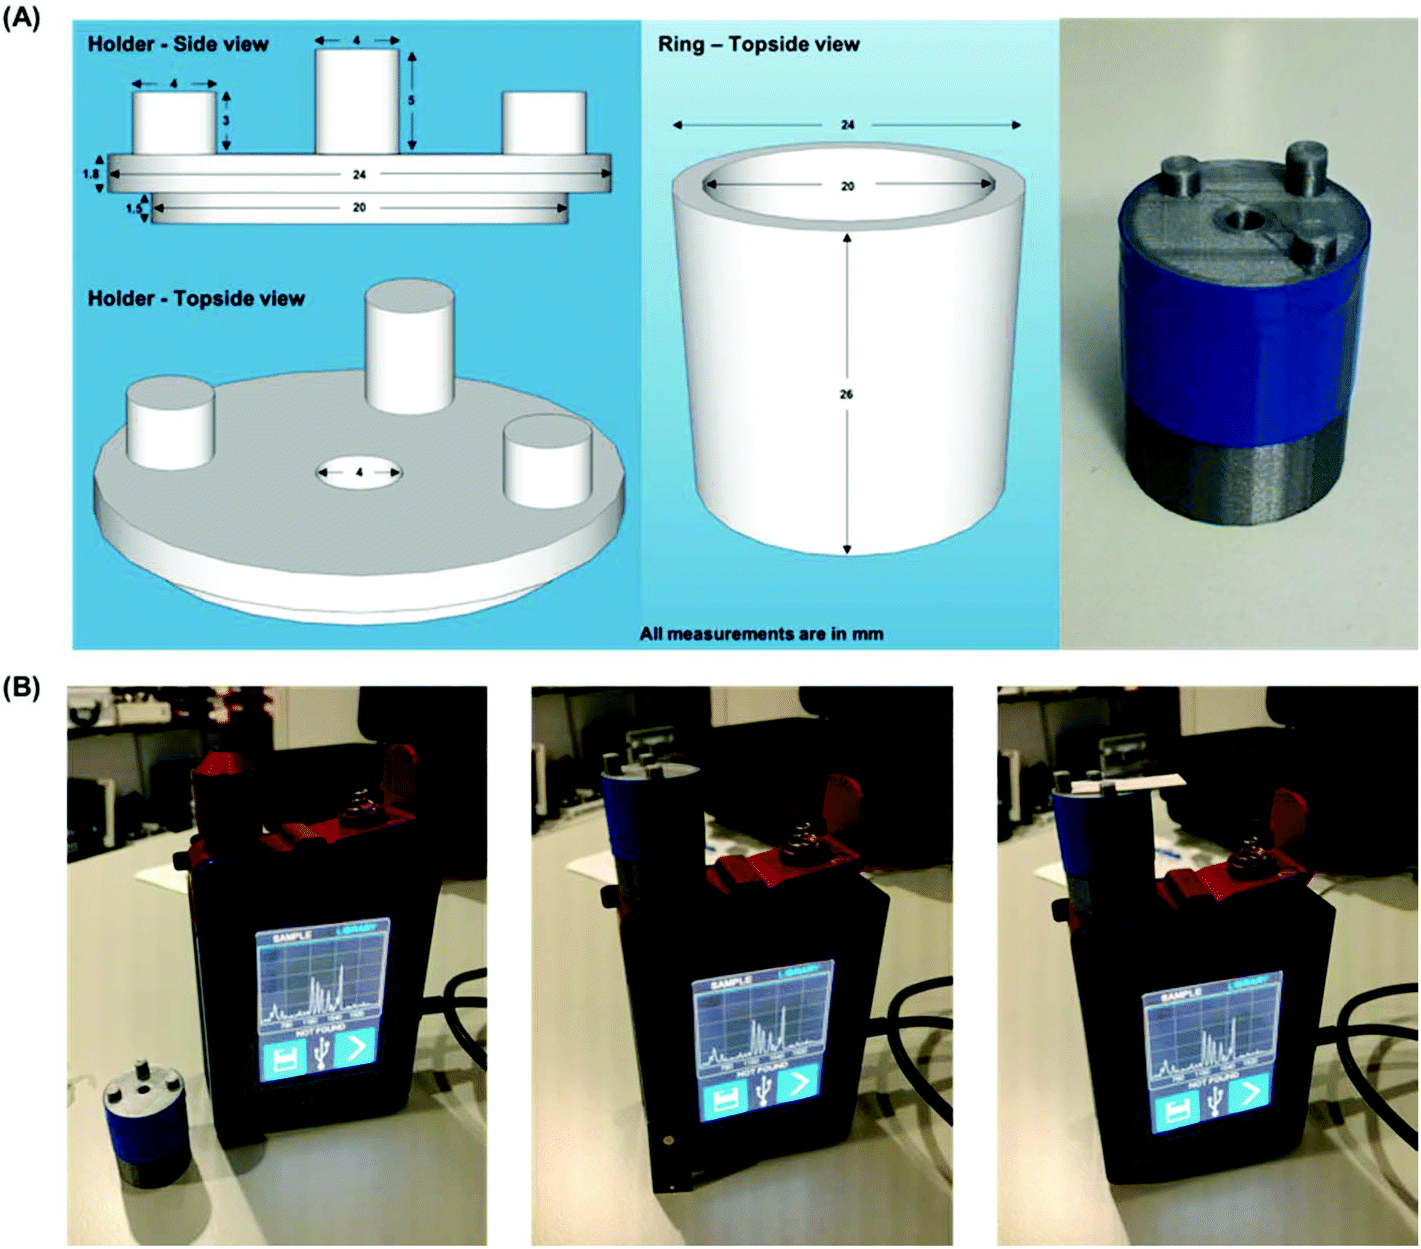 | ||
| Fig. 2 (A) shows the design and dimensions of the Raman aperture adaptor used for the analysis of the capture layer contained within the 3-D paper device. The adaptor was appropriately scaled to ensure that readouts were made at the optimal distance and center of the spot (B) Images display how the adaptor fits over the point and shoot lens and how the capture layer is mounted to enable SERS analysis. | ||
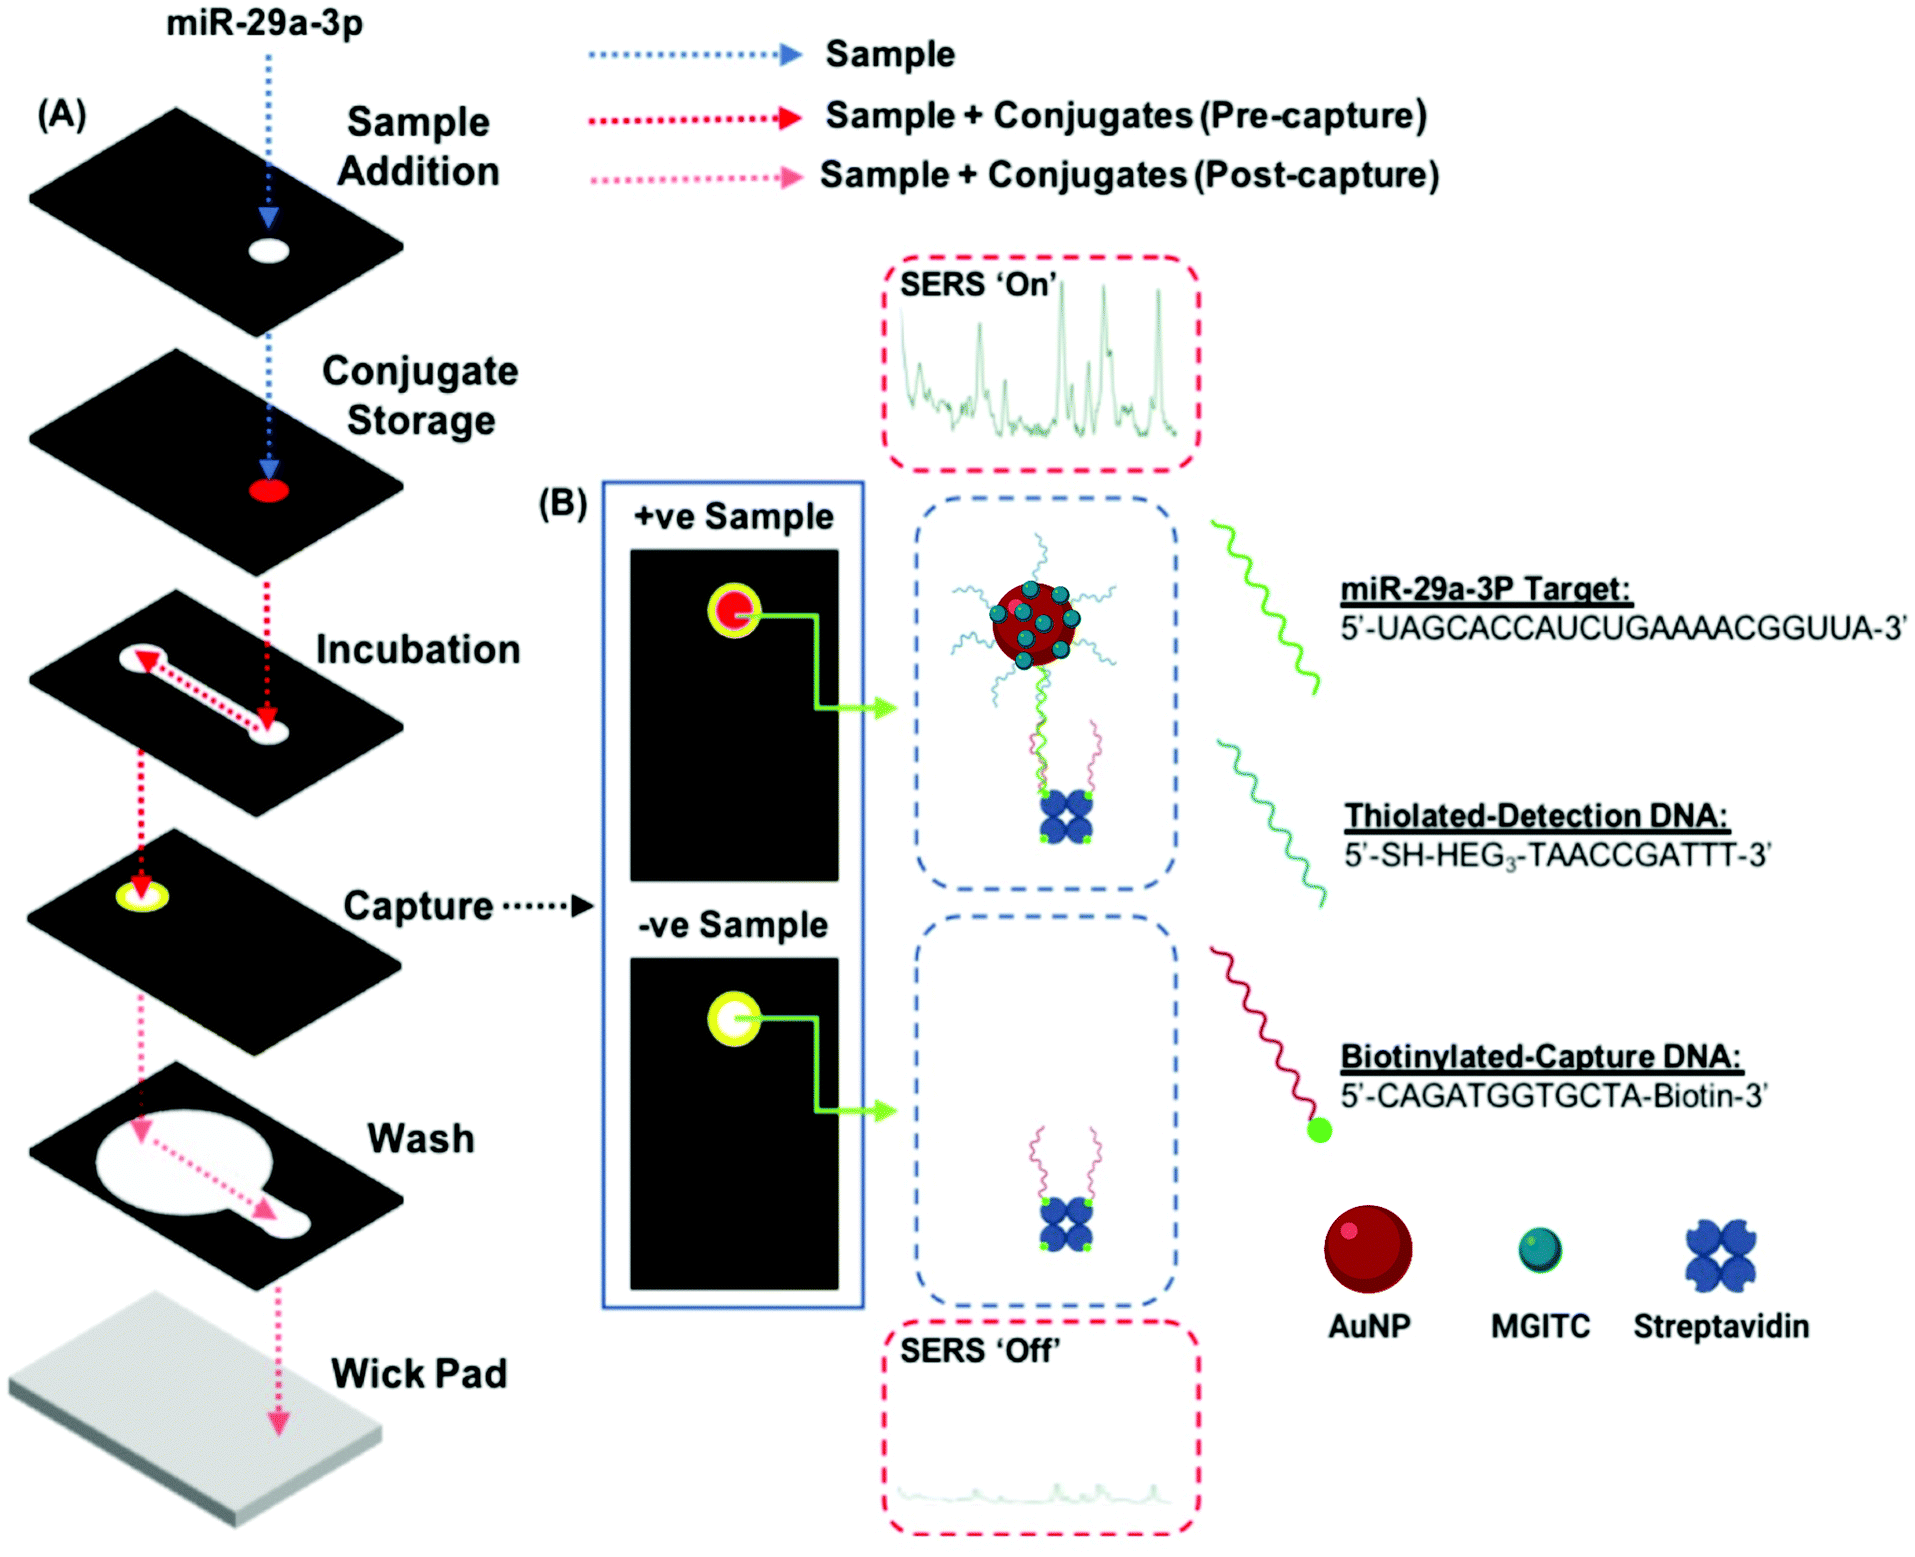 | ||
| Fig. 3 Illustration of the dual detection method for miR-29a in a 3D paper-based microfluidic device (A) Exploded schematic of the 3D paper device configuration. The dotted lines represent the sample pathway before the sample mixes with the AuNP conjugate (blue), after the sample rehydrates and mixes with the AuNP conjugate to form the partial immunocomplex (red) and as excess reagents and sample wick away from the capture zone (pink). (B) Representative images of sample readout using both colorimetric and SER methods for samples containing miR-29a (+ve) and samples without miR-29a (−ve). | ||
 | ||
| Fig. 4 Graphical representation of the SERS performance of miRNA assay in 3D paper-based microfluidic device using different concentrations of miR-29a (18–360 pg μL−1). A. Shows SERS spectra representative of the 18 pg μL−1 (blue) and 360 pg μL−1 (red) concentrations, highlighted are three signature MGITC peaks. The intensity of the tentatively assigned benzene in-plane vibration observed at 1174 cm−1 was used to produce the SERS concentration curve seen in B. Each data point represents the average of 3 replicates and their associated errors. The trendline is fit to the data via a 2nd order polynomial. The limit of detection for miR-29a is estimated to be 47 pg μL−1. An image representing each concentration of miR-29a analyzed is inset in the concentration curve. | ||
Results and discussion
Sensing of the miR-29a strand is achieved using a split-probe hybridization assay. The schematic in Fig. 1 shows the assay design. Initially, a 22 base single strand DNA complement is established for the miR-29a strand target. The complement is then split into two shorter sequences, 10 bases and 12 bases, respectively. The 10 base sequence is modified at the 5′ end using a thiol-(hexaethylene glycol)3 group and the 12 base sequence is modified at the 3′ end using a biotin moiety. The monothiolated DNA are then attached to the surface of a gold nanoparticles, along with dye molecules (malachite green isothiocyanate, MGITC). The nanoparticle conjugates are deposited onto the conjugate storage layer shown in Fig. 3. The biotin modified DNA is used to form a complex with streptavidin, which acts as an anchor immobilizing the sequence on the nylon capture layer.This is similar in design to our previous work with a solution-based sensing assay of fungal infection specific DNA, whereby SERS signal enhancement is realized in the presence of a complementary DNA target.36 However, rather than tethering each probe to a set of gold nanoparticles (AuNPs), only one probe is attached to the nanoparticle whilst the other is anchored to a capture layer within the paper-based device (Fig. 3). The assay has been designed so that when the miR-29a is present, hybridization will occur in a two-step process: (i) between the AuNP–DNA probe and miRNA strand and (ii) at the capture zone to tether the nanoparticle in place causing a red spot to appear. Traditionally, this readout is interrogated using RGB analysis, but deposition of the particles can often be heterogeneous and with limited reproducibility.37 In an attempt to overcome this issue, a portable Raman spectrometer was used to measure the SERS response at the capture site. A Raman reporter, malachite green MGITC, was attached to the AuNPs to provide a SERS signal that indicated the presence of miR-29a with an expectation of a relationship between signal intensity and miRNA concentration.
To enable this multistep probe–target–probe hybridization sequence, we adapted a paper-based microfluidic device that is capable of performing immunoassays by exchanging the type of reagents stored within the device (e.g., use of DNA probes instead of antibodies).38–40 The three-dimensional paper-based device consists of six layers of patterned paper or Nylon with each layer serving a role in the detection of our desired analyte, miR-29a (Fig. 3A). After an assay is completed, peeling off the top three layers exposes the test zone on the readout layer. This process reveals the nanoparticle tethering, permitting the captured gold complex to be interrogated using RGB and SERS analysis.
Addition of the miR-29a sequence facilitates the retention of the RNA functionalized nanoparticle at the readout site orientating in a ‘tail-to-tail’ configuration in relation to the streptavidin anchor. It takes approximately 5 min to run the sample through the device. Optimization of running and suspension buffers was crucial in order to aid nanoparticle flow through the device. The most key component was found to be the sucrose incorporated into the suspension buffer. At concentrations below 10% w/v, functionalized nanoparticles would not release from the conjugate storage layer after addition of a sample.
The functionalized AuNPs used in the assay had an optical density (O.D.) of 7. This concentration of AuNPs was found to be optimal, allowing them to flow freely in the paper devices while limiting non-specific adsorption. The concentration of miR-29a that was run through the device is expressed in pg μL−1 (full calculation is shown in the ESI†). Six concentrations ranging from 18–720 pg μL−1 plus a blank (miR-21 at 720 pg μL−1) were used in the experiments. Each concentration was interrogated in triplicate, and a spectrum was captured on each deposition layer, providing a total of 24 spectra. Initial signal variation problems were encountered by trying to manually ensure that the capture spot from each device was positioned identically over the aperture. This variation was overcome by 3D printing a custom sample holder optimized for sample distance (∼28 mm covering the point and shoot adjustable tip) and capture spot centering (facilitated by three support posts). Incidentally, the holder also restricts light entering the aperture, which could otherwise provide background light interference to the SERS spectrum (adaptor design is displayed in Fig. 2).
There are 3 major vibrations arising from MGITC attached to the AuNPs surface, these are positioned at 1174 cm−1 (benzene in-plane vibration), 1364 cm−1 (N–Ph ring stretch) and 1612 cm−1 (N–Ph ring and C–C stretch). The peak at 1174 cm−1 was used to calculate a concentration curve (Fig. 4, 18–360 pg μL−1) because, apart from its high SERS signal, it is also a single band avoiding the error concomitant with associated shoulders (for example, exhibited by the largest peak at 1364 cm−1). The limit of detection (LoD) was estimated according to the following equation:
| LoD = LoB + 1.645(SDlow concentration sample) |
| LoB = meanblank + 1.645(SDblank). |
The LoD was estimated to be 47 pg μL−1. When dry each device was scanned using a conventional desktop scanner operating at 800 dpi. The scanned images were saved in TIFF format and analyzed using Image J.41 The diameter of the readout site on the chips is 2.6 mm, but to generate the RGB output using the RGB measure plugin (https://imagej.nih.gov/ij/plugins/rgb-measure.html), a circle of smaller diameter (approximately 2.2 mm) was used so as to avoid interference from the printed yellow rings that were used to provide contrast. RGB values for each of the concentrations (0 to 720 pg μL−1) were extracted and normalized by subtracting their values from 255. Plots showing the relationship between each of the channels (R, G and B) normalized values with respect to miR-29a concentrations can be seen in Fig. 5. The channels all demonstrated a high goodness-of-fit implied by the linear regression models (R2) with the red channel = 0.9523, green channel = 0.982 and blue channel = 0.9809. However, there is extensive overlap in the standard deviations, especially at lower miRNA concentrations (highlighted in red in Fig. 5). The LoD for colorimetric analysis is estimated to be >200 pg μL−1 meaning that while it provides effective qualitative discrimination of miR-29a concentration it cannot provide reproducible semi-quantitative analysis to the same levels that SERS provides.
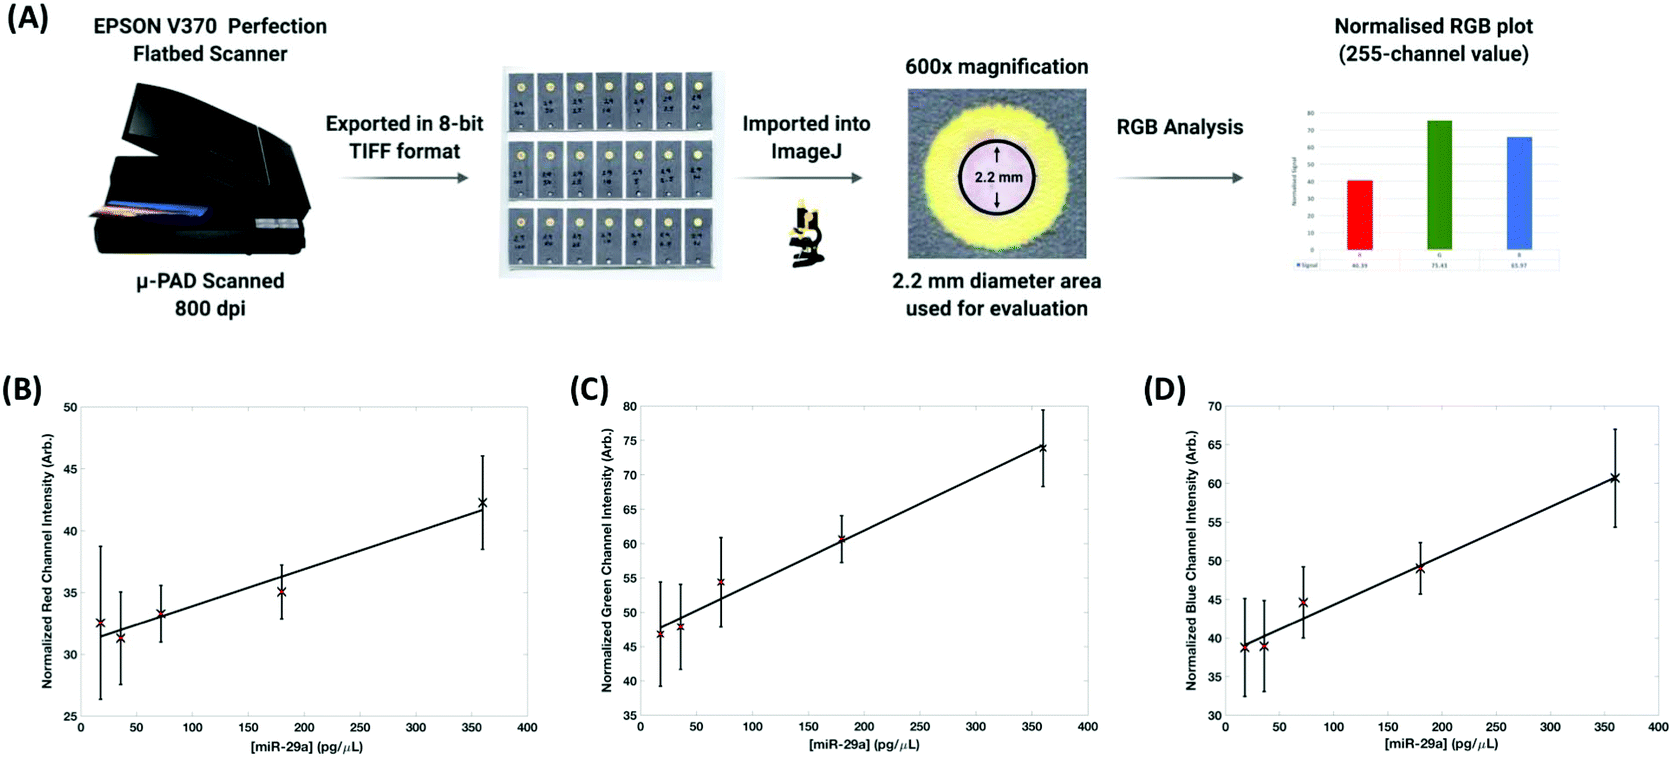 | ||
| Fig. 5 The protocol for RGB analysis is shown in A. After completion of the tests the paper-based devices were scanned using a flatbed scanner set at a resolution of 800 dpi. The exported 8-bit images were then uploaded into ImageJ. A circle of 2.2 mm diameter was used to define an area on all the test readouts and RGB analysis was carried out using the RGB measure script. Graphical representation of the colorimetric analysis of the 3D paper-based microfluidic devices. Each of the channels R, G and B are represented in that order from left to right (A–C). Each plot shows the relationship between normalized channel intensity and miR-29a concentration (18–360 pg μL−1). Average values and standard deviations were generated from 3 replicates. Linear regression gave R2 values of 0.9523 (red channel), 0.982 (green channel) and 0.9809 (blue channel). Red markers at lower miR-29a concentrations are used to highlight significant overlaps in the standard deviations. | ||
Detection of miRNA using DNA–AuNP probes has been demonstrated previously and have been shown to achieve femtomolar LoDs.42 The application of SERS for the detection of miRNAs has also been shown by multiple groups with LoDs ranging from 70.2 aM–1 pM.13,43–47 While these LoDs are excellent and demonstrate the future potential of noble metal nanoparticles and SERS towards the detection of disease associated miRNAs, none of these methodologies are amenable to POCT. The use of enzymes, circular amplification cycles, large instrumentation, and solution-based analysis significantly complicates rapid detection of miRNA. The methods would not adhere to the ASSURED guidelines and it would be challenging to adapt them for POCT. However, the use of the handheld Raman instrument for the analysis of the paper-based devices is consistent with interpretations for REASSURED criteria that consider handheld readers (e.g., cell phones, glucometers) for Real time connectivity as solutions to POCT in limited-resource settings. Moreover, the use of Raman appears to forgo any substantial errors associated with heterogeneous deposition on the capture layer. It is believed that the integrated orbital raster scan (ORS) mode is helpful in maintaining integrity over a large area by using a tightly focused beam with a patterned laser excitation. Relative standard deviations associated with each concentration ranged from 3–12%, which is remarkable given the challenge for previously obtaining reproducible behavior of SERS analysis and indicative of the future potential for quantitative SERS measurements to be taken.
The work demonstrated here shows the huge potential for the combination of paper-based devices with colorimetric analysis and portable Raman instrumentation for the validation and semi-quantitative analysis of POCT. Implementation of future work associated with both adapting the paper devices and carrying out SERS analysis is crucial to further improve the sensitivity and specificity of the diagnostic method. It is also vital that multiplexed analysis of a range of CVD associated circulating miRNA biomarkers can be detected to reinforce disease diagnosis. SERS signals can also be improved to further enhance the sensitivity, which would include exploring a range of nanoparticle sizes, morphologies and associated Raman reporters.
Conflicts of interest
There are no conflicts to declare.Acknowledgements
This work has been funded by the EPSRC Grant no. EP/L014165/1. This material is based upon work supported by the National Science Foundation Graduate Research Fellowship Program under Grant no. DGE-1325256 that was awarded to S. C. F. and was supported by a generous gift from James Kanagy. Parts of Fig. 1, 3 and 5 have been created with Biorender.com. S. M. is supported through start-up funds from Texas A&M University and Texas A&M Engineering Experiment Station. This work was funded, in part, through the NSF Precise Advanced Technologies and Health Systems for Underserved Populations (PATHS-UP) Engineering Research Center (#1648451). Data associated with this publication, are openly available from the University of Strathclyde KnowledgeBase at https://doi.org/10.15129/608f75c5-0b90-4563-985f-189565a59f07.References
- Cardiovascular Disease (CVDs), (accessed 13th July, 2019).
- M. Tovar Pérez and M. R. Rodríguez Mondéjar, Radiologia, 2017, 59, 446–459 CrossRef PubMed.
- L. Capotosto, F. Massoni, S. De Sio, S. Ricci and A. Vitarelli, BioMed Res. Int., 2018, 2018, 15 CrossRef PubMed.
- E. A. Ashley, V. Raxwal and V. Froelicher, Prog. Cardiovasc. Dis., 2001, 44, 55–67 CrossRef CAS PubMed.
- G. Graham, Curr. Cardiol. Rev., 2015, 11, 238–245 CrossRef PubMed.
- A. M. Caliendo, D. N. Gilbert, C. C. Ginocchio, K. E. Hanson, L. May, T. C. Quinn, F. C. Tenover, D. Alland, A. J. Blaschke, R. A. Bonomo, K. C. Carroll, M. J. Ferraro, L. R. Hirschhorn, W. P. Joseph, T. Karchmer, A. T. MacIntyre, L. B. Reller, A. F. Jackson and Idsa, Clin. Infect. Dis, 2013, 57, S139–S170 CrossRef.
- H.-J. Yu, S. Lim, M.-J. Kwon, H.-Y. Woo and H. Park, Evaluation of Cobas b 101 HbA1c Analyzer Performance for Point-of-Care Testing, 2017 Search PubMed.
- C. L. Martin, Clin. Biochem. Rev., 2010, 31, 81–84 Search PubMed.
- I. Toskin, R. W. Peeling, D. Mabey, K. Holmes, R. Ballard, J. Kiarie and I. Askew, Sex. Transm. Infect., 2017, 93, S1 CrossRef PubMed.
- K. J. Land, D. I. Boeras, X. S. Chen, A. R. Ramsay and R. W. Peeling, Nat. Microbiol., 2019, 4, 46–54 CrossRef CAS PubMed.
- A. K. Yetisen, M. S. Akram and C. R. Lowe, Lab Chip, 2013, 13, 2210–2251 RSC.
- J. Hu, X. Y. Cui, Y. Gong, X. Y. Xu, B. Gao, T. Wen, T. J. Lu and F. Xu, Biotechnol. Adv., 2016, 34, 305–320 CrossRef.
- S. Ahmed, M. P. N. Bui and A. Abbas, Biosens. Bioelectron., 2016, 77, 249–263 CrossRef CAS PubMed.
- M. Sher, R. Zhuang, U. Demirci and W. Asghar, Expert Rev. Mol. Diagn., 2017, 17, 351–366 CrossRef CAS PubMed.
- X. Fu, Z. Cheng, J. Yu, P. Choo, L. Chen and J. Choo, Biosens. Bioelectron., 2016, 78, 530–537 CrossRef CAS PubMed.
- M. Jauset-Rubio, M. Svobodova, T. Mairal, C. McNeil, N. Keegan, A. Saeed, M. N. Abbas, M. S. El-Shahawi, A. S. Bashammakh, A. O. Alyoubi and C. K. O'Sullivan, Sci. Rep., 2016, 6, 37732 CrossRef CAS.
- S. Takalkar, K. Baryeh and G. D. Liu, Biosens. Bioelectron., 2017, 98, 147–154 CrossRef CAS PubMed.
- P. F. Mens, A. van Amerongen, P. Sawa, P. A. Kager and H. D. F. H. Schallig, Diagn. Microbiol. Infect. Dis., 2008, 61, 421–427 CrossRef CAS PubMed.
- S. Choi, J. Hwang, S. Lee, D. W. Lim, H. Joo and J. Choo, Sens. Actuators, B, 2017, 240, 358–364 CrossRef CAS.
- J. S. Oh, G. W. Ha, Y. S. Cho, M. J. Mm, D. J. An, K. K. Hwang, Y. K. Lim, B. K. Park, B. K. Kang and D. S. Song, Clin. Vaccine Immunol., 2006, 13, 520–524 CrossRef CAS PubMed.
- H. Xu, X. Mao, Q. X. Zeng, S. F. Wang, A. N. Kawde and G. D. Liu, Anal. Chem., 2009, 81, 669–675 CrossRef CAS PubMed.
- W. M. Leung, C. P. Chan, M. F. Leung, R. Renneberg, K. Lehmann, I. Renneberg, M. Lehmann, A. Hempel and J. F. C. Glatz, Anal. Lett., 2005, 38, 423–439 CrossRef CAS.
- J. S. Ahn, S. Choi, S. H. Jang, H. J. Chang, J. H. Kim, K. B. Nahm, S. W. Oh and E. Y. Choi, Clin. Chim. Acta, 2003, 332, 51–59 CrossRef CAS.
- J. Boeddinghaus, R. Twerenbold, T. Nestelberger, P. Badertscher, K. Wildi, C. Puelacher, J. du Fay de Lavallaz, E. Keser, M. Rubini Giménez, D. Wussler, N. Kozhuharov, K. Rentsch, Ò. Miró, F. J. Martin-Sanchez, B. Morawiec, S. Stefanelli, N. Geigy, D. I. Keller, T. Reichlin and C. Mueller, Clin. Chem., 2018, 64, 1347 CrossRef CAS PubMed.
- P. M. Ridker, Clin. Chem., 2009, 55, 209 CrossRef CAS PubMed.
- R. Dhingra and R. S. Vasan, Trends Cardiovasc. Med., 2017, 27, 123–133 CrossRef CAS PubMed.
- M. K. Jensen, M. L. Bertoia, L. E. Cahill, I. Agarwal, E. B. Rimm and K. J. Mukamal, Nat. Rev. Endocrinol., 2014, 10, 659 CrossRef CAS PubMed.
- Y. Yang, E. Noviana, M. P. Nguyen, B. J. Geiss, D. S. Dandy and C. S. Henry, Anal. Chem., 2017, 89, 71–91 CrossRef CAS PubMed.
- S. C. Fernandes, J. A. Walz, D. J. Wilson, J. C. Brooks and C. R. Mace, Anal. Chem., 2017, 89, 5654–5664 CrossRef CAS PubMed.
- E. B. Strong, S. A. Schultz, A. W. Martinez and N. W. Martinez, Sci. Rep., 2019, 9, 7 CrossRef PubMed.
- G. Xu, D. Nolder, J. Reboud, M. C. Oguike, D. A. van Schalkwyk, C. J. Sutherland and J. M. Cooper, Angew. Chem., Int. Ed., 2016, 55, 15250–15253 CrossRef CAS PubMed.
- M. Sher, R. Zhuang, U. Demirci and W. Asghar, Expert Rev. Mol. Diagn., 2017, 17, 351–366 CrossRef CAS PubMed.
- R. Roncarati, C. Viviani Anselmi, M. A. Losi, L. Papa, E. Cavarretta, P. Da Costa Martins, C. Contaldi, G. Saccani Jotti, A. Franzone, L. Galastri, M. V. G. Latronico, M. Imbriaco, G. Esposito, L. De Windt, S. Betocchi and G. Condorelli, J. Am. Coll. Cardiol., 2014, 63, 920–927 CrossRef CAS PubMed.
- P. K. Jain, K. S. Lee, I. H. El-Sayed and M. A. El-Sayed, J. Phys. Chem. B, 2006, 110, 7238–7248 CrossRef CAS PubMed.
- P. H. C. Eilers and H. F. M. Boelens, Leide University Medical Centre Report, 2005, pp. 1–5 Search PubMed.
- S. Mabbott, D. Thompson, N. Sirimuthu, G. McNay, K. Faulds and D. Graham, Faraday Discuss., 2016, 187, 461–472 RSC.
- R. Derda, S. K. Tang, A. Laromaine, B. Mosadegh, E. Hong, M. Mwangi, A. Mammoto, D. E. Ingber and G. M. Whitesides, PLoS One, 2011, 6, e18940 CrossRef CAS PubMed.
- J. E. Schonhorn, S. C. Fernandes, A. Rajaratnam, R. N. Deraney, J. P. Rolland and C. R. Mace, Lab Chip, 2014, 14, 4653–4658 RSC.
- S. C. Fernandes, G. S. Logounov, J. B. Munro and C. R. Mace, Anal. Methods, 2016, 8, 5204–5211 RSC.
- R. N. Deraney, C. R. Mace, J. P. Rolland and J. E. Schonhorn, Anal. Chem., 2016, 88, 6161–6165 CrossRef CAS PubMed.
- C. T. Rueden, J. Schindelin, M. C. Hiner, B. E. DeZonia, A. E. Walter, E. T. Arena and K. W. Eliceiri, BMC Bioinf., 2017, 18, 529 CrossRef PubMed.
- F. Degliangeli, P. Kshirsagar, V. Brunetti, P. P. Pompa and R. Fiammengo, J. Am. Chem. Soc., 2014, 136, 2264–2267 CrossRef CAS PubMed.
- L. P. Ye, J. Hu, L. Liang and C. Y. Zhang, Chem. Commun., 2014, 50, 11883–11886 RSC.
- H. Zhang, Y. Yi, C. H. Zhou, G. Q. Ying, X. D. Zhou, C. P. Fu, Y. F. Zhu and Y. Q. Shen, RSC Adv., 2017, 7, 52782–52793 RSC.
- J. Su, D. F. Wang, L. Norbel, J. L. Shen, Z. H. Zhao, Y. Z. Dou, T. H. Peng, J. Y. Shi, S. Mathur, C. H. Fan and S. P. Song, Anal. Chem., 2017, 89, 2531–2538 CrossRef CAS PubMed.
- H. Zhang, Y. Liu, J. Gao and J. H. Zhen, Chem. Commun., 2015, 51, 16836–16839 RSC.
- Y. He, X. Yang, R. Yuan and Y. Q. Chai, Anal. Chem., 2017, 89, 2866–2872 CrossRef CAS PubMed.
Footnote |
| † Electronic supplementary information (ESI) available. See DOI: 10.1039/c9an01748h |
| This journal is © The Royal Society of Chemistry 2020 |