Diagnosis of pancreatic cancer via1H NMR metabolomics of human plasma
Lenka
Michálková
 ab,
Štěpán
Horník
 ab,
Jan
Sýkora
 b,
Lucie
Habartová
 *a and
Vladimír
Setnička
 a
a
aDepartment of Analytical Chemistry, University of Chemistry and Technology Prague, Prague 6, Czech Republic. E-mail: Lucie.Habartova@vscht.cz
bDepartment of Analytical Chemistry, Institute of Chemical Process Fundamentals of the CAS, Prague 6, Czech Republic
First published on 21st September 2018
Abstract
Metabolic changes induced by pancreatic cancer were investigated by 1H NMR spectroscopy of plasma samples of patients and healthy controls. The acquired data were submitted to multivariate statistical analysis providing clear discrimination between both groups. The most significant differences were found in levels of 3-hydroxybutyrate and lactate. The obtained results (100% sensitivity, 90% specificity) clearly show the potential of 1H NMR spectroscopy in pancreatic cancer diagnosis. Therefore, the NMR-based metabolomics may contribute to the early diagnosis, prevention and/or therapy of diseases in the future. On the other hand, the number of samples in the presented pilot study is limited and has to be significantly increased in the future in order to obtain solid statistical models and to confirm the current findings.
Introduction
Pancreatic cancer is among the most aggressive types of cancer, with a 5-year survival rate of only 5%.1,2 The high mortality is mainly caused by problematic early diagnosis. Establishing the diagnosis is difficult as the symptomatology (nausea, weakness, weight loss, abdominal pain, etc.) is not disease-specific and may have many causes.3,4 Unfortunately, pancreatic cancer often develops silently without any symptoms at its early stage, but progresses very rapidly. The clinical diagnosis of pancreatic cancer is mainly dependent on imaging examination, such as magnetic resonance imaging, computed tomography, endoscopic retrograde cholangiopancreatography and endoscopic ultrasound.4,5 However, the specificity and sensitivity of these techniques are insufficient. On the other hand, traditional protein biomarkers for pancreatic cancer have been described,2,4 including carbohydrate antigen 19–9 (CA 19–9), a cell surface associated mucin that protects against infection through binding to pathogens (MUC1), the immunoglobulin carcinoembryonic antigen-related cell adhesion protein 1 (CEACAM1) and protein marker MIC-1. Unfortunately, the commonly used protein biomarkers are not suitable for early detection. Recently, attention has also been focused on the genetic level of pancreatic cancer, especially on the inspection of micro-RNAs.6 Another strategy for early detection of pancreatic cancer can also be based on the spectroscopic analysis of blood plasma.7Metabolomics is an effective analytical approach to detect the metabolome of cells, tissue, or biofluids.8,9 Subjects of interest are small molecules (<1500 Da), such as lipids, carbohydrates, amino acids, nucleotides and many other organic compounds, which are the reactants, intermediates and products of biochemical reactions or basic units for other molecular structures. The general objective of the metabolomic approach is to determine fluctuations of endogenous metabolites by analysing biological matrices (biofluids, tissues or cell extracts) and to deduce the relationship between metabolic changes and specific pathophysiological conditions (e.g. diseases, diet and therapeutic interventions).9 Nuclear magnetic resonance (NMR) spectroscopy and mass spectrometry (MS) are the major analytical platforms of this rapidly growing field.8,9 The high data reproducibility, quantitative analysis and determination of unknown structures are the main advantages of NMR spectroscopy. Moreover, NMR is a non-destructive technique. The potential of metabolomics for disease diagnosis, prognosis and therapy relies on the ability to extract statistically relevant data from metabolic profiles.8,9 The combination of the NMR spectra of biofluids and methods of pattern recognition has driven forward the application of metabolomics in the field of biomarker discovery.8,9
In this study, 1H NMR was employed to investigate the metabolic features in human plasma of pancreatic cancer patients and healthy controls.
Materials and methods
Plasma sample collection
Ten pancreatic cancer patients (aged from 53 to 83 years old, 6 male and 4 female) and ten healthy subjects (aged from 48 to 78 years old, 4 male and 6 female) were recruited at the Department of Gastrointestinal Endoscopy at the Internal Clinic of the Military University Hospital and the First Faculty of Medicine (Charles University in Prague, Czech Republic). The patients were included in the study after the examination following clinical protocol, i.e. using endoscopic ultrasound, magnetic resonance imaging and/or computed tomography. The presence of the tumour was verified by histopathology. Venous blood (9 mL) from all subjects was collected using sterile blood collection tubes with K3EDTA as an anticoagulant and subjected to a routine biochemical test, assessing basic physiological indicators, such as fasting plasma glucose (FPG), glycated haemoglobin (HbA1c), human serum albumin (HSA), protein or cancer biomarker (CA 19–9, CEA) levels (Table 1). The plasma fractions were obtained by centrifugation at 1500g for 10 min and frozen immediately afterwards (−80 °C).| Patient | Control | |
|---|---|---|
| Age | 69.1 ± 8.9 | 59.0 ± 9.2 |
| FPG [mmol L−1] | 6.5 ± 1.5 | 5.5 ± 0.4 |
| HbA1c [mmol L−1] | 51.0 ± 16.7 | 35.9 ± 3.9 |
| HSA [g L−1] | 37.9 ± 6.4 | 44.2 ± 5.7 |
| Total protein [g L−1] | 63.4 ± 7.5 | 66.9 ± 6.9 |
| CA 19–9 [kU L−1] | 3.3–4,275.0 | 2.6–19.6 |
| CEA [kU L−1] | 1.2–133.9 | 0.8–3.8 |
All experiments were performed in accordance with the principles expressed in the Declaration of Helsinki, the Collection of Laws of the Czech Republic, and approved by the Ethics Committee at the Military University Hospital Prague. Signed informed consents were secured from all human participants of this study.
Sample preparation and 1H NMR spectroscopic analysis
Prior to the NMR analysis, plasma aliquots of 300 μL were thawed at room temperature and subjected to ultrafiltration on an Amicon Ultra-0.5 mL 3 K filter (with a 3 kDa cut-off limit; Merck Millipore, USA) at 12![[thin space (1/6-em)]](https://www.rsc.org/images/entities/char_2009.gif) 000 rpm for 30 min to separate macromolecular proteins and lipids. The centrifuged plasma was mixed with 300 μL of phosphate buffer solution in D2O (0.1 mol L−1, pH = 7.4). The phosphate buffer contained sodium salt of trimethylsilylpropionic acid (TSP-d4) as an internal reference standard (0.1 mmol L−1) and sodium azide (38 mmol L−1) as an antibacterial agent. This mixture was transferred into 5 mm NMR tubes for the analyses.
000 rpm for 30 min to separate macromolecular proteins and lipids. The centrifuged plasma was mixed with 300 μL of phosphate buffer solution in D2O (0.1 mol L−1, pH = 7.4). The phosphate buffer contained sodium salt of trimethylsilylpropionic acid (TSP-d4) as an internal reference standard (0.1 mmol L−1) and sodium azide (38 mmol L−1) as an antibacterial agent. This mixture was transferred into 5 mm NMR tubes for the analyses.
The 1H NMR spectra were acquired on a Varian INOVA 500 MHz spectrometer (Varian Instruments Inc., USA) operating at a frequency of 499.87 MHz for 1H at 298 K. The 1H NMR spectra were acquired for each plasma sample using Carr–Purcell-Meiboom-Gill (CPMG) spin-echo pulse sequence with residual water signal suppression. A total of 10![[thin space (1/6-em)]](https://www.rsc.org/images/entities/char_2009.gif) 000 scans with an acquisition time of 2.7 s, a saturation period of 4 s and 128 cycles of a 180° pulse were collected for each NMR spectrum. All spectra were referenced to TSP δ = −0.016 ppm.
000 scans with an acquisition time of 2.7 s, a saturation period of 4 s and 128 cycles of a 180° pulse were collected for each NMR spectrum. All spectra were referenced to TSP δ = −0.016 ppm.
Data processing and multivariate analysis
All 1H NMR spectra were processed and analysed by ChenomX NMR Suite 8.0 (ChenomX Inc., Canada). Metabolic profiling allowed the identification of 66 metabolites in each sample. Metabolites were quantified using a target profiling approach as implemented in the ChenomX software. Processing of the raw data was carried out by normalizing the concentration of each metabolite to the overall concentration of all metabolites identified in the sample.1 The metabolite concentration data matrix was then analysed by methods of pattern recognition within The Unscrambler X 10.3 (CAMO software AS, Norway). Subsequently, principal component analysis (PCA) and linear discriminant analysis (LDA) were used to discriminate pancreatic cancer patients from healthy controls.Results and discussion
In the present pilot study, the metabolomic profiling of human plasma from pancreatic cancer patients and healthy controls using 1H NMR spectroscopy and multivariate analysis was performed.Profile of 1H NMR spectra of plasma samples
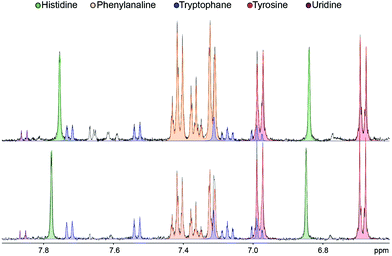
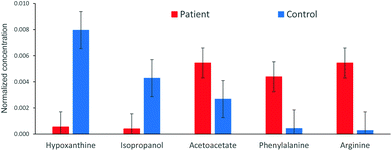
The analysis of the 1H NMR spectra allowed the assignment and quantitation of 66 metabolites in each blood plasma sample according to the ChenomX database. Significant differences were found in individual metabolite levels comparing the samples from pancreatic cancer patients and healthy controls. Namely, substantially increased levels in the patient group were found, e.g. for arginine, phenylalanine and acetoacetate, while the control samples primarily contained higher levels of hypoxanthine and isopropanol. The aromatic regions of representative 1H NMR spectra of both groups are depicted in Fig. 1. A bar chart of normalized concentration of selected metabolites illustrating the main differences between patients with pancreatic cancer and healthy controls is shown in Fig. 2. | ||
| Fig. 1 Aromatic region detail of 1H NMR spectra (CPMG, 500 MHz) of plasma samples of pancreatic cancer patients (top) and healthy controls (bottom). | ||
Statistical evaluation of the metabolic profile of pancreatic cancer
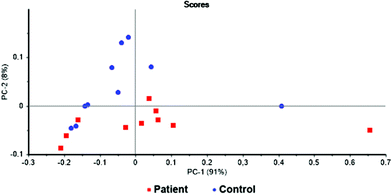
The first statistical model was based on all identified metabolites. For this purpose, the concentrations of potential biomarkers were normalized to the overall concentration of the selected metabolites.1 The discrimination of the examined groups was not satisfactory. Therefore, the PCA loadings of this model was used to identify metabolites of potential importance. The threshold value of principal components was set to ±0.020 and ±0.025 for PC1 and PC2, respectively. This lead to the selection of 20 metabolites. Apart from that, Wilcoxon rank-sum test10 was used to select other potentially significant metabolites. The threshold of P-value < 0.05 was set for the statistical significance and additional 14 metabolites were included into the new model. Thus, the new model consisted of 20 metabolites selected from the PCA loadings and 14 from the Wilcoxon rank-sum test. Further optimization of the model by removing and adding metabolites resulted in the models presented here. In all attempts, a certain trend of sample grouping was observed. The PCA of a model combining 6 metabolites can be seen in Fig. 3. The separation of two analysed groups is not complete, however, the trend of sample grouping within each group is obvious. Two of the analysed samples, one in each group, were identified as outliers. The loading plots of these two samples revealed considerably different metabolite levels from the rest of the group. Therefore, these two samples were excluded from the statistical analysis and two sets of 9 samples were used for the creation of the final statistical model for the discrimination of pancreatic cancer patients and healthy control subjects and submitted to PCA and LDA. | ||
Fig. 3 Scores graph of PCA for the samples of blood plasma of patients with pancreatic cancer ( ) and healthy controls ( ) and healthy controls ( ); PC1 + PC2 = 99% variability. ); PC1 + PC2 = 99% variability. | ||
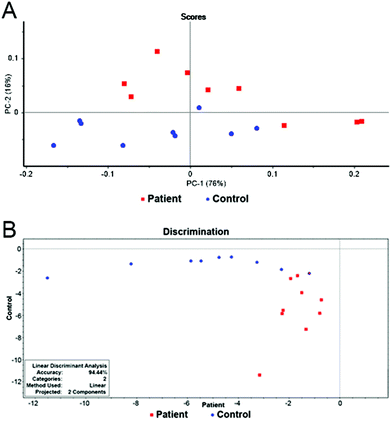
The final model combining 12 metabolites (3-hydroxybutyrate, lactate, glutamine, alanine, valine, lysine, citrate, histidine, isoleucine, glutamate, acetone and dimethylamine) in 18 samples provided a distinct separation of both groups. The results of PCA and LDA can be seen in Fig. 4. The overall accuracy of the statistical model reached 94%. Only one patient was misclassified, leading to the model sensitivity and specificity of 100% and 90% after leave-one-out cross validation, respectively (Table 2).
 | ||
Fig. 4 (A) Scores graph of PCA for the final model. (B) Graphical representation of the results of LDA for the final model. Patients with pancreatic cancer ( ) and healthy controls ( ) and healthy controls ( ). ). | ||
| From/to | Patient | Control | Total |
|---|---|---|---|
| Patient | 9 | 1 | 10 |
| Control | 0 | 8 | 8 |
| Total | 9 | 9 | 18 |
| Correct | 100% | 90% | 94% |
The multivariate statistical analysis of the obtained results revealed significant differences in levels of lactate and 3-hydroxybutyrate in the patient plasma compared to control samples. Other statistically significant metabolites were alanine, glutamine and valine.
Lactate is known as the product of anaerobic glycolysis and participates in many metabolic pathways, e.g. gluconeogenesis or pyruvate metabolism. It is associated with anoxia,11 schizophrenia,12 and also different types of cancer.13 Locally high concentrations of lactate were found near many tumours due to upregulation of lactate dehydrogenase. Lactate is also produced by tumours via aerobic glycolysis (Warburg effect) and it acts as an immunosuppressant and tumour promoter.13 Moreover, lactate has been identified as a key factor and/or regulator in the development and malignant progression of a variety of cancers. A number of studies have demonstrated that malignant transformation is associated with an increase in aerobic cellular lactate excretion.13
On the other hand, 3-hydroxybutyrate belongs to the ketone bodies, whose blood levels are increased in ketosis. In humans, 3-hydroxybutyrate is synthesized in the liver from acetyl-CoA and can be used by the brain as an energy source when blood glucose is low. This compound is also associated with specific inborn metabolism malfunctions,14e.g. deficiency of fumarase and medium-chain acyl-CoA dehydrogenase. Furthermore, it has been reported as a biomarker in the study of schizophrenia,15 Alzheimer's disease16 and cancer.17
Alanine is a non-essential amino acid serving as major energy source, which participates on glucose metabolism. Thus, its blood levels reflect blood sugar levels in diabetes. Alanine itself is able to manage hypoglycaemia and reduce ketosis in diabetic individuals. In addition, changes in alanine levels were reported with schizophrenia,18 colorectal cancer,19 lung cancer20 and pancreatic cancer,21 the latter of which is strongly associated with diabetes mellitus.
Glutamine, a non-essential amino acid, replenishes amino acid levels. Therefore, glutamine is recommended during fasting or for people, who suffer from physical trauma, immune deficiencies or cancer. Disorders associated with glutamine imbalance include Alzheimer's disease,16 colorectal cancer,17,19 leukemia22 and pancreatic cancer.21
Valine is also one of 20 proteinogenic amino acids, and it is classified as a branched-chain amino acid (BCAA). BCAA are essential to human life, as they are involved in energy and muscle metabolism, and in stress management. Several studies assigned valine as a biomarker for Alzheimer's disease,16 colorectal cancer17 and Crohn's disease.23
The obtained results indicate that the statistical model comprising of 12 metabolites may be used for the discrimination of pancreatic cancer patients from healthy subjects at high level of accuracy. The model also identified lactate, 3-hydroxybutyrate, alanine, glutamine and valine as potential metabolic markers of pancreatic cancer.
Conclusions
Based on principal component analysis and linear discriminant analysis of the 1H NMR metabolomic data obtained from plasma samples, pancreatic cancer patients and healthy controls can be distinguished with a high level of accuracy. In agreement with the literature data, the most significant differences between both groups were found in levels of 3-hydroxybutyrate and lactate. Other statistically significant metabolites were alanine, glutamine and valine, which may be regarded as a new panel of biomarkers of pancreatic cancer.The number of samples in the presented pilot study is limited and has to be significantly increased in the future in order to obtain solid statistical models and to confirm the current findings. Nevertheless, the obtained results provide support for the potential of 1H NMR spectroscopy in disease diagnosis. Hopefully, 1H NMR-based metabolomics may contribute to the early diagnosis, prevention and/or therapy of pancreatic cancer in the future.
Conflicts of interest
There are no conflicts to declare.Acknowledgements
The authors thank Prof. Miroslav Zavoral and Dr. Bohuš Bunganič from the Department of Gastrointestinal Endoscopy at the Internal Clinic of the Military University Hospital and the First Faculty of Medicine (Charles University in Prague, Czech Republic) for providing the plasma samples. The work was realized within grant no. 16-31028A provided by the Ministry of Health of the Czech Republic.References
- O. F. Bathe, R. Shaykhutdinov, K. Kopciuk, A. M. Weljie, A. McKay, F. R. Sutherland, E. Dixon, N. Dunse, D. Sotiropoulos and H. J. Vogel, Cancer Epidemiol., Biomarkers Prev., 2011, 20, 140–147 CrossRef CAS PubMed.
- M. Verma, Cancers, 2010, 2, 1830–1837 CrossRef PubMed.
- L. Zhang, H. Jin, X. Guo, Z. Yang, L. Zhao, S. Tang, P. Mo, K. Wu, Y. Nie, Y. Pan and D. Fan, Clin. Biochem., 2012, 45, 1064–1069 CrossRef CAS PubMed.
- H.-Y. Li, Z.-M. Cui, J. Chen, X.-Z. Guo and Y.-Y. Li, Tumor Biol., 2015, 36, 1375–1384 CrossRef CAS PubMed.
- K. Hanada, A. Okazaki, N. Hirano, Y. Izumi, Y. Teraoka, J. Ikemoto, K. Kanemitsu, F. Hino, T. Fukuda and S. Yonehara, J. Gastroenterol., 2015, 50, 147–154 CrossRef PubMed.
- G. K. Joshi, S. Deitz-McElyea, M. Johnson, S. Mali, M. Korc and R. Sardar, Nano Lett., 2014, 14, 6955–6963 CrossRef CAS PubMed.
- L. Habartová, B. Bunganič, M. Tatarkovič, M. Zavoral, J. Vondroušová, K. Syslová and V. Setnička, Chirality, 2018, 30, 581–591 CrossRef PubMed.
- I. F. Duarte, S. O. Diaz and A. M. Gil, J. Pharm. Biomed. Anal., 2014, 93, 17–26 CrossRef CAS PubMed.
- J. L. Markley, R. Brüschweiler, A. S. Edison, H. R. Eghbalnia, R. Powers, D. Raftery and D. S. Wishart, Curr. Opin. Biotechnol., 2017, 43, 34–40 CrossRef CAS PubMed.
- F. Wilcoxon, Biom. Bull., 1945, 1, 80–83 CrossRef.
- C. Zupke, A. J. Sinskey and G. Stephanopoulos, Appl. Microbiol. Biotechnol., 1995, 44, 27–36 CrossRef CAS PubMed.
- J. Yang, T. Chen, L. Sun, Z. Zhao, X. Qi, K. Zhou, Y. Cao, X. Wang, Y. Qiu, M. Su, A. Zhao, P. Wang, P. Yang, J. Wu, G. Feng, L. He, W. Jia and C. Wan, Mol. Psychiatry, 2013, 18, 67–78 CrossRef CAS PubMed.
- S.-P. Mauro, IUBMB Life, 2008, 60, 605–608 CrossRef PubMed.
- J. O. Sass, J. Inherited Metab. Dis., 2012, 35, 23–28 CrossRef CAS PubMed.
- T. Fukushima, H. Iizuka, A. Yokota, T. Suzuki, C. Ohno, Y. Kono, M. Nishikiori, A. Seki, H. Ichiba, Y. Watanabe, S. Hongo, M. Utsunomiya, M. Nakatani, K. Sadamoto and T. Yoshio, PLoS One, 2014, 9, e101652 CrossRef PubMed.
- M. Tsuruoka, J. Hara, A. Hirayama, M. Sugimoto, T. Soga, R. Shankle William and M. Tomita, Electrophoresis, 2013, 34, 2865–2872 CAS.
- Y. Ni, G. Xie and W. Jia, J. Proteome Res., 2014, 13, 3857–3870 CrossRef CAS PubMed.
- K. Q. Do, C. J. Lauer, W. Schreiber, M. Zollinger, U. Gutteck-Amsler, M. Cuénod and F. Holsboer, J. Neurochem., 1995, 65, 2652–2662 CrossRef CAS PubMed.
- T. L. Weir, D. K. Manter, A. M. Sheflin, B. A. Barnett, A. L. Heuberger and E. P. Ryan, PLoS One, 2013, 8, e70803 CrossRef CAS PubMed.
- D. S. Wishart, C. Knox, A. C. Guo, R. Eisner, N. Young, B. Gautam, D. D. Hau, N. Psychogios, E. Dong, S. Bouatra, R. Mandal, I. Sinelnikov, J. Xia, L. Jia, J. A. Cruz, E. Lim, C. A. Sobsey, S. Shrivastava, P. Huang, P. Liu, L. Fang, J. Peng, R. Fradette, D. Cheng, D. Tzur, M. Clements, A. Lewis, A. De Souza, A. Zuniga, M. Dawe, Y. Xiong, D. Clive, R. Greiner, A. Nazyrova, R. Shaykhutdinov, L. Li, H. J. Vogel and I. Forsythe, Nucleic Acids Res., 2009, 37, D603–D610 CrossRef CAS PubMed.
- M. Sugimoto, D. T. Wong, A. Hirayama, T. Soga and M. Tomita, Metabolomics, 2010, 6, 78–95 CrossRef CAS PubMed.
- C. T. Peng, K. H. Wu, S. J. Lan, J. J. P. Tsai, F. J. Tsai and C. H. Tsai, Eur. J. Cancer, 2005, 41, 1158–1163 CrossRef CAS PubMed.
- J. T. Bjerrum, Y. Wang, F. Hao, M. Coskun, C. Ludwig, U. Günther and O. H. Nielsen, Metabolomics, 2015, 11, 122–133 CrossRef CAS PubMed.
| This journal is © The Royal Society of Chemistry 2018 |

