
Vibrational spectroscopic monitoring and biochemical analysis of pericellular matrix formation and maturation in a 3-dimensional chondrocyte culture model
H. A.
Owida
a,
A. V.
Rutter
a,
G.
Cinque
b,
N. J.
Kuiper
a,
J.
Sulé-Suso
 ac and
Y.
Yang
*a
ac and
Y.
Yang
*a
aInstitute of Science & Technology in Medicine, University of Keele, Stoke-on-Trent, ST4 7QB, UK. E-mail: y.yang@keele.ac.uk
bDiamond Light Source Ltd, Harwell Science and Innovation Campus, Oxfordshire, OX11 0DE, UK
cCancer Centre, University Hospital of North Midlands, Stoke-on-Trent, ST4 6QG, UK
First published on 20th September 2018
Abstract
Isolated and monolayer expanded chondrocytes are not the ideal cell form to produce a cartilage matrix. In articular cartilage, each chondrocyte is surrounded by a 2–4 μm thick collagen VI-rich pericellular matrix (PCM) forming a chondron. Freshly extracted chondrons form a more cartilage-like extracellular matrix (ECM) than chondrocytes and their surrounding PCM is thought to maintain the chondrocyte phenotype. To regenerate articular cartilage, preserving and/or regenerating a functional PCM is essential. In this study, a highly biomimicking hyaluronic acid (HA) hydrogel was used as a 3-dimensional system to culture freshly isolated bovine chondrons (with an intact PCM) and chondrocytes (without a PCM) for up to 21 days. We assessed the HA hydrogel's capacity to maintain and potentially re-generate PCM formation by both biochemical and immunological analyses of the key components of the PCM. For the first time, synchrotron based Fourier transform infrared (SR-FTIR) microspectroscopy was utilised to reveal the dynamic process of PCM re-generation. At day 1, highly specific collagen VI staining was visible within chondron containing HA hydrogels. In contrast, collagen VI was absent at day 1 but punctate, focal staining increased during the culture period of chondrocyte containing HA hydrogels. Chondron containing HA hydrogels produced more collagen II and GAGs than the chondrocyte containing HA hydrogels. Principal component analysis (PCA) of spectra in fingerprint regions of the chondrocyte-containing constructs at day 7, 14 and 21 culturing showed clear spectral differences. The clusters of day 14 and day 21 samples were closer to the chondron samples, while the day 7 samples were closer to chondrocytes. PCA scores in the lipid region revealed no major differences between chondrocyte and chondron samples, but showed that the cultured chondrocyte samples at day 7, day 14 and day 21 clustered together. These data would indicate that SR-FTIR microspectroscopy can help to better understand the PCM formation and maturation in tissue engineered models, which involves subtle changes in collagen and aggrecan.
1. Introduction
Many aspects of tissue development and cell behaviour are governed by the interactions between cells and their surrounding extracellular matrix (ECM). Articular cartilage is a complex yet highly organised tissue with a unique ability to withstand large forces.1 It is composed of chondrons within a territorial matrix (TM) surrounded by a highly organised ECM comprising collagen II fibrils, proteoglycans (mainly aggrecan), glycosaminoglycans and non-collagenous proteins.2 Each chondrocyte is surrounded by a 2–4 μm thick collagen VI-rich pericellular matrix (PCM) to form a chondron. Collagen VI consists of three genetically distinct α-chains, secreted by chondrocytes as tetramers which self-assemble to form beaded heterogenic microfibrils.3 Microfibrillar organisation within the chondron is not fully understood but collagen VI is thought to anchor the chondrocyte to the PCM via β-integrin receptors and the transmembrane proteoglycan, NG2.4 Interestingly, freshly extracted chondrons form a more cartilage-like extracellular matrix (ECM) than chondrocytes5,6 and their surrounding PCM is thought to help maintain the chondrocyte phenotype. This information is particularly critical for the articular cartilage repair field. One of the drawbacks is the difficulty in isolating large numbers of chondrons from cartilage. The yield of chondrons tends to be around 60% less than the yield of chondrocytes. Since cartilage cell therapy and regeneration strategies generally utilise culture-expanded isolated autologous chondrocytes, it would be useful to improve PCM formation and maturation. For cultured isolated chondrocytes, the rebuilding, maturation and subsequent maintenance of the PCM have a significant influence on cell–matrix interactions and, consequently, the function of engineered cartilage-like tissue.1,6 Research findings from previous studies have underlined the importance of the PCM for the maintenance of the chondrocyte phenotype.5,6 During monolayer culture, chondrocytes de-differentiate, changing from round to elongated morphology, and switch from collagen II to collagen I production7 and reduce GAG production.8Simply growing isolated chondrocytes in 3D pellet culture leads them to form a chondron-like structure, but this structure does not produce the cartilage ECM as effectively as native chondrons. Several studies have confirmed that using well characterised hydrogels, agarose9 and alginate6 led to improvement of ECM deposition. However, there was no report on how culturing chondrocytes in the hyaluronic acid (HA) hydrogel, the main ECM component of native cartilage, improved ECM and PCM maintenance and regeneration.
ECM and PCM formation and maturation were usually monitored as well through a range of different approaches such as metachromasia, biochemistry and immunolocalisation techniques. For example, metachromatic stains such as toluidine blue and alcian blue have been widely used to detect the presence of GAGs and their associated proteoglycans (mainly aggrecan).8,10 The dimethylmethylene blue assay is widely used for the quantification of total sulphated GAGs11 but it can be inaccurate due to interference from polyanions. Metachromasia only provides a crude assessment and a limited amount of information. Biochemical assays such as total collagen analysis or western blotting using immunolocalisation have been utilised to assess protein accumulation (mainly collagen type II but also collagen VI).6 These techniques are useful but to characterise both articular cartilage and chondrons at the microscale level it will be necessary to develop additional techniques which can resolve micron-scale structural changes and differences during chondrocyte culturing.
Biological structures like human tissue and cells can be studied using Fourier Transform Infrared (FTIR) microspectroscopy. The advantage of using the FTIR technique is that a single spectrum can reveal various important biomolecules simultaneously such as lipids, proteins, carbohydrates and nucleic acids. Each biomolecule produces its spectral signature depending on the nature of the bonds and concentrations of the molecules.12 A synchrotron source for FTIR provides a more powerful probe for the study of cells and tissues, thanks to its higher IR brightness which enables using smaller apertures and provides higher sensitivity to better identify the spatial heterogeneity of biomolecules in single cells with as small as 5 μm apertures, offering spatial distribution of chemical components and their concentrations at the micron scale.13,14 Furthermore, FTIR is a non-destructive identification tool with less sample preparation and provides integral information.
Several studies have been conducted using IR spectroscopy on articular cartilage tissue and engineered constructs. Camacho et al. (2001)15 presented univariate parameters to quantify collagen and proteoglycan contents in articular cartilage. Amide I (1584–1720 cm−1) was shown to correlate with the collagen content, and the carbohydrate region (984 cm–1140 cm−1) correlated with the proteoglycan content in pure compound mixtures of collagen and aggrecan. The FTIR data analysis showed that tissue-engineered cartilage had more collagen and fewer proteoglycans than the native cartilage. A subsequent study reported that proteoglycan quantification could be enhanced by normalising the spectra of the carbohydrate region to amide I in tissue-engineered cartilage, which reduced the thickness variation in the cartilage tissue sections. A statistically significant correlation was obtained between FTIR spectral and alcian blue staining.16 However, there are no studies to assess the evolution process of PCM formation in tissue engineered constructs by synchrotron FTIR microscopy (SR-FTIR) analysis, in particular to define the chemical compositions of the newly generated PCM in a HA 3D model.
Herein our study aims to develop a 3D culture model using bovine-derived cells that facilitates the preservation, re-building and maturation of the PCM. We compare enzymatically isolated chondrocytes and chondrons across a time course using widely used biochemical and immunological analytical cartilage tools in combination with a novel synchrotron micro-FTIR approach.
2. Materials and methods
2.1 Chondrocyte and chondron isolation
Full depth articular cartilage was dissected from the articulating surface of the trochlea of humerus of 18-month-old cows, which were collected from a local abattoir. Four separate isolations were performed, each using one humerus. Chondrocyte and chondron isolations were performed according to our previous methods.8 Briefly, diced cartilage was sequentially digested with 0.1% (w/v) proteinase K for 1 hour and then 0.3% (w/v) collagenase type IA for 3 hours. Chondrocytes from the supernatant were strained and collected through a 70 μm cell sieve. For chondron isolation, diced cartilage was digested with 0.3% (w/v) dispase and 0.2% (w/v) collagenase type XI in DMEM for 5 hours. Chondrons from the supernatant were strained and collected through a 70 μm cell sieve.2.2 Preparation of hyaluronic acid and agarose hydrogels
Hyaluronic acid (HA) sodium salt powder with an average molecular weight of 1.5 × 10⁶ Da was supplied by Shangdong Freda Biopharm Co., Ltd China. The HA gel was prepared by crosslinking of HA molecules with 1,4-butanediol diglycidyl ether (BDDE; Sigma) as a crosslinker according to an established protocol.17 The cross-linked HA gel was pulverised with a homogenizer to obtain mini gel particles of 0–400 μm. A mixture of homogenised crosslinked HA gels and 2% (w/v) agarose (melting point, 26 °C, Sigma) hydrogel at a ratio of 9![[thin space (1/6-em)]](https://www.rsc.org/images/entities/char_2009.gif) :1 was used to enable the gel to be reconstructed with the required shape and thickness.
:1 was used to enable the gel to be reconstructed with the required shape and thickness.
2.3 Fabrication of 3D cartilage models
All samples were cultured in 96 well-plates. For cell embedding to the hydrogel, 75 μL of hydrogel solution were cast first; after 30 minutes of polymerisation, 5 × 10³ cells per well were seeded and allowed to attach at 37 °C for 2 hours. Following this incubation period, 75 μL of hydrogel solution were dispensed into individual wells. The encapsulated 3D constructs were incubated with DMEM supplemented with 10% FBS for 21 days at 37 °C with 5% CO2. Different culture time points, day 1 (D1), day 7 (D7), day 14 (D14) and day 21 (D21), were sampled. The isolated chondrocytes (CY) (naturally without PCM) and chondrons (CN) (naturally with PCM) were negative and positive controls, respectively.2.4 Biochemical assays
The total cell number and GAG production were analysed by digesting samples at given culturing time points. The experimental samples were separately digested with 300 μL papain solution per sample for 8 hours at 60 °C by an established protocol.8,112.5 Immunolocalisation of key chondrogenic markers
Immunofluorescence staining was performed using primary antibodies against the following components in the PCM: collagen VI (goat; Santa Cruz) and collagen II (mouse; Abcam). All samples were subjected to an unmasking treatment prior to the staining in accordance with an established protocol.8 Articular cartilage was used as a positive control. The fluorescence intensities of all samples were evaluated by confocal microscopy (CLSM; Fluoview Version 4.1, Olympus, UK) using the same exposure setting. The intensity of immunofluorescence staining was semi-quantified using the ImageJ software. Three randomly selected areas from three images were analysed for each group.2.6 Histological analysis of proteoglycans
The hydrogel was removed by using a 45 °C water bath for 45 seconds at 1, 7, 14 and 21 days. The resulting product was centrifuged at 750g; the released cells were re-suspended in 0.9% (w/v) NaCl. Cell suspensions were cytospun onto slides for 2 minutes at 1000 rpm. Once the cells were deposited on slides, the samples were fixed with formalin at room temperature for 30 minutes. Formalin was discarded and the samples were washed three times with PBS. The fixed samples were stained for the deposited sGAG using toluidine blue staining. The stained cell layer was examined under a light microscope (Evos microscope AMEX-1100).2.7 Synchrotron FTIR spectroscopy
The spectral acquisition and analysis by SR-FTIR microspectroscopy were carried out at MIRIAM beamline B22 at Diamond (Diamond Light Source, Oxfordshire, UK). A Vertex 80 V FTIR spectrometer coupled to a Hyperion 3000 IR microscope fitted with a 36× magnification objective/condenser optics was used. Cell samples were prepared on a ZnS slide (0.5 mm thick) via cytospinning. Prior to the cytospinning, the hydrogel was removed by heating the samples in a 45 °C water bath for 45 seconds. Cells were centrifuged at 750g for 2 minutes, and the released cell pellets were resuspended in 0.9% NaCl. Cell suspensions were cytospun onto ZnS slides for 2 minutes at 1000 rpm. As soon as the cells were deposited on the slides, the samples were fixed using 4% paraformaldehyde, then washed with 0.9% NaCl and dried for further analysis. Spectra were collected using a 10 × 10 μm2 aperture with a spatial resolution of 4 cm−1 and 40 second acquisition time per sample. Background measurements were taken from areas of the substrate that were free of any sample material. Transmission mode was used for all measurements. For each sample, 40 individual cells were measured. The Unscrambler software (Version X, Camo, Oslo, Norway) was used to process the FTIR spectra to correct the baseline; the spectra were also normalised (Standard Normal Variate (SNV)) and smoothed. Initially, the spectra were cut off to the area of interest for each analysis. The spectra were cropped to the region of 2700–3100 cm−1 covering the lipid region and 800 cm−1–1800 cm−1 for the fingerprint region. SNV normalisation was performed after the baseline correction, which involves subtracting the mean spectrum and then dividing by the standard deviation for each spectrum. This helped to remove the effect of the sample thickness as well as any baseline offset that may occur. The principal component analysis (PCA) was performed through an unsupervised analysis that reduced large numbers of variables (microFTIR spectral vectors) into a few principal components (PC) (that were calculated from the covariance of the data set being analysed). Thus, it was able to identify where differences occurred in the data sets. PC scores were obtained from data sets and used to plot the variance on a 2D axis. The position of the score on the axis represented the relative position of variance about the other plots of variance.2.8 Statistical analysis
For each analysis, data are expressed as mean ± standard error of the mean (SEM). Statistical analyses were performed with the SPSS statistical software (15.0). All experimental groups had a sample size of at least 3 for biochemical analyses with three independent experiments being carried out. Statistical significance was determined by performing one-way ANOVA, followed by a Tukey's post-test. Significance was accepted at a p-value <0.05.3. Results
3.1 Chondrons produced more ECM than chondrocytes in the 3D culture system
The cell number, as assessed by DNA quantification, is shown in Fig. 1A and the total amount of sGAG is shown in Fig. 1B. There was no major difference in the cell numbers between chondrons and chondrocytes in day 1 culture. However, chondrocytes showed significantly faster proliferation than chondrons in later culture points. The increase of sGAG production per cell with time (Fig. 1C) revealed that, across the time course, sGAG production per cell in the chondron group was significantly higher than that of the chondrocyte group at all time points (p < 0.05).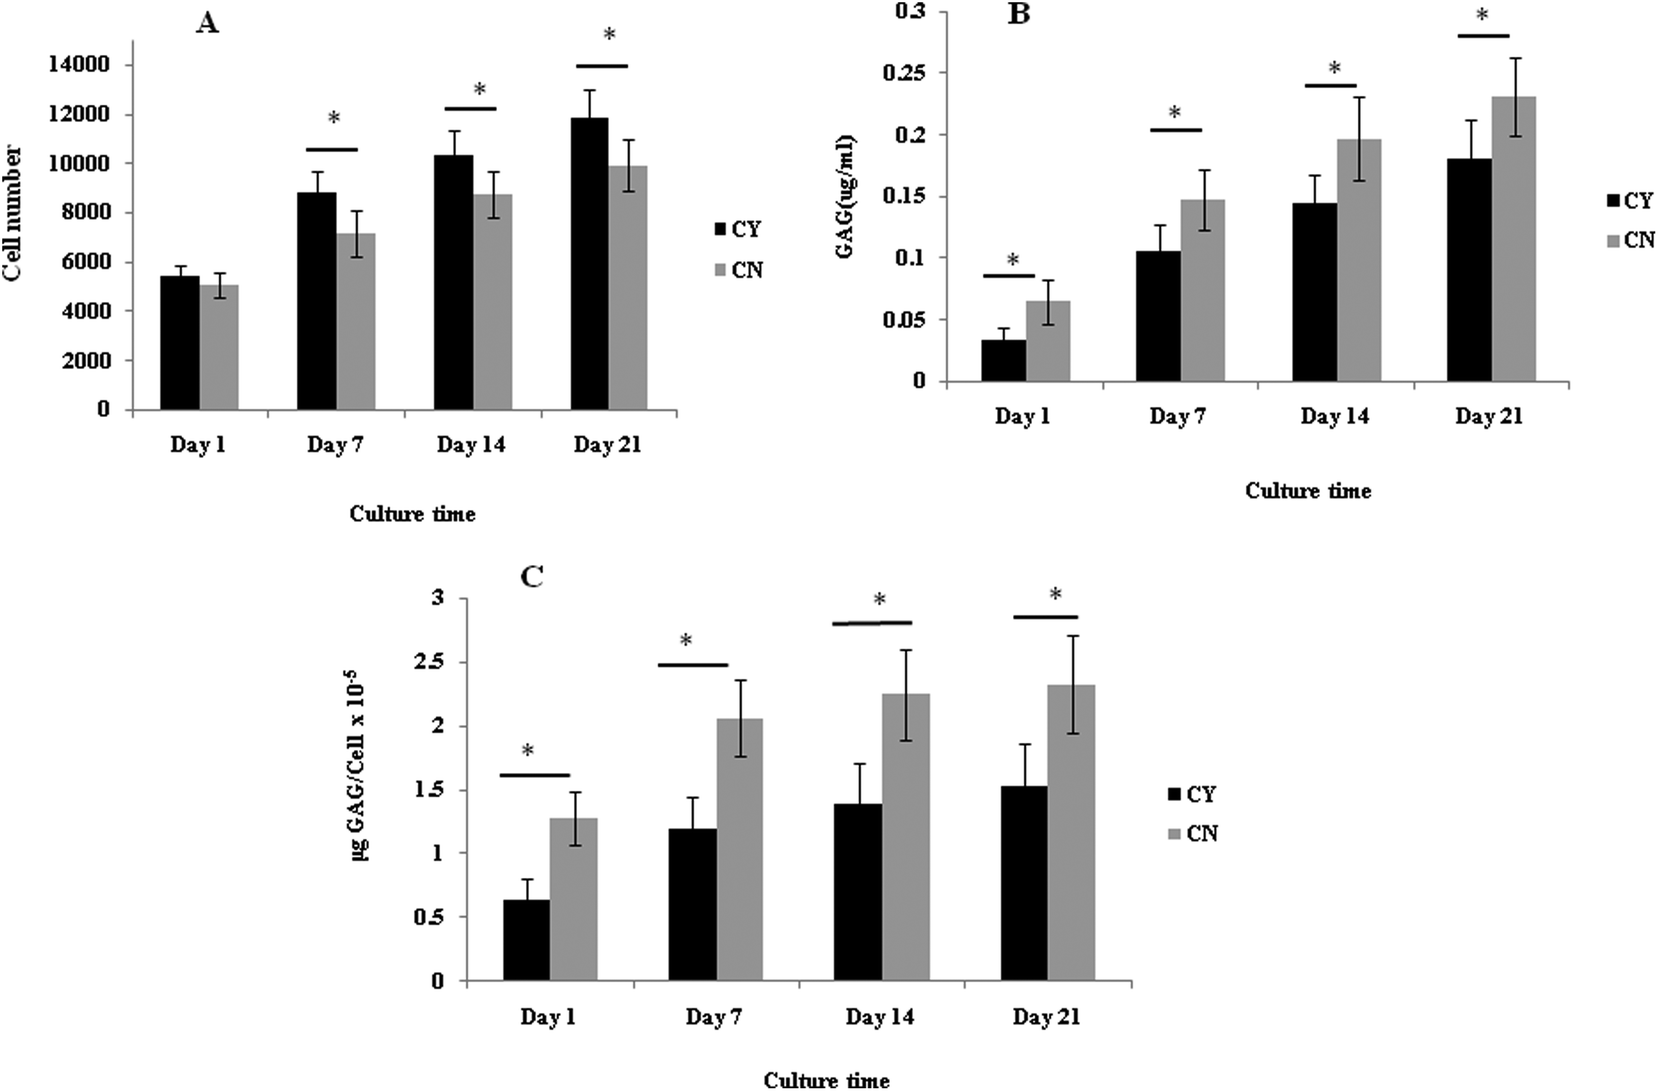 | ||
| Fig. 1 Biochemical analysis. (A) Cell number, (B) total content of GAG, and (C) normalisation of the GAG content, μg per cell. Data are expressed as mean ± SEM (n = 3). *Indicates statistical significance by one-way ANOVA analysis. | ||
Metachromatic staining with toluidine blue was used to detect the presence and distribution of aggrecan and its GAGs (Fig. 2). The staining intensity increased across the culture for both chondron and chondrocyte preparations. The staining intensity correlated well with the total sGAG (Fig. 1).
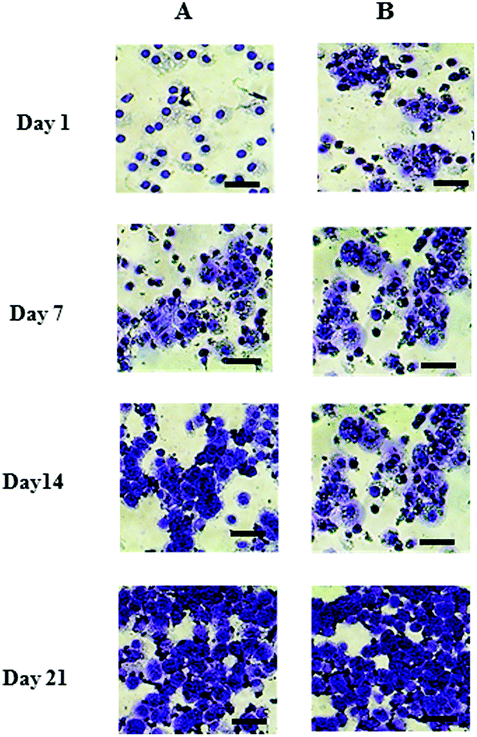 | ||
| Fig. 2 Representative toluidine blue stained day 1, 7, 14 and 21 culture with (A) chondrocytes and (B) chondrons. The scale bars represent 50 μm. | ||
3.2 Chondrocytes re-built and maintained their PCM in the 3D culture system
Fig. 3 shows the immunofluorescence staining to identify the key markers of the PCM (collagen VI) and ECM (collagen II). At day 1, chondrocyte-containing HA gels were negative for collagen VI but over time punctate collagen VI staining was highly localised on the chondrocyte surface and appeared to increase or mature with time (Fig. 3I panel A). By contrast, more diffuse collagen VI staining was apparent and remained focal to the cell throughout in the chondron containing HA gel throughout the culture period (Fig. 3I panel B). Collagen II staining was evident throughout the time course, and the quantity differed between chondrocyte containing and chondron containing HA gels (Fig. 3II). The semi-quantification calculation of the staining intensity supported the image observation (Fig. 3III–VI).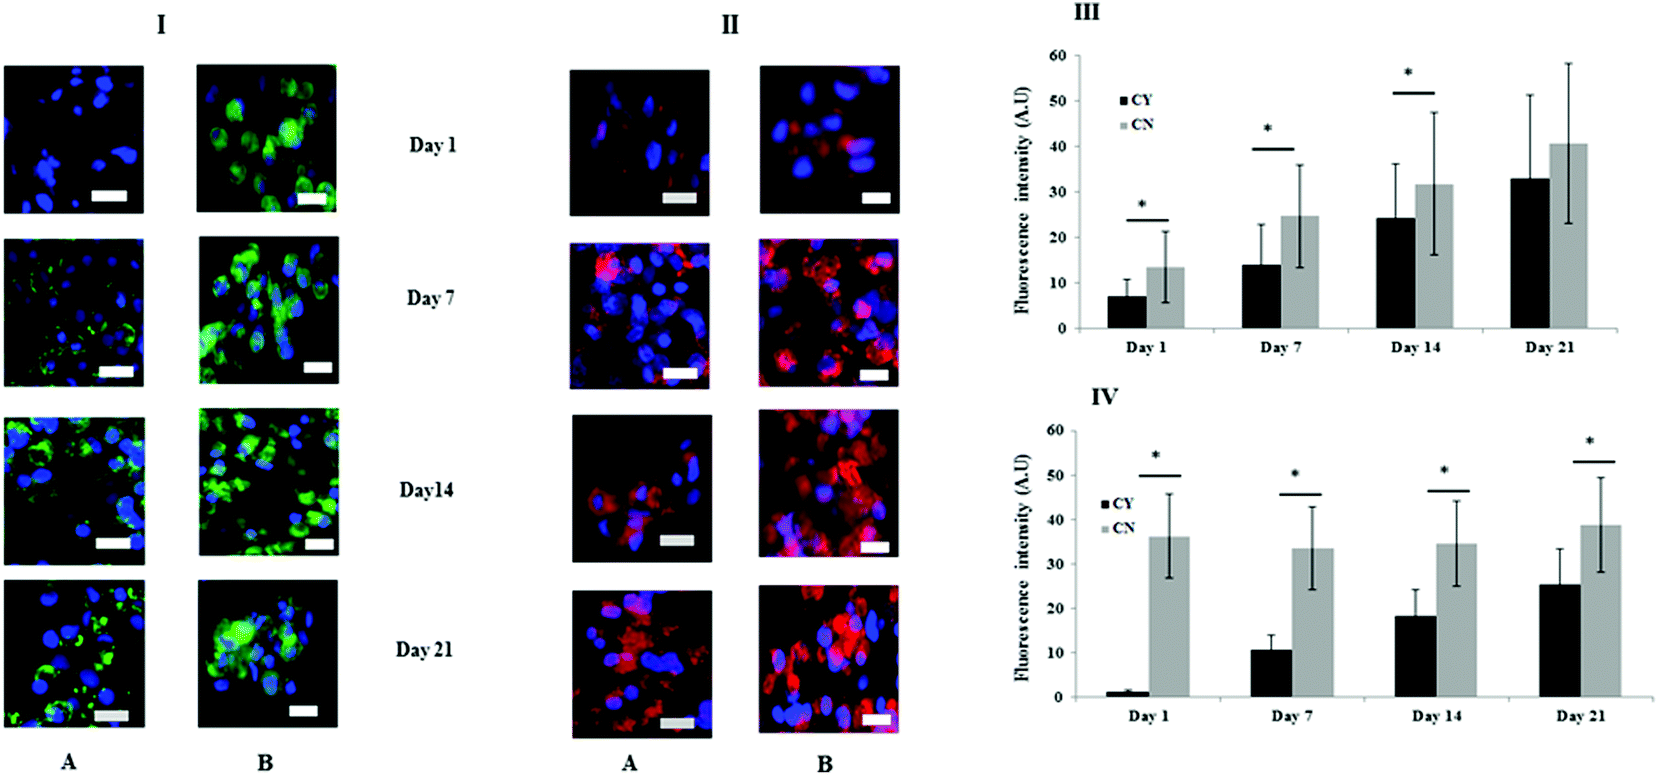 | ||
| Fig. 3 Representative immunofluorescence stained images of chondrocytes (A) and chondrons (B) at days 1, 7, 14 and 21. The cells were stained for collagen VI (green) in panel I and collagen II (red) in panel II. The cells were counter-stained by DAPI (blue). The semi-quantitative expressions of collagen II and VI were plotted in panels III and IV through ImageJ analysis of the pictures in panels I and II, respectively. Data are expressed as mean ± SEM (n = 3). *Indicates statistical significance by one-way ANOVA analysis. The scale bars represent 20 μm. | ||
3.3 FTIR spectral analysis was able to differentiate chondrocytes from chondrons in the 3D culture system
The spectra of both group cells exhibited typical cellular characteristics with considerable variations between the chondron and chondrocyte groups, and at different culture time points. Their SR-FTIR spectra were divided into two regions: the fingerprint region, which correlates explicitly with collagen and the proteoglycan content, and the lipid region. Fig. 4 shows the mean spectra of different experimental groups for the fingerprint region (1000–1800 cm−1) and the lipid region (2700–3100 cm−1). Each of the mean spectra was produced from at least 40 cells. The mean spectra in the 1000–1800 cm−1 region showed considerable differences in amide III and proteoglycan peaks with the intensity increasing with the culture time. The differences of mean spectra between the groups in the 2700–3100 cm−1 region were relatively small with a slight peak position shift between the chondron (2920 cm−1) and chondrocyte (2940 cm−1) groups, and cultured chondrocyte groups at 2920 cm−1.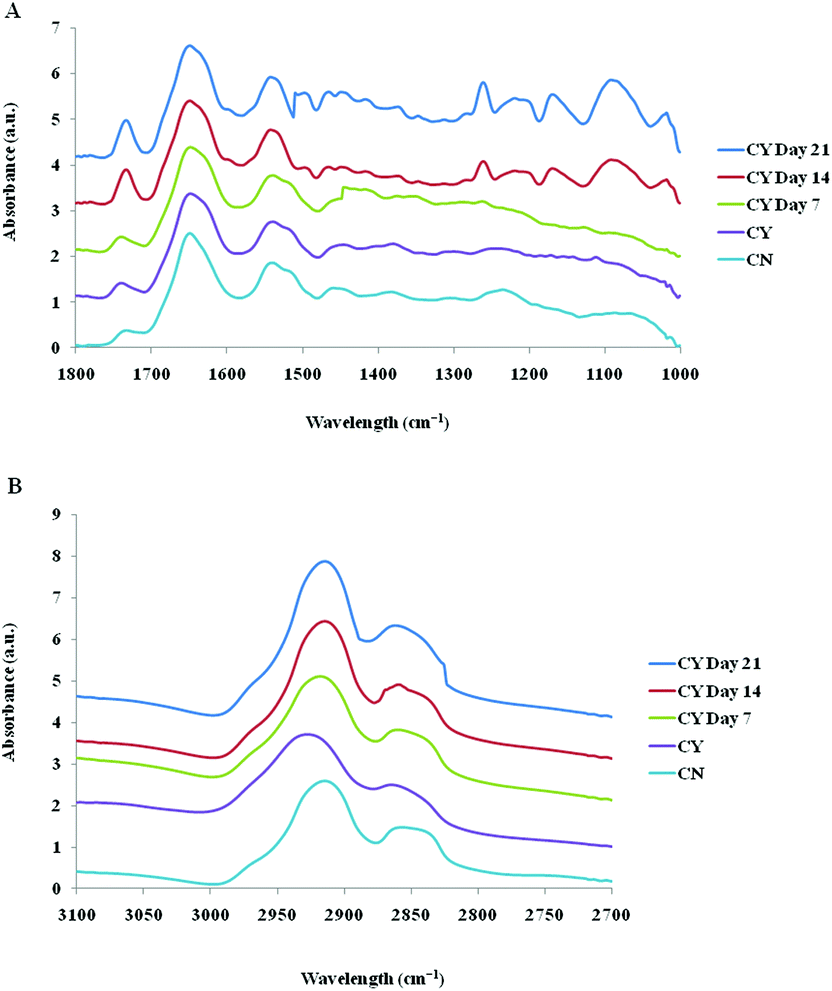 | ||
| Fig. 4 Mean spectra of 40 cells for the fingerprint region (A) and the lipid region (B) for different experimental groups; controls: chondrons (CN) and chondrocytes (CY); cultured chondrocytes in the HA hydrogel at day 7, day 14, and day 21. | ||
To extract the main difference between groups and controls, the Unscrambler Software was used to analyse the acquired spectra. PCA and loading plots were used to visualise the differences between the spectra and where those differences lie. Fig. 5 shows the PCA scores and the loading plots respectively for positive control groups, chondron and chondrocyte groups (Fig. 5A), and cultured chondrocyte groups at different culture time points (Fig. 5B) in the fingerprint region. Fig. 5A shows a distinct clustering of chondrons and chondrocytes in the PCA scores. When plotting the PCA scores of cultured chondrocyte groups at day 7, 14, and 21 culturing points, there was clear separation between the chondron and chondrocyte groups, with day 7 samples close to chondrocytes and with day 21 samples overlapping with chondron clusters.
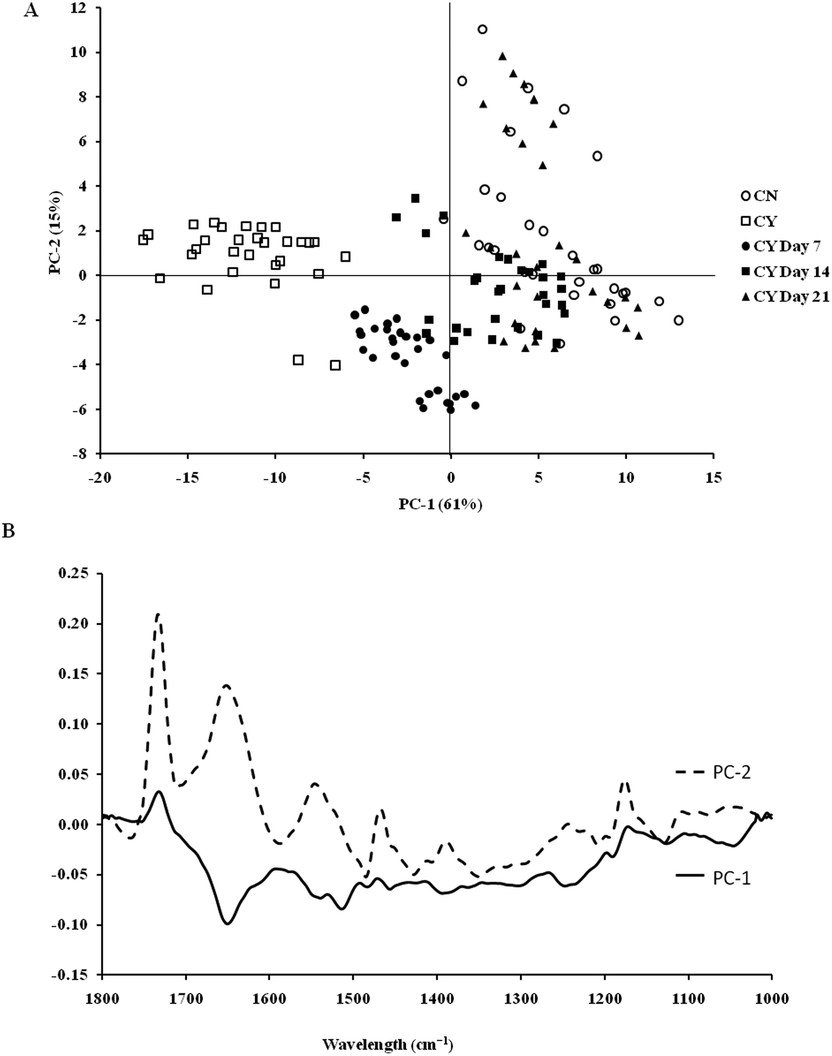 | ||
| Fig. 5 PCA score (A) and loading plots (B) of the different experimental groups: cultured chondrocytes in the HA hydrogel at day 7, day 14, and day 21 and controls: chondrons (CN) and chondrocytes (CY) for the fingerprint regions. | ||
On the other hand, the PCA scores and the loading plots for the lipid region (2700–3100 cm−1) showed less separation between chondron and chondrocyte groups (Fig. 6A). The PCA scores and loading plots for chondrocytes in day 7, day 14 and day 21 culture samples clustered together but not close to either chondron or chondrocyte clusters (Fig. 6B).
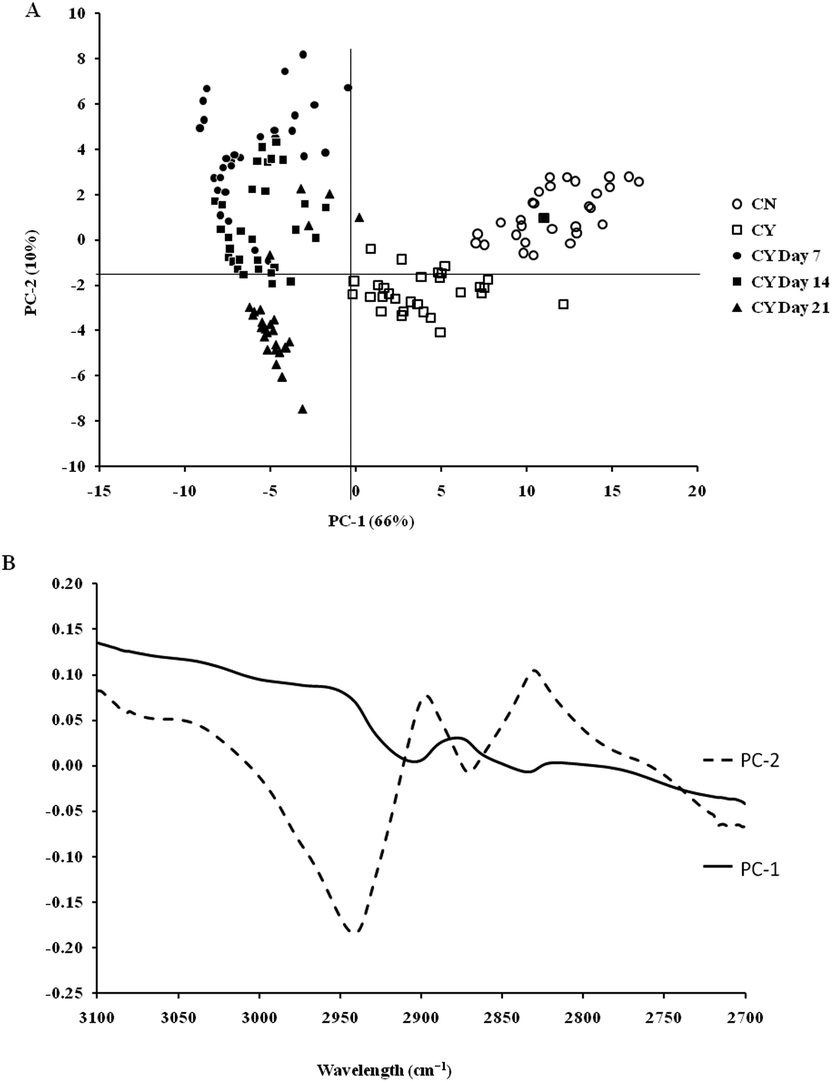 | ||
| Fig. 6 PCA score (A) and loading plots (B) of the different experimental groups: cultured chondrocytes in the HA hydrogel at day 7, day 14, and day 21 and controls: chondrons (CN) and chondrocytes (CY) for the lipid regions. | ||
4. Discussion
There is increasing evidence to support the finding that chondrons have greater potential for ECM production than chondrocytes and are better cell sources for cartilage matrix production.6 Different culture environments have been proposed to generate the ECM but few studies have focused on the importance of rebuilding and then maintaining the PCM. The latter is very important for both cell therapy and regenerative approaches for cartilage injuries. Herein, we report a biomimicking 3D hydrogel culture environment which supported ECM and PCM elaboration for chondrocytes and show that the specifically formulated HA hydrogel can rebuild and maintain a PCM-like structure at a faster rate than those in previous reports,6,9 confirmed by collagen VI immunolocalisation. To explore a non-destructive and label-free technique, for the first time, the synchrotron micro-FTIR technique has been used to reveal PCM rebuilding and maturation by chondrocytes. The novel FTIR data correlated well with the immunohistological and other biochemical analyses, confirming that FITR can offer a new tool to probe regenerative cartilage tissues in order to gain a more complete and detailed view of their developing processes.A key marker of the PCM microenvironment is collagen VI,18 which is known to interact with other macromolecules such as collagen II,19 proteoglycan and hyaluronan.20 All the evidence to date implies that collagen VI plays a major role in the maintenance of the chondrocyte phenotype.
The chemical and physical environments of the ECM in native cartilage can be better mimicked by using highly hydrated hydrogels.21 Although the PCM was detected in 3D agarose and alginate hydrogel culture6,9 using chondrocytes as a narrow ring of collagen VI around the cells after 7 day and 25 day culture, respectively, we detected a clearly denser PCM in the chondrocyte culture after 7 days. Such rapid regeneration of the PCM might benefit from the HA interaction with chondrocytes. HA shows low non-specific protein absorption. In addition, HA is known to interact with chondrocytes through CD44 surface receptors,22 which enable chondrocytes to retain their round shape as well as their chondrogenic capacity.23 Our data confirmed that chondrocytes can produce a similar GAG amount to chondrons in the HA hydrogel if left for an appropriately long culture time, while PCM maturation required a longer time.
This study has shown that the cultured chondrons formed a more cartilage-like ECM (collagen II and GAG) and led to better hyaline cartilage production in a 3D hydrogel microenvironment than using chondrocytes. The preserved PCM indicated by strong collagen VI staining in all chondron included groups confirmed the higher ECM production in the groups. Although we used a different species, the trend in results agreed with that of Vonk et al.'s (2010)6 study in which goat's chondrons and chondrocytes were cultured for 25 days in alginate beads, and it has been demonstrated that maintaining the native chondrocyte's PCM enhanced the cartilage marker (collagen type II and GAG) production. Cell–matrix interactions play an important role in the proliferation, differentiation and survival of chondrocytes.24 Overall, in this study, the hydrogel culture supported the deposition of cartilage-specific matrix markers including GAGs, collagen II and the unique marker of PCM collagen VI, which promoted rebuilding a cartilaginous-like ECM.
SR-FTIR microscopy is a non-destructive analytical tool which provides higher spectral sensitivity at micron spatial resolution which is key for single cell analysis. It can provide the molecular distribution of proteins, proteoglycans and lipids, and associated concentrations within a single spectrum. The PCA was performed as an unsupervised analysis that reduces large numbers of variables (micro-FTIR spectral vectors) into a few principal components (PC). Hence PCA analysis can demonstrate whether there are high levels of variance within a spectrum. There was a clear spectral difference between chondrocyte and chondron samples. The PCA scores for the fingerprint region showed that control chondrocytes and those incubated at day 7 had major difference from chondrons than chondrocytes incubated at day 14 and day 21. However, there was little difference between chondrons and day 21 samples. The PCA scores in the lipid region showed no difference between chondrocyte and chondron samples, but a clear difference from samples at day 7, day 14 and day 21. As captured in the fingerprint region, the loadings show similar spectra for PC1 and PC2, with the main differences observed around 1550 cm−1 which implies that there were changes in the amide II stretching, C–N stretching and N–H bending which correlated with the collagen concentration.12,15 The difference around ∼1240–1310 cm−1 implied that there were changes within the amide III band components in protein C–N stretching, N–H bending, C–C stretching and SO−3 asymmetric stretching vibrations of sulphated GAGs.12,15 The lipid region loadings displayed a difference at 3000 cm−1 which was indicative of CH2 and CH3 stretching and also at ∼2950 and 2850 cm−1 which also indicated a change in the symmetrical C–H stretching of CH2 within lipid membranes.12,25 Reports have demonstrated that there is a N–H (NH3+) stretching peak in the 2800 cm−1 region,26 implying that the lipid region could contain protein information as well. The main difference between chondrocytes and chondrons is the presence and absence of the PCM, i.e. protein types and concentrations. We speculate that the gradual increase of the PCM in chondrocytes during the culture may be ascribed to the subtle spectral difference in this region between samples from different culture times and from chondrons.
According to the PCA scores, the clusters of day 14 and day 21 constructs with chondrons indirectly demonstrated that chondrocytes cultured under the current conditions might generate a chondron-like cell phenotype. The presence of the PCM on day 14 and day 21, which contained collagen type VI and proteoglycans, could explain their similarity of spectra to chondrons, not chondrocytes. These data shed light to reveal the cellular evolution of cultured chondrocytes in the tissue-engineered cartilage model by the SR-FTIR microspectroscopy technique. The limitation of the synchrotron technique is the difficulty in applying the measurement for cell culture well plates (due to the special source and the high running costs); therefore following on from this experiment, the discovered regions of interest will be taken and an alternative FTIR benchtop instrument will be sought to see if these differences can be found using an instrument of lower resolution. Experiments will also be continued to see if the inclusion of cell culture plastics is possible.
5. Conclusion
This study demonstrated that the HA 3D culture systems could reserve or restore the chondrogenic phenotype of cartilage cells during the culture. The 3D culture preserved the PCM in chondrons from day 1 to day 21 culture. In addition, the appearance of collagen VI in the cultured chondrons was dense and homogeneous. The 3D culture of chondrocytes had the ability to regenerate the PCM manifesting as the gradual production of collagen VI along the culture. The variation of the collagen VI concentration was strongly dependent on culture conditions. In contrast to the collagen VI appearance in the chondron culture, the newly formed collagen VI was punctate and less dense. The dynamic evolution of the structure and composition during the culture has been shown by using the synchrotron FTIR microspectroscopy technique via analysis of spectral changes in particular in both lipid and fingerprint regions. The fingerprint region analysis of the FTIR spectrum demonstrated that the cultured chondrocytes might generate a chondron-like cell morphology specifically at day 14 and day 21. The presence of the PCM on day 14 and day 21, which contained collagen type VI and proteoglycans, could explain their similarity of spectra to those of chondrons and not to those of chondrocytes by PCA analysis. The spectral analysis of the lipid region further supported these speculations.Conflicts of interest
There are no conflicts to declare.Acknowledgements
The beamtime awarded in Diamond Light Source MIRIAM B22 (SM17530-1) is highly appreciated.References
- Z. Zhang, Chondrons and the pericellular matrix of chondrocytes, Tissue Eng., Part B, 2014, 21(3), 267–277 CrossRef PubMed.
- C. A. Poole, M. H. Flint and B. W. Beaumont, Morphological and functional interrelationships of articular cartilage matrices, J. Anat., 1984, 138(Pt 1), 113 Search PubMed.
- J. Fitzgerald, P. Holden and U. Hansen, The expanded collagen VI family: new chains and new questions, Connect. Tissue Res., 2013, 54(6), 345–350 CrossRef CAS PubMed.
- K. S. Midwood, L. V. Williams and J. E. Schwarzbauer, Tissue repair and the dynamics of the extracellular matrix, Int. J. Biochem. Cell Biol., 2004, 36(6), 1031–1037 CrossRef CAS PubMed.
- C. M. Larson, S. S. Kelley, A. D. Blackwood, A. J. Banes and G. M. Lee, Retention of the native chondrocyte pericellular matrix results in significantly improved matrix production, Matrix Biol., 2002, 21(4), 349–359 CrossRef CAS PubMed.
- L. A. Vonk, B. Z. Doulabi, C. Huang, M. N. Helder, V. Everts and R. A. Bank, Preservation of the chondrocyte's pericellular matrix improves cell-induced cartilage formation, J. Cell. Biochem., 2010, 110(1), 260–271 CAS.
- J. Bonaventure, N. Kadhom, L. Cohen-Solal, K. H. Ng, J. Bourguignon, C. Lasselin and P. Freisinger, Reexpression of cartilage-specific genes by dedifferentiated human articular chondrocytes cultured in alginate beads, Exp. Cell Res., 1994, 212(1), 97–104 CrossRef CAS PubMed.
- H. A. Owida, T. H. Ruiz, A. Dhillon, Y. Yang and N. J. Kuiper, Co-culture of chondrons and mesenchymal stromal cells reduces the loss of collagen VI and improves extracellular matrix production, Histochem. Cell Biol., 2017, 148(6), 625–638 CrossRef CAS PubMed.
- J. Chang and C. A. Poole, Confocal analysis of the molecular heterogeneity in the pericellular microenvironment produced by adult canine chondrocytes cultured in agarose gel, Histochem. J., 1997, 29(7), 515–528 CrossRef CAS PubMed.
- M. A. Dimicco, J. D. Kisiday, H. Gong and A. J. Grodzinsky, Structure of pericellular matrix around agarose-embedded chondrocytes, Osteoarthritis Cartilage, 2007, 15(10), 1207–1216 CrossRef CAS PubMed.
- R. W. Farndale, D. J. Buttle and A. J. Barrett, Improved quantitation and discrimination of sulphated glycosaminoglycans by use of dimethylmethylene blue, Biochim. Biophys. Acta, Gen. Subj., 1986, 883(2), 173–177 CrossRef CAS.
- Biological and biomedical infrared spectroscopy, ed. A. Barth and P. I. Haris, IOS press, 2009 Search PubMed.
- L. M. Miller and R. J. Smith, Synchrotrons versus globars, point-detectors versus focal plane arrays: Selecting the best source and detector for specific infrared microspectroscopy and imaging applications, Vib. Spectrosc., 2005, 38(1–2), 237–240 CrossRef CAS.
- A. J. Deegan, G. Cinque, K. Wehbe, S. Konduru and Y. Yang, Tracking calcification in tissue-engineered bone using synchrotron micro-FTIR and SEM, Anal. Bioanal. Chem., 2015, 407(4), 1097–1105 CrossRef CAS PubMed.
- N. P. Camacho, P. West, P. A. Torzilli and R. Mendelsohn, FTIR microscopic imaging of collagen and proteoglycan in bovine cartilage, Biopolymers, 2001, 62(1), 1–8 CrossRef CAS PubMed.
- M. Kim, X. Bi, W. E. Horton, R. G. Spencer and N. P. Camacho, Fourier transform infrared imaging spectroscopic analysis of tissue engineered cartilage: histologic and biochemical correlations, J. Biomed. Opt., 2005, 10(3), 031105 CrossRef PubMed.
- H. A. Owida, R. Yang, L. Cen, N. J. Kuiper and Y. Yang, Induction of zonal-specific cellular morphology and matrix synthesis for biomimetic cartilage regeneration using hybrid scaffolds, J. R. Soc., Interface, 2018, 15(143), 20180310 CrossRef PubMed.
- C. A. Poole, M. H. Flint and B. W. Beaumont, Chondrons in cartilage: ultrastructural analysis of the pericellular microenvironment in adult human articular cartilages, J. Orthop. Res., 1987, 5(4), 509–522 CrossRef CAS PubMed.
- D. J. Bidanset, C. Guidry, L. C. Rosenberg, H. U. Choi, R. Timpl and M. Hook, Binding of the proteoglycan decorin to collagen type VI, J. Biol. Chem., 1992, 267(8), 5250–5256 CAS.
- C. M. Kielty, S. P. Whittaker, M. E. Grant and C. A. Shuttleworth, Type VI collagen microfibrils: evidence for a structural association with hyaluronan, J. Cell Biol., 1992, 118(4), 979–990 CrossRef CAS PubMed.
- H. Tan and K. G. Marra, Injectable, biodegradable hydrogels for tissue engineering applications, Materials, 2010, 3(3), 1746–1767 CrossRef CAS.
- H. S. Yoo, E. A. Lee, J. J. Yoon and T. G. Park, Hyaluronic acid modified biodegradable scaffolds for cartilage tissue engineering, Biomaterials, 2005, 26(14), 1925–1933 CrossRef CAS PubMed.
- M. N. Collins and C. Birkinshaw, Hyaluronic acid based scaffolds for tissue engineering—A review, Carbohydr. Polym., 2013, 92(2), 1262–1279 CrossRef CAS PubMed.
- K. K. Svoboda, Chondrocyte-matrix attachment complexes mediate survival and differentiation, Microsc. Res. Tech., 1998, 43(2), 111–122 CrossRef CAS PubMed.
- S. Yoshida, M. Miyazaki, K. Sakai, M. Takeshita, S. Yuasa, A. Sato, T. Kobayashi, S. Watanabe and H. Okuyama, Fourier transform infrared spectroscopic analysis of rat brain microsomal membranes modified by dietary fatty acids: possible correlation with altered learning behavior, Biospectroscopy, 1997, 3(4), 281–290 CrossRef CAS.
- C. Paluszkiewicz and W. M. Kwiatek, Analysis of human cancer prostate tissues using FTIR microspectroscopy and SRIXE techniques, J. Mol. Struct., 2001, 565–566, 329–334 CrossRef CAS.
| This journal is © The Royal Society of Chemistry 2018 |