 Open Access Article
Automated solid-phase extraction of organic pollutants using melamine–formaldehyde polymer-derived carbon foams
Milad
Ghani
ab,
Fernando
Maya
 *a and
Víctor
Cerdà
a
aDepartment of Chemistry, University of the Balearic Islands, Carretera de Valldemossa km 7.5, E-07122, Palma de Mallorca, Illes Balears, Spain. E-mail: fernando.maya@uib.es; Fax: +34 97173260; Fax: +34 971173426
bDepartment of Chemistry, Isfahan University of Technology, Isfahan 84156-83111, Iran
First published on 12th May 2016
Abstract
The adsorptive potential of melamine–formaldehyde (MF) polymer derived elastic carbon foams (CF) has been explored for the first time for the extraction of low levels of environmental pollutants from water samples. The prepared CFs are obtained from the direct carbonization under nitrogen atmosphere of MF. CFs are used as flow-through supports and are implemented for automated solid-phase extraction using the sequential injection analysis technique. In comparison to other carbon-based materials, the use of monolithic networks based on CFs showed low-pressure and good mass transfer of the analytes, enabling the efficient extraction of bisphenol A, 4-tert-octylphenol and 4-n-nonylphenol from water samples prior to their quantification using liquid chromatography. Different experimental parameters such as selection of the eluent, sample and eluent volumes, and preconcentration and elution flow rates, were evaluated. Under the selected conditions, the detection limits were between 0.02 and 0.08 μg L−1 and the relative standard deviations (RSD, 10 μg L−1) ranged from 4.1–4.8%. Batch-to-batch reproducibility for three different carbon sponges was 5.8–6.3%. The obtained preconcentration factors were between 24 and 38, using a volume of 4 mL of sample. The CFs are chemically robust and flexible, and reusable at least 50 times. Different water samples such as well water, wastewater and leachates from a solid waste treatment plant were analyzed to investigate the capability of CFs for real sample analysis.
1. Introduction
Solid-phase extraction (SPE) is a widely used sample preparation technique for analyte clean-up and preconcentration.1 The incorporation of the sorbent in flow-through supports such as cartridges or membrane disks facilitates the implementation of the overall SPE procedure.2 A high versatility on the automation of SPE procedures is achieved using the different generations of flow analysis techniques,3–5 including both micro-column,6,7 or disk based packing.8,9 Among the different materials used for SPE, novel carbon forms have been constantly studied as sorbents for this application, including carbon nanotubes,10,11 or graphene.12,13 However, the inherent morphology of these materials is far from the desired for flow-through SPE applications, requiring more complex extraction devices for their automation,14,15 or alternatively, incorporating the carbon particles into functional devices such as microextraction fibers,16,17 silica,18 or magnetic Fe3O4 particles.19A novel type of carbon-based supports recently reported in the scientific literature are the monolithic 3D networks composed by elastic carbon foams (CF),20–24 obtained from the direct carbonization in an inert atmosphere of melamine–formaldehyde–sodium bisulfite polymer foams (MF).25,26 MFs have been used for the last 20 years as pipe insulator and soundproofing material, and more recently as an abrasive cleaner. CFs are based on three-dimensional interconnected porous network architectures, have a high surface area (>200 m2 g−1) and showed promising applications as oil adsorbents,20,21 or as flexible electrodes for batteries.22–24
Many applications of foams as sorbents for SPE applications have been based on the use of polyurethane foam, which has been extensively studied for the preconcentration of trace metals.27 In this case, a chelating ligand is previously immobilized into the foam prior to metal extraction,28 or alternatively, the metal complex is formed prior to the preconcentration step.29 However, to the authors knowledge, and despite of the promising features for adsorption of CFs derived from MF, no examples of their use as sorbents for SPE have been reported so far. CFs have a huge potential as sorbent for SPE applications since they are moldable, have a low density and a high flexibility causing very low backpressures, enabling the use of higher flow rates without compromising the performance of the extraction.
Herein, we propose for the first time the use of MF-derived CFs as sorbents for the automated SPE of environmental pollutants. The obtained CFs are molded with the desired size and shape, in order to be incorporated in a miniaturized flow-through holder used as SPE device, and implemented into a sequential injection analysis (SIA) system.4 The versatile use of the SIA technique in combination with the proposed sorbent has been evaluated for the simultaneous SPE of trace levels of three endocrine disrupting phenols (bisphenol A, 4-tert-octylphenol and 4-n-nonylphenol), prior to their quantification using liquid chromatography. The applicability of the CFs for real sample analysis has been studied by analyzing the selected endocrine disrupting phenols in different types of water samples.
2. Materials and methods
2.1. Chemicals and standard solutions
Methanol (HPLC grade, ≥99.8%), ethanol (≥99.8%) and acetonitrile (99.9%), were obtained from Scharlau (Barcelona, Spain). 4-n-Nonylphenol (≥99.8%), 4-tert-octylphenol (≥97%) and bisphenol A (≥97%), were obtained from Sigma-Aldrich (St. Louis, USA). Melamine foam was purchased from a local store. A stock standard solution of each of the selected analytes (2000 mg L−1) were prepared in methanol. An intermediate standard solution of a concentration of 20 mg L−1 was prepared by diluting the stock standard solutions in methanol. A stock working solution at the concentration of 1 mg L−1 was prepared from the intermediate stock standard solution daily in water. More diluted working solutions were prepared by diluting the intermediate working solution with water. In all instances, Milli-Q water from a Direct-8 purification system (resistivity > 18 MΩ cm, Millipore Iberica, Spain) was used.2.2. Preparation of elastic carbon foam for SPE
CF monolithic networks, were prepared from pieces of melamine–formaldehyde polymer foam (MF) (1 cm × 1 cm × 50 mm). MF was first washed with ethanol and dried in an oven at 60 °C. The cleaned and dried MF was heated in an electric furnace to a final temperature of 800 °C with a heating rate of 5 °C min−1 under a nitrogen atmosphere. The foam was annealed at this temperature for 3 h, in order to complete the carbonization process. The as prepared CFs were cooled down to room temperature and washed thoroughly with pure water, prior to their use as sorbents for SPE.2.3. Instrumentation
The SIA system is composed by a computer controlled bi-directional syringe pump (5000-step automatic burette (model Bu4) from Crison, Alella, Barcelona, Spain, http://www.crison.es). The syringe pump is equipped with a 5 mL glass syringe from Hamilton (Bonaduz, Switzerland, http://www.hamiltoncompany.com), and a three-way solenoid head valve (SV, N-Research, West Caldwell, NJ, http://www.nresearch.com). The normally open port (OFF) of the solenoid valve of the syringe is connected to the carrier reservoir (water). The normally closed position (ON) is connected through a holding coil to the central port of an eight port multiposition valve (MPV, Sciware Systems SL, Spain, http://www.sciware-sl.com) used for the sequential selection of the sample the eluent, and to connect to the extraction device. All tubing is polytetrafluoroethylene 0.8 mm i.d., except the holding coil (1.6 mm i.d., 5 mL). The extraction device is a two-piece polymethyl methacrylate cylinder with a 1 mm i.d. channel and an internal cavity to hold the carbon foam, as used previously.8,9 The extraction device is connected to an additional solenoid valve solenoid valve (V5, MTV-3-N1/4UKG, 2 bar maximum pressure, Takasago, Japan) enabling the collection of the eluate into a vial. The additional solenoid valve is controlled by the syringe pump module through an additional port. The syringe pump and the selection valve modules are controlled using the software package AutoAnalysis 5.0 (Sciware Systems SL).A Jasco HPLC instrument equipped with a high-pressure pump (PU-4180), a manual injector (20 μL), and a UV-vis diode array detector (MD-4017) was used for the separation and quantification of the selected analytes. Separation was performed at room temperature on a Phenomenex® Kinetex EVO C18 100A core–shell column (150 mm × 4.6 mm i.d. 5 μm) with a guard column (5 mm × 4.6 mm i.d.). The mobile phase was a mixture of methanol (solvent A) and pure water (solvent B) (75![[thin space (1/6-em)]](https://www.rsc.org/images/entities/char_2009.gif) :
:![[thin space (1/6-em)]](https://www.rsc.org/images/entities/char_2009.gif) 25, v/v). The mobile phase was used at a flow rate of 1.0 mL min−1. The detection was performed at 229 nm for all analytes.
25, v/v). The mobile phase was used at a flow rate of 1.0 mL min−1. The detection was performed at 229 nm for all analytes.
The morphology of the sorbent was analyzed using a scanning electron microscope (SEM) Hitachi S-3400N.
2.4. Samples
In order to investigate the capability of the method for real sample analysis, different types of water samples including well water, leachates from rainwater and wastewater samples were collected from Palma de Mallorca, Spain. The samples were filtered using a nylon membrane filter (0.45 μm, Millipore, Bedford, MA, USA) before use. Wastewater was collected from an urban wastewater treatment plant. Well water was collected from a well water reservoir located nearby an urban solid waste treatment plant. Leachate sample was collected from a solid waste treatment plant.2.5. Extraction procedure
The SIA procedure for the application of CFs as sorbents for SPE was developed using the flow system schematically depicted in Fig. 1. Briefly, an appropriate sample volume is loaded into the holding coil through position 2 of the selection valve (SV). The SV is then connected to position 1 and the sample is pumped through the homemade holder containing a circular piece of CF, followed by a volume of carrier to wash the non-retained analytes in the CF. The circular piece of CF is 3.65 mm diameter and a thickness of 2.50 mm. By using an external solenoid valve placed at the outlet of the CF, the sample matrix is directed to a waste reservoir. Thereafter, the selection valve is connected to position 3 in order to load an appropriate amount of eluent, and then connected again to position 1 to flow the eluent through the CF. In this step, the additional solenoid valve is turned on enabling the collection of the eluent fraction in a vial, for subsequent HPLC analysis of the extracted analytes. The collected solvent was evaporated under a gentle stream of nitrogen and reconstituted in 50 μL of acetonitrile. A 20 μL portion was used for HPLC analysis.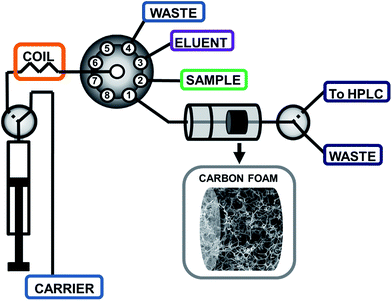 | ||
| Fig. 1 Schematic depiction of the sequential injection analysis set-up for the determination of endocrine disrupting phenols using melamine–formaldehyde derived elastic carbon foams. | ||
3. Results
3.1. Features of the CF sorbent
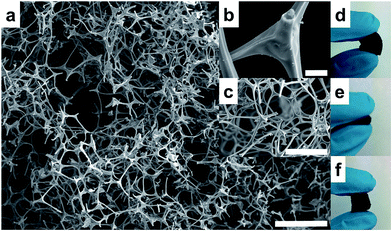
The CF used in this work as a novel sorbent for SPE in automated mode is based on a 3D interconnected monolithic carbon network (Fig. 2a and b), which is a replicate of the original MF (Fig. 2c). After carbonization, the MF structure shrinks and its color changes from white to a black color, maintaining the morphology of the 3D network and its flexibility (Fig. 2d–f). A larger piece of MF is carbonized to a CF, with the limitation of the diameter of the tubular oven used for the carbonization (26 mm). Several pieces of MF are carbonized simultaneously obtaining a substantial amount of CF in just one carbonization step. The larger CF pieces can be subsequently cut into smaller pieces and easily molded in different shapes, just cutting them with a blade. In this case, CF is cut as a small disk that is fitted easily within a flow-through extraction holder due to its elastic behavior.The obtained CFs are composed by carbon doped with nitrogen, and when obtained at temperatures ranging from 400 to 800 °C are moderately hydrophobic. These CFs are ideal sorbents for the SPE of moderately polar compounds such as bisphenols or alkylphenols. More hydrophobic CFs have been obtained using carbonization temperatures >1000 °C.21 Alternatively, the surface properties of CFs can be tuned by carbonizing the MF in the presence of copolymers,21 or by post-combustion modification with chlorotrimethylsilane.30
3.2. Study of the extraction parameters for the SPE of phenolic endocrine disruptors using CF
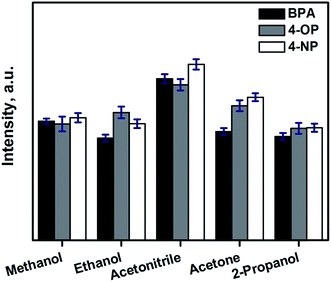
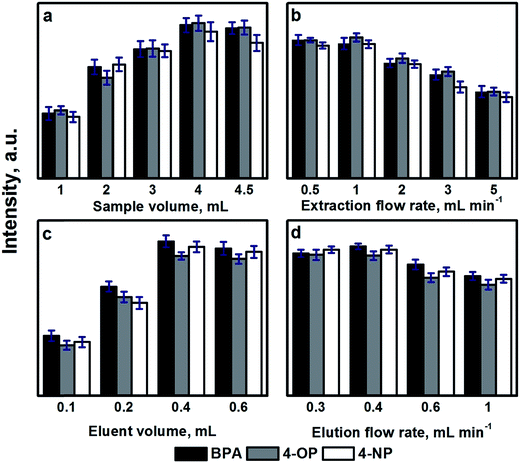
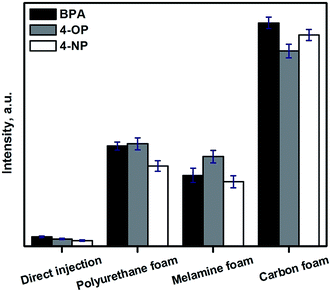
The relevant parameters involved in the automated SPE process using CFs has been studied using bisphenol A (BPA), 4-tert-octylphenol (4-OP) and 4-n-nonylphenol (4-NP) as model analytes.In this case, a carbonization temperature of 800 °C, is ideal to obtain CFs moderate polarity, which are ideal for the extraction of slightly polar analytes as the selected endocrine disrupting phenols. To obtain more polar CFs a lower carbonization temperature can be used, tuning the number of remaining polar groups (carbonyl, hydroxyl, …) in the final CF. The hydrophobicity of CF can be increased by increasing the carbonization temperature, obtaining CF with an almost negligible presence of polar groups.21
3.3. Analytical features
The analytical features of the developed SIA method for the automated SPE of endocrine disrupting phenols using the CFs were stablished working under the selected experimental conditions studied in the previous sections. The obtained analytical features are summarized in Table 1. The linear dynamic range (LDR) of the method was stablished in the range of 0.5–200 μg L−1, and all analytes showed good linearity with determination coefficients (r2) greater than 0.9952. The limits of detection (LOD) were calculated based on peak-to-peak noise (S/N = 3), and ranged from 0.02 to 0.08 μg L−1. The limits of quantification (LOQ) based on S/N = 10, ranged from 0.34 to 0.85 μg L−1. The relative standard deviations (RSD) for consecutive extractions using the same CF sorbent ranged between 2.8 and 3.6% (n = 6, 100 μg L−1), showing the high repeatability of the automated extraction procedure. Using more diluted analyte standard solutions, a good extraction repeatability was also achieved, obtaining RSDs ranging from 4.1–4.8% (n = 6, 10 μg L−1). Inter-day reproducibility was also evaluated using CFs prepared from the same carbonization batch (same piece of carbonized MF), showing a good reproducibility with obtained RSD values ranging from 5.2–6.3% (n = 6, 50 μg L−1). Batch-to-batch reproducibility was also evaluated comparing CFs prepared form different pieces of MF. The obtained RSD values (5.8–6.3%) from the comparison of three CF prepared from different MF batches showed the good batch-to batch reproducibility.| Analyte | LDR (μg L−1) | r 2 | LOQ (μg L−1) | LOD (μg L−1) | Precisiona (RSD, %) | PFc | |||
|---|---|---|---|---|---|---|---|---|---|
| Intra-day | Inter-dayb | Batch-to-batchb | |||||||
| 100 μg L−1 | 10 μg L−1 | ||||||||
| a Relative standard deviation (n = 6). b Spiking level, 50 μg L−1. Batch to batch = 3 sponges. c Preconcentration factor. | |||||||||
| BPA | 0.5–200 | 0.9952 | 0.02 | 0.34 | 3.5 | 4.8 | 5.2 | 6.1 | 28 |
| 4-OP | 1–200 | 0.9972 | 0.08 | 0.85 | 2.8 | 4.1 | 6.3 | 6.3 | 30 |
| 4-NP | 1–200 | 0.9989 | 0.04 | 0.65 | 3.6 | 4.5 | 5.6 | 5.8 | 34 |
The preconcentration factors obtained ranged from 24 to 38, showing the high performance of the developed automated SPE procedure using CFs. The extraction throughput working under the selected experimental conditions is 7 h−1. However, in cases when the sensitivity of the method is not a crucial parameter and the purpose of SPE is just a sample clean-up, the use of higher flow rates (5 mL min−1) increases the extraction throughput >40%. As a difference with particle packed beds, CFs are flexible and no apparent backpressures are observed, even when high flow rates (5 mL min−1) are applied using low-pressure instrumentation. This feature and their inherent chemical robustness makes them reusable for at least 50 times, when SPE in a reverse phase mode is used, as in the example of application reported in this work.
A comparison between the obtained LODs and the precision of the developed method and other previously developed sample pretreatment techniques for the extraction and determination of endocrine disrupting phenols are summarized in Table 2. As can be seen in the table, the obtained LODs are on par with those of other extraction techniques including dispersive liquid–liquid microextraction (DLLME),31 liquid-phase microextraction (LPME),32,33 or solid-phase microextraction (SPME).34–36 Additionally, the developed SPE method is benefited from the advantageous features inherent to flow analysis systems, obtaining an automated extraction method enabling high reproducibility and short analysis times when compared with other manual microextraction techniques.
| Extraction technique | Detection technique | Sample | LOD (μg L−1) | RSD (%) | Ref. |
|---|---|---|---|---|---|
| DLLME | HPLC-DAD | Water | 0.07 (BPA) | 6.0 | 31 |
| Vortex-assisted LPME | HPLC-FLD | Water | 0.02 (BPA) | 5.9–8.0 | 32 |
| 0.01 (4-OP) | |||||
| 0.07 (4-NP) | |||||
| Ionic liquid LPME | HPLC-FLD | Water | 0.7 (4-OP) | 3.2–7.8 | 33 |
| 0.3 (4-NP) | |||||
| SPME | HPLC-FLD | Food packages | 0.9 (BPA) | 22 | 34 |
| SPME | HPLC-FLD | Water | 0.43 (BPA) | — | 35 |
| 0.16 (4-OP) | |||||
| 0.29 (4-NP) | |||||
| In-tube SPME | HPLC-FLD | Water | 0.02 (BPA) | 9.8 | 36 |
| CF-SIA | HPLC-DAD | Water | 0.02 (BPA) | 2.8–6.3 | This work |
| 0.08 (4-OP) | |||||
| 0.04 (4-NP) |
The main advantages of the use of CFs as sorbents for SPE are: (1) extremely low cost and commercially available precursor material (MF). (2) A large amount of CF is obtained in just one carbonization step. (3) CFs are reusable. (4) CFs can be molded into any shape. (5) CFs are flexible, and can be used as flow-through supports at low pressures. (5) CFs have a monolithic shape, and they can be easily handled and packed.
3.4. Sample analysis
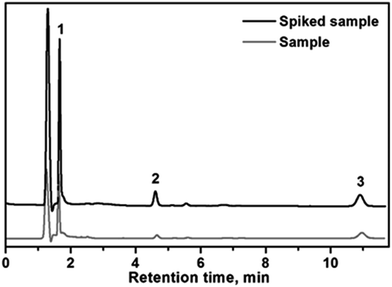
In order to study the accuracy and applicability of the method for the extraction and determination of the selected endocrine disrupting phenols in real samples, different water samples (well water, leachates and wastewater) were selected as a model for the real samples analysis. Quantification of the analytes was performed using the standard addition method. The real samples were spiked with the analytes at three different concentration levels (10, 20 and 50 μg L−1). The results for sample analysis are shown in Table 2. The relative recovery was defined as the ratio of the measured concentration of the analyte in the samples and the measured concentration of analyte in pure water samples spiked with the same amount of analytes.The results for sample analysis are shown in Table 3. As can be seen in the table, the relative recoveries were higher than 89.0%, for all analytes. In Fig. 6, is shown an example of chromatogram of the wastewater sample before and after spiking with 20 μg L−1 of each analyte. These results confirm the suitability of the developed automated SPE method using CFs for real sample analysis.
| Sample | Analyte | Measured (μg L−1) | Added (μg L−1) | Found (μg L−1) | Spiking recovery (%) | Relative recovery (%) |
|---|---|---|---|---|---|---|
| a RSD% value (n = 3). b Not detected. | ||||||
| Well water 1 | BPA | NDb | 10 | 9.32 | 93.2 | 91.7 (7.5)a |
| 4-OP | ND | 10 | 9.22 | 92.2 | 90.1 (7.1) | |
| 4-NP | ND | 10 | 9.28 | 92.8 | 91.7 (6.8) | |
| Well water 2 | BPA | 1.05 | 10 | 10.6 | 95.5 | 95.2 (5.2) |
| 4-OP | 2.12 | 10 | 11.8 | 96.8 | 96.3 (6.2) | |
| 4-NP | 1.05 | 10 | 10.9 | 98.5 | 93.6 (6.1) | |
| Leachates | BPA | 1.45 | 10 | 11.2 | 97.5 | 93.6 (6.3) |
| 4-OP | 1.02 | 10 | 10.7 | 96.8 | 94.6 (6.7) | |
| 4-NP | ND | 10 | 9.87 | 98.7 | 95.3 (7.2) | |
| Wastewater | BPA | 3.32 | 10 | 12.3 | 89.8 | 89.0 (7.5) |
| 4-OP | 2.61 | 10 | 11.9 | 92.9 | 91.2 (6.8) | |
| 4-NP | 2.23 | 10 | 11.7 | 94.7 | 92.3 (6.9) | |
4. Conclusion
In this study, a simple and reproducible strategy has been developed for the implementation of flexible carbon sorbents for SPE. It has been achieved by the direct carbonization of commercially available MF in an inert atmosphere. The prepared CFs showed excellent properties as flow through sorbents, such as high reproducibility, durability and preconcentration factors using moderate extraction times. CFs are easily incorporated in flow analysis systems for the development of automated SPE procedures. In this case, the prepared CFs were successfully applied for the automated SPE of bisphenol A, 4-tert-octylphenol and 4-n-nonylphenol as model compound analytes.The synthesized CFs present a significant hydrophobicity, and have a good affinity for the extraction of moderately polar phenols. However, the surface of the CFs can be tuned by the carbonization temperature or modified pre- or post-combustion, obtaining CFs with different surface properties. Future work can be directed towards the study of the presence of different functional groups on the CFs on depending of the carbonization temperature, as well as to develop novel clean-up applications for highly complex sample matrices, such as biological or food samples. Apart from MF, CFs san be obtained from other precursor materials, which can be potentially useful sorbents for novel SPE applications.37,38
Acknowledgements
The authors acknowledge the support from the Spanish Ministerio de Economía y Competitividad (MINECO) and the European Funds for Regional Development (FEDER) through the Project CTQ2013-47461-R. M. G. acknowledges the support of the Ministry of Science of Iran for his financial support. F. M. acknowledges the support of the Government of the Balearic Islands and the European Social Fund for a postdoctoral fellowship and the Accio Especial number AAEE/35.References
- M.-C. Hennion, J. Chromatogr. A, 1999, 856, 3 CrossRef CAS PubMed.
- C. F. Poole, Trends Anal. Chem., 2003, 22, 362 CrossRef CAS.
- J. Ruzicka and E. H. Hansen, Anal. Chim. Acta, 1975, 78, 145 CrossRef CAS.
- J. Ruzicka and G. D. Marshall, Anal. Chim. Acta, 1990, 237, 329 CrossRef CAS.
- J. Ruzicka, Analyst, 2000, 125, 1053 RSC.
- M. Villar, J. Avivar, L. Ferrer, M. Galmés, F. Vega and V. Cerdà, Anal. Chem., 2013, 85, 5491 CrossRef CAS PubMed.
- I. C. Santos, R. B. R. Mesquita and A. O. S. S. Rangel, Anal. Chim. Acta, 2015, 891, 171 CrossRef CAS PubMed.
- F. Maya, J. M. Estela and V. Cerdà, Anal. Chem., 2008, 80, 5799 CrossRef CAS PubMed.
- F. Maya, J. M. Estela and V. Cerdà, Talanta, 2010, 80, 1333 CrossRef CAS PubMed.
- Y. Cai, G. Jiang, J. Liu and Q. Zhou, Anal. Chem., 2003, 75, 2517 CrossRef CAS PubMed.
- Y.-Q. Cai, G.-B. Jiang, J.-F. Liu and Q.-X. Zhou, Anal. Chim. Acta, 2003, 494, 149 CrossRef CAS.
- Q. Liu, J. Shi, L. Zeng, T. Wang, Y. Cai and G. Jiang, J. Chromatogr. A, 2011, 1218, 197 CrossRef CAS PubMed.
- H. Zhang, W. P. Low and H. K. Lee, J. Chromatogr. A, 2012, 1233, 16 CrossRef CAS PubMed.
- W. Boonjob, M. Miró, M. A. Segundo and V. Cerdà, Anal. Chem., 2011, 83, 5237 CrossRef CAS PubMed.
- M. Rosende, M. Miró, M. A. Segundo, J. L. F. C. Lima and V. Cerdà, Anal. Bioanal. Chem., 2011, 400, 2217 CrossRef CAS PubMed.
- Q. Li, X. Wang and D. Yuan, J. Chromatogr. A, 2009, 1216, 1305 CrossRef CAS PubMed.
- J. Chen, J. Zou, J. Zeng, X. Song, J. Ji, Y. Wang, J. Ha and X. Chen, Anal. Chim. Acta, 2010, 678, 44 CrossRef CAS PubMed.
- Q. Liu, J. Shi, J. Sun, T. Wang, L. Zeng and G. Jiang, Angew. Chem., Int. Ed., 2011, 123, 6035 CrossRef.
- Q. Han, Z. Wang, J. Xia, S. Chen, X. Zhang and M. Ding, Talanta, 2012, 101, 388 CrossRef CAS PubMed.
- S. Chen, G. He, H. Hu, S. Jin, Y. Zhou, Y. He, S. He, F. Zhao and H. Hou, Energy Environ. Sci., 2013, 6, 2435 CAS.
- S. Qiu, B. Jiang, X. Zheng, J. Zheng, C. Zhu and M. Wu, Carbon, 2015, 84, 551 CrossRef CAS.
- W. Xiao, L. Mi, S. Cui, H. Hou and W. Chen, New J. Chem., 2016, 40, 93 RSC.
- A. K. Roy, M. Zhong, M. G. Schwab, A. Binder, S. S. Venkataraman and Z. Tomovic, ACS Appl. Mater. Interfaces, 2016, 8, 7343 CAS.
- P. Zhang, R. Wang, M. He, J. Lang, S. Xu and X. Yan, Adv. Funct. Mater., 2016, 26, 1354 CrossRef CAS.
- D. Yang, P. Liu, N. Zhang, W. Wei, M. Yue, J. You and H. Wang, ChemCatChem, 2014, 6, 3434 CrossRef CAS.
- Y. Zhao, L. Xu, S. Li, Q. Chen, D. Yang, L. Chen and H. Wang, Analyst, 2015, 140, 1832 RSC.
- V. A. Lemos, M. S. Santos, E. S. Santos, M. J. S. Santos, W. N. L. dos Santos, A. S. Souza, D. S. de Jesus, C. F. das Virgens, M. S. Carvalho, N. Oleszczuk, M. G. R. Vale, B. Welz and S. L. C. Ferreira, Spectrochim. Acta, Part B, 2007, 62, 4 CrossRef.
- S. Arpadjan, L. Vuchkova and E. Kostadinova, Analyst, 1997, 122, 243 RSC.
- D. S. de Jesus, R. J. Casella, S. L. C. Ferreira, A. C. S. Costa, M. S. de Carvalho and R. E. Santelli, Anal. Chim. Acta, 1998, 366, 263 CrossRef CAS.
- Y. Yang, Y. Deng, Z. Tong and C. Wang, J. Mater. Chem. A, 2014, 2, 9994 CAS.
- M. Rezaee, Y. Yamini, S. Shariati, A. Esrafili and M. Shamsipur, J. Chromatogr. A, 2009, 1216, 1511 CrossRef CAS PubMed.
- E. Yiantzi, E. Psillakis, K. Tyrovola and N. Kalogerakis, Talanta, 2010, 80, 2057 CrossRef CAS PubMed.
- J.-F. Liu, Y.-G. Chi, G.-B. Jiang, C. Tai, J.-F. Peng and J.-T. Hu, J. Chromatogr. A, 2004, 1026, 143 CrossRef CAS PubMed.
- C. Nerin, M. R. Philo, J. Salafranca and L. Castle, J. Chromatogr. A, 2002, 963, 375 CrossRef CAS PubMed.
- Y. Cai, G. Jiang, J. Liu, X. Liang, Z. Yao, J. Liu and Q. Zhou, Anal. Lett., 2005, 37, 739 CrossRef.
- Y. Wen, B.-S. Zhou, Y. Xu, S.-W. Jin and Y.-Q. Feng, J. Chromatogr. A, 2006, 1133, 21 CrossRef CAS PubMed.
- W. Zhao, H. Gao and M. Fan, RSC Adv., 2015, 5, 104936 RSC.
- P. R. Agrawal, R. Kumar, H. Uppal, N. Singh, S. Kumari and S. R. Dhakat, RSC Adv., 2016, 6, 29899 RSC.
| This journal is © The Royal Society of Chemistry 2016 |

