 Open Access Article
Creative Commons Attribution 3.0 Unported Licence
Nanoparticles as transfection agents: a comprehensive study with ten different cell lines
Bernhard
Neuhaus
a,
Benjamin
Tosun
a,
Olga
Rotan
a,
Annika
Frede
b,
Astrid M.
Westendorf
b and
Matthias
Epple
*a
aInorganic Chemistry and Center for Nanointegration Duisburg-Essen (CeNIDE), University of Duisburg-Essen, Universitaetsstr. 5-7, 45117 Essen, Germany. E-mail: matthias.epple@uni-due.de; Fax: +49 201 1832621; Tel: +49 201 1832402
bInstitute of Medical Microbiology, University Hospital Essen, University of Duisburg-Essen, Essen, Germany
First published on 4th February 2016
Abstract
The performance of transfection agents to deliver nucleic acids into cells strongly depends on the cell type. In a comprehensive study, nine different cell lines and primary human mesenchymal stem cells were transfected with DNA encoding for enhanced green fluorescent protein (eGFP). As transfection agents, two kinds of cationic multi-shell calcium phosphate nanoparticles and the commercially available transfection agent Lipofectamine were used. The transfection efficiency was measured by fluorescence microscopy by counting the percentage of green fluorescent cells which expressed eGFP as well as qPCR. Furthermore, the uptake of fluorescent calcium phosphate nanoparticles was measured by fluorescence microscopy. The cell viability was measured by the MTT test after incubation with nanoparticles and Lipofectamine. All cell types took up nanoparticles (with different efficiency), but the expression of eGFP was strongly different, demonstrating that the uptake not necessarily leads to processing of a gene. A clear correlation was found between the transfection efficiency and the cell viability that was independent on the transfection agent: a high transfection efficiency was clearly correlated with a low cell viability and vice versa.
Introduction
The non-viral introduction of DNA into living cells is called transfection. The DNA has to cross the cell membrane and to enter the nucleus where its genetic code is transcribed and the corresponding protein is produced.1–5 Together with gene silencing where siRNA is suppressing the transcription of a specific protein,6–9 this approach is called gene therapy, an exciting area of biomedical research.8,10,11The efficiency of transfection is notoriously poorly reproducible and difficult to compare between different studies. The main factors are the target cell type and the kind of transfection agent. Given the fact that for a successful transfection, the DNA has to cross the cell membrane, to escape the lysosome, to enter the nucleus and to avoid degradation on its pathway, it is clear that the cell type and the transfection agent will strongly influence this process at each step.1,7,12–20 Therefore, many experiments reported in the literature are difficult to compare because different cell types and different transfection agents were used. Furthermore, it is not always clear whether a low transfection rate was due to a poor particle uptake or to a poor processing of the DNA by the cell.
We have therefore treated ten cell types of different origin and differentiation with nanoparticles to compare the efficiencies of uptake and transfection with eGFP-encoding DNA. As control reagent, the commercial transfection agent Lipofectamine was used. All cells were incubated in parallel with the same batches of nanoparticles and transfection agent. Of course, all cell lines have different properties with respect to particle uptake, ability to be transfected, internal protein synthesis, sensitivity towards nanoparticles. It was our goal to elucidate exactly these differences (without going too deep into the intracellular mechanisms and differences between cell types) by challenging the cells under identical conditions with identical nanoparticles.
Experimental
Materials
Poly(ethyleneimine) (PEI, Mw = 25![[thin space (1/6-em)]](https://www.rsc.org/images/entities/char_2009.gif) 000 g mol−1) was obtained from Sigma-Aldrich. Fluorescent FITC-labelled (fluorescein isothiocyanate) PEI (Mw = 25
000 g mol−1) was obtained from Sigma-Aldrich. Fluorescent FITC-labelled (fluorescein isothiocyanate) PEI (Mw = 25![[thin space (1/6-em)]](https://www.rsc.org/images/entities/char_2009.gif) 000 g mol−1) was obtained from Surflay (Berlin, Germany). For transfection, pcDNA3eGFP was used. Plasmid DNA (pcDNA3eGFP) coding for eGFP (enhanced green fluorescent protein) was isolated from Escherichia coli using a NucleoBond® PC 10000 EF endotoxin-free plasmid DNA purification kit (Machery-Nagel, Düren, Germany). This plasmid DNA had a molecular weight of Mw = 1
000 g mol−1) was obtained from Surflay (Berlin, Germany). For transfection, pcDNA3eGFP was used. Plasmid DNA (pcDNA3eGFP) coding for eGFP (enhanced green fluorescent protein) was isolated from Escherichia coli using a NucleoBond® PC 10000 EF endotoxin-free plasmid DNA purification kit (Machery-Nagel, Düren, Germany). This plasmid DNA had a molecular weight of Mw = 1![[thin space (1/6-em)]](https://www.rsc.org/images/entities/char_2009.gif) 871
871![[thin space (1/6-em)]](https://www.rsc.org/images/entities/char_2009.gif) 704 g mol−1.
704 g mol−1.
All other reagents were of analytical grade and used without further purification.
Instruments
Scanning electron microscopy was performed with an ESEM Quanta 400 instrument with gold/palladium-sputtered samples. Dynamic light scattering and zeta potential determinations were performed with a Zetasizer nanoseries instrument (Malvern Nano-ZS, laser: λ = 633 nm) using the Smoluchowski approximation and taking the data from the Malvern software without further correction. The particle size data refer to scattering intensity distributions (z-average). Centrifugation was performed at 4 °C with a Heraeus Fresco 21 instrument for smaller volumes, and a Sorvall WX ultra series centrifuge for larger volumes.The amount of calcium was determined by atomic absorption spectroscopy (AAS) with an M-Series AA spectrometer (ThermoElectron Corporation, Schwerte, Germany).
Transfection efficiencies were determined by transmission light microscopy and fluorescence microscopy with a Keyence Biorevo BZ-9000 instrument (Osaka, Japan). The microscope was equipped with Keyence GFP-B (excitation: 470/40) filters. Images were recorded with the BZ-II viewer software and processed with the BZ-II analyzer software. Real-time quantitative PCR (qPCR) was carried out with a 7500 Fast Real-time System (Applied Biosystems, Life Technologies, Carlsbad, USA). Data were recorded and analysed with the 7500 Fast Real-time System software. UV/vis measurements were performed with a Cary 300 BIO UV-visible spectrophotometer with 1 cm quartz microcuvettes. The cell viability was determined with the MTT-test by spectrophotometric analysis with a Multiscan FC instrument (ThermoFisher scientific, Vantaa, Finland) at λ = 570 nm.
Freeze-drying of nanoparticle dispersions was performed with an Alpha 2-4 LSC freeze-dryer (Martin Christ, Osterode, Germany) as described in ref. 21.
Lipofectamine 2000® was obtained from Life Technologies (Invitrogen, Carlsbad, USA). This commercially available transfection agent consists of positively charged lipid molecules. By mixing DNA with Lipofectamine 2000®, positively charged liposomes are formed, which are attracted to the cellular membrane by electrostatic interactions. After a contact between the liposomes and the cellular membrane is formed, the liposomes are able to fuse with the cellular membrane to release the nucleic acids into the cell.22,23
All errors given represent standard deviations.
Synthesis of triple-shell calcium phosphate nanoparticles: CaP–DNA–CaP–PEI
Cationic triple shell calcium phosphate nanoparticles (CaP–DNA–CaP–PEI) were synthesized in analogy to earlier reported procedures.24,25 Equal volumes of solutions of calcium-L-lactate (6.25 mM, pH 9) and diammonium hydrogen phosphate (3.74 mM, pH 9) were pumped into a solution of DNA (pcDNA3eGFP; 1 mg mL−1) to give a final DNA concentration of 167 μg mL−1 (e.g. 217 μL of calcium and phosphate solution each and 87 μL DNA solution). Calcium and phosphate solutions were pumped through a Y-connector with a syringe pump, resulting in a nucleation time of 0.25 s for calcium phosphate formation. The primary nanoparticles were stabilized by coating with DNA. Excess DNA was removed by centrifugation at 20![[thin space (1/6-em)]](https://www.rsc.org/images/entities/char_2009.gif) 000g for 15 min. The precipitated nanoparticles were then redispersed in the same volume of water by ultrasonication for 10 s (UP50H, Hielscher, Ultrasound Technology; sonotrode 2, cycle 0.8, amplitude 70%). After this procedure, single-shell calcium phosphate nanoparticles with a shell of DNA were obtained.
000g for 15 min. The precipitated nanoparticles were then redispersed in the same volume of water by ultrasonication for 10 s (UP50H, Hielscher, Ultrasound Technology; sonotrode 2, cycle 0.8, amplitude 70%). After this procedure, single-shell calcium phosphate nanoparticles with a shell of DNA were obtained.
The second shell of calcium phosphate and the third shell of PEI were added as follows. Equal volumes of calcium-L-lactate (6.25 mM, pH 9) and diammonium hydrogen phosphate (3.74 mM, pH 9) solutions were subsequently added (e.g. 217 μL) to the colloidal dispersion, followed by addition of PEI solution (2 mg mL−1 in water) to give a final concentration of 87 μg mL−1 of PEI (e.g. 45 μL). Excess PEI was removed by ultracentrifugation and redispersion in water.
The concentration of DNA in the nanoparticles was determined by measuring the absorbance at 260 nm in the supernatants of the first centrifugation step. After purification of the nanoparticle dispersion from free nucleic acids, excess ions and free PEI, about 7.6 μg mL−1 of DNA was left in the colloidal dispersion, which corresponds to about 9% of the DNA applied during the synthesis.
Synthesis of calcium phosphate nanoparticles with a silica shell: CaP–DNA–PEI–SiO2–SH
Calcium phosphate nanoparticles with a silica shell (CaP–DNA–PEI–SiO2–SH) were synthesized as reported earlier.26 5 mL of calcium-L-lactate solution (18 mM, pH 10), 5 mL of diammonium hydrogen phosphate solution (10.8 mM, 10 pH) and 7 mL of PEI solution (2 mg mL−1) were simultaneously pumped during 1 min into 20 mL of purified water. The dispersion was stirred for 20 min. To add DNA to the nanoparticles, 900 μL of this dispersion were mixed with 100 μL of DNA (1 mg mL−1).To add a silica shell, 5 μL TEOS and 2.6 μL 30–33% aqueous ammonia solution were dissolved in 4 mL ethanol. The CaP–DNA–PEI nanoparticle dispersion (1 mL) was added and stirred for 16 h at room temperature. The particles were purified by centrifugation at 20![[thin space (1/6-em)]](https://www.rsc.org/images/entities/char_2009.gif) 000g for 30 min and redispersed in 1 mL of water by ultrasonication for 10 s (UP50H, Hielscher, Ultrasound Technology; sonotrode 2, cycle 0.8, amplitude 70%). Subsequently, the silica shell was functionalized with thiol groups by silanization. 5 μL of 3-mercaptopropyltrimethoxysiloxan (MPS) were dissolved in 4 mL of ethanol and stirred for 8 h after the addition of the colloidal dispersion. Purification was performed as described above. The concentration of DNA in the dispersion was determined by dissolving the particles in hydrochloric acid and measuring the absorbance at 260 nm. The analysis showed that about 43 μg mL−1 of DNA were present in the colloid which corresponds to about 43% of the initial amount.
000g for 30 min and redispersed in 1 mL of water by ultrasonication for 10 s (UP50H, Hielscher, Ultrasound Technology; sonotrode 2, cycle 0.8, amplitude 70%). Subsequently, the silica shell was functionalized with thiol groups by silanization. 5 μL of 3-mercaptopropyltrimethoxysiloxan (MPS) were dissolved in 4 mL of ethanol and stirred for 8 h after the addition of the colloidal dispersion. Purification was performed as described above. The concentration of DNA in the dispersion was determined by dissolving the particles in hydrochloric acid and measuring the absorbance at 260 nm. The analysis showed that about 43 μg mL−1 of DNA were present in the colloid which corresponds to about 43% of the initial amount.
After the synthesis, both types of particles were freeze-dried in the presence of trehalose as a cryoprotectant.21 10 mg mL−1 of D-(+)-trehalose dihydrate (Sigma-Aldrich) were added to a 1 mL aliquot of the dispersion. The aliquots were shock-frozen in liquid nitrogen and subsequently freeze-dried at 0.31 mbar and −10 °C. The particles were redispersed in the same amount of water before use in cell culture experiments.
Synthesis of fluorescent single-shell calcium phosphate nanoparticles: CaP–PEI
Fluorescing single-shell CaP–PEI nanoparticles were prepared by functionalizing the calcium phosphate core with FITC-labelled PEI. Equal volumes (0.5 mL) of calcium-L-lactate (6.25 mM, pH 9) and diammonium hydrogen phosphate (3.74 mM, pH 9) were pumped into a solution of PEI–FITC (2 mg mL−1, 0.2 mL). The dispersion was purified by ultracentrifugation (20![[thin space (1/6-em)]](https://www.rsc.org/images/entities/char_2009.gif) 000g, 20 min) and redispersed in the same amount of water by ultrasonication for 10 s (Hielscher UP400S; 20% amplitude). These particles were used in the cell culture experiments after the synthesis without prior to freeze-drying.
000g, 20 min) and redispersed in the same amount of water by ultrasonication for 10 s (Hielscher UP400S; 20% amplitude). These particles were used in the cell culture experiments after the synthesis without prior to freeze-drying.
Incubation of cells with nanoparticles
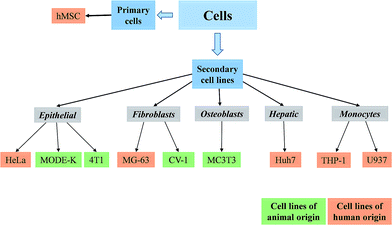
The amount of calcium in the colloidal dispersions was determined by AAS. This was converted into the amount of calcium phosphate by assuming the stoichiometry of hydroxyapatite, Ca5(PO4)3OH. Before the AAS measurement, the particles were dissolved in hydrochloric acid. Using the density of hydroxyapatite and the particle diameter by SEM, we computed the particle concentration, assuming a spherical shape of the particles (see ref. 27 and 28 for a typical calculation).Nine cell lines and one primary cell culture of human mesenchymal stem cells (hMSCs) were cultivated in cell culture flasks (Sarstedt, USA) under 5% CO2 and humidified atmosphere and 37 °C according to standard cell culture protocols. All cell types and passage ranges as well as the corresponding cell media are given in Table 1.
| # | Cell line | Passage | Description | Characteristics | Cell culture medium |
|---|---|---|---|---|---|
| 1 | HeLa | P21–24 | Human epithelial cervical cancer cells | Adherent, epithelial | DMEM + 100 U mL−1 streptomycin/penicillin + 10% FCS |
| 2 | MG-63 | P37–39 | Human osteosarcoma cells | Adherent, fibroblasts | |
| 3 | Huh 7 | P7–9 | Human hepato cellular carcinoma cells | Adherent, epithelial-like hepatoma cell line | DMEM + 100 U mL−1 streptomycin/penicillin + 10% FCS + 1% NEAA |
| 4 | CV-1 | P8–10 | Monkey kidney fibroblast cells | Adherent, fibroblasts | |
| 5 | Mode-K | P13–15 | Mouse intestinal epithelial cells | Adherent, epithelial | DMEM + 100 U mL−1 streptomycin/penicillin + 10% FCS + 2 mM L-glutamine |
| 6 | MC3T3 | P9–11 | Osteoblastic cell line from mouse calvaria | Adherent, fibroblast-like | αMEM + 100 U mL−1 streptomycin/penicillin + 10% FCS |
| 7 | U937 | P8–10 | Human histiocytic leukemia cell line | Suspension, monocytes | RPMI-1640 + 100 U mL−1 streptomycin/penicillin + 10% FCS + 10 mM hepes + 2 mM L-glutamine |
| 8 | THP-1 | P47–49 | Human acute monocytic leukemia cell line | Suspension, monocytes | |
| 9 | 4T1 | P21–23 | Mammary carcinoma cells from mouse mammary gland | Adherent, epithelial | RPMI-1640 + 100 U mL−1 streptomycin/penicillin + 10% FCS |
| 10 | hMSC | P6–7 | Human bone marrow mesenchymal stem cells | Adherent, stem cells | Mesenchymal stem cells (MSC) growth medium |
For microscopic imaging and viability assays, all cells were passaged at the same day, except for the suspension cell lines (THP-1 and U937). In order to obtain adherent cells, THP-1 and U937 cells were previously seeded in 96-well plates (Sarstedt, USA) in a density of 5 × 10³ cells per well in 100 μL of cell medium and differentiated into macrophages by the addition of 100 nM of PMA (4β-phorbol-12β-myristate-13α-acetate, Sigma-Aldrich, USA) solution per well and incubated for 3 days. Afterwards, the cell medium was changed and the cells were further treated exactly like the other cell lines.
One day before the incubation with nanoparticles or Lipofectamine, all adherent cell lines were trypsinized with trypsin/EDTA solution (Gibco™, Life Technologies, USA) and seeded in 96-well plates in a density of 5 × 10³ cells per well in 100 μL of cell medium (2 × 10³ cells for CV-1 cells because of the high proliferation rate).
Approximately 24 h later, the cell culture medium was removed and 100 μL of fresh medium containing either DNA-loaded nanoparticles or Lipofectamine was added to the cells. The final concentration of DNA was 0.3 μg per well. This corresponded to about 7.97 × 10⁹ CaP–DNA–CaP–PEI particles per well or 1.31 × 10⁹ CaP–PEI–DNA–SiO2–SH particles per well. The transfection with Lipofectamine was carried out according to the manufacturer's recommendation, adjusted for 96-well plate volumes. The concentration of DNA in Lipofectamine-treated samples was 0.2 μg per well. Approximately 18 h after the incubation with transfection agents, the cell medium for all samples was changed and the cells were incubated for another 48 h. The transfection efficiency was obtained by imaging the cells by fluorescence and light microscopy and computed as follows:
| (number of green fluorescent cells)/(number of all cells) × 100% |
Two images were taken per well, and for each cell type two separate wells were prepared. The whole experiment was performed twice, giving a total of 2 × 2 × 2 = 8 data points for each cell type.
qPCR analyses
qPCR probes the production of eGFP on the mRNA level. Again, an average is obtained by analysis of a whole cell culture sample. After trypsinization and centrifugation (900 rpm, 3 min), the cells were lysed in lysis buffer (Qiagen, Hilden, Germany) and frozen at −80 °C until total RNA isolation. Total RNA was purified from lysed cells with the RNeasy Kit from Qiagen (Hilden, Germany) according to the manufacturer's instructions. After isolation of the RNA, about 1 μg of RNA was used for cDNA synthesis. cDNA was synthesized with MMV-L (H-) point mutant reverse transcriptase (Promega, Fitchburg, USA). About 5 to 20 ng of cDNA were used for qPCR analysis. Each sample in qPCR was analysed in duplicate. SYBR green master mix (life technologies, Carlsbad, USA) was used for amplification and detection. Relative amounts of mRNA were calculated from standard curves and normalized to the housekeeping gene RPS9. The following primers were used:RPS9:
5′ CTGGACGAGGGCAAGATGAAGC
3′ TGACGTTGGCGGATGAGCACA
eGFP:
5′ CTACGGCGTGCAGTGCTTCAG
3′ CTCGGCGCGGGTCTTGTAG
In all cases, cells cultivated under the same conditions but without any treatment, were used as control.
Cell viability
The cell viability was analysed by an MTT-assay 48 h after the transfection. MTT (3-(4,5-dimethylthiazol-2-yl)-2,5-diphenyltetrazolium bromide; Molecular probes™, Life Technologies, Carlsbad, USA) was dissolved in PBS (5 mg mL−1) and then added to the required amount of cell culture medium to give a final MTT concentration of 1 mg mL−1. The cell culture medium of the transfected cells was replaced with the MTT-containing medium (150 μL) and incubated for 1 h at 37 °C under 5% CO2 in humidified atmosphere. Then the MTT-containing medium was removed and 150 μL of dimethyl sulfoxide (DMSO) was added to each well and incubated for another for 30 min. Finally, two aliquots of 50 μL from each well were taken for the photometric analysis at λ = 570 nm. The absorption of the supernatant of the transfected cells was normalized to that of the control (untreated cells).Uptake of nanoparticles by cells
For the uptake studies, cells were seeded into 8-well culture slides (Falcon, USA) with 5 × 10⁴ cells per well in 500 μL of cell medium as described previously for the transfection experiments. The cells were treated with 70 μL of PEI–FITC functionalized single shell calcium phosphate nanoparticles (1.32 × 10¹⁰ particles) and left for 3 h incubation. Afterwards, the cells were washed 3 times with PBS and fixed with 3.7% solution of formaldehyde to remove any adhering or dispersed nanoparticles. Then, the formaldehyde solution was removed, the cells were washed twice with PBS and stained with Cell Mask® (Molecular Probes™, Life Technologies, USA) and DAPI (4′,6-diamidino-2-phenylindole, Molecular Probes™, Life Technologies, USA) dyes to visualise the cell membrane and the nucleus, respectively.The nanoparticle uptake was visualized by fluorescence microscopy with a Keyence Biorevo BZ-9000 microscope equipped with filters for TRITC (excitation: 540/25, emission: 605/55), GFP BP (excitation: 470/40, emission: 535/50) and DAPI (excitation: 360/40, emission: 460/50) channels under 40× magnification.
Results and discussion
We have studied the reaction of cell types of different origin and differentiation state to nanoparticles (see Fig. 1 and Table 1). We used a range of cells of animal origin as well as of human origin.Two types of calcium phosphate nanoparticles were synthesized and loaded with eGFP-DNA for transfection of the different cell lines. The full characterization of the particles is given in Table 2.
| Type of nanoparticles | Concentration of DNA/μg mL−1 | Diameter by SEM/nm | Diameter by DLS/nm | PDI by DLS | Zeta potential by DLS/mV | Number of particles/mL−1 | Number of DNA molecules per particle |
|---|---|---|---|---|---|---|---|
| CaP–PEI–DNA–SiO2–SH | 46 ± 10 | 40–140 | 739 ± 24 | 0.4–0.56 | +24 ± 1 | ∼1.25 × 10¹¹ | ∼119 |
| CaP–DNA–CaP–PEI | 8 ± 3 | 40–100 | 437 ± 180 | 0.3–0.5 | +20 ± 1 | ∼2.02 × 10¹¹ | ∼12 |
| CaP–PEI–FITC | — | 30–70 | 209 ± 5 | 0.5–0.7 | +21 ± 1 | ∼1.88 × 10¹¹ | — |
SEM images of the particles show mainly spherical primary particles in the size range between 30 nm and 140 nm (Fig. 2). DLS analysis gave particle sizes between 400 nm and 750 nm, indicating some degree of agglomeration in the dispersion. Note that an excessive use of ultrasound to enhance the dispersion is not recommended because the biomolecules may be damaged.29 The zeta potential of +20 to +25 mV is at the border for a purely electrostatic colloidal stabilization, but the presence of the polyelectrolyte polyethyleneimine (PEI) adds a steric component to the colloidal dispersion.24
 | ||
| Fig. 2 SEM images of the calcium phosphate nanoparticles: (A) CaP–PEI–DNA–SiO2–SH; (B) CaP–DNA–CaP–PEI; (C) CaP–PEI–FITC. | ||
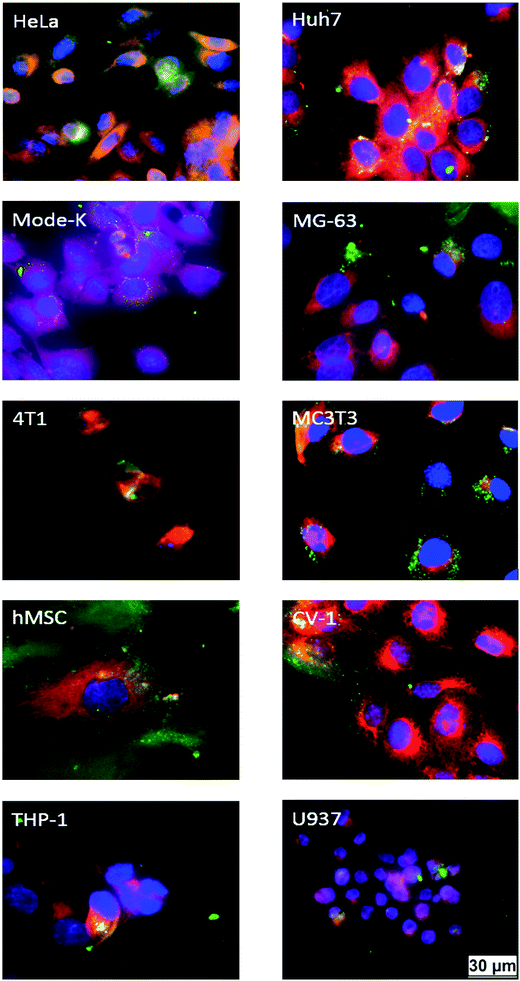
The first barrier for a successful transfection is the cell membrane. In order to verify whether all cells take up the calcium phosphate nanoparticles, fluorescing particles without DNA, but with an outer layer of FITC–PEI were prepared. The uptake of calcium phosphate nanoparticles by HeLa cells has been previously investigated by confocal laser scanning microscopy (CLSM). The uptake of nanoparticles occurred already during 3 h of incubation.28
To study the uptake of nanoparticles, we used positively charged single-shell particles (CaP–PEI–FITC) with a very similar diameter of the DNA-loaded particles. Their zeta potential was identical to that of the DNA-loaded particles (Table 2). The ten cell types readily took up calcium phosphate nanoparticles during 3 h of incubation (Fig. 3). Although the extent of particle uptake was different for the cell lines, and appeared to vary between individual cells, nanoparticles and cells were clearly co-localized. This indicates that the particles are present inside the cell and not just adsorbed on the surface, as shown earlier for HeLa cells.28,30
This is a prerequisite for the subsequent transfection that is clearly fulfilled for all cell types. However, there are different possibilities for cells to take up nanoparticles (e.g. endocytosis, micropinocytosis, phagocytosis).16,31–34 The nanoparticles end up in different intracellular compartments (endosome, lysosome, phagosome), and the DNA might be degraded before it enters the lysosome and finally the nucleus.
For the transfection experiments, the amount of DNA per well was kept constant for all cell types in the case of the nanoparticles. As control, Lipofectamine was used with the DNA concentration as recommended by the manufacturer. Because the concentration of DNA was different in both nanoparticle formulations, the number of particles per well was also different. However, the number of particles per well was much larger than the number of cells (Table 2).
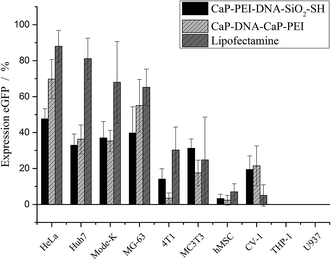
Fig. 4 shows the expression of eGFP by the different cell lines after the transfection. Brightfield and fluorescence images were microscopically recorded. While transfected cells were visible only in the fluorescence images, all cells were visible in the brightfield images. The transfection efficiency was obtained from microscopic images by counting the fraction of green cells. The numerical transfection data are shown in Fig. 5 and Table 3.
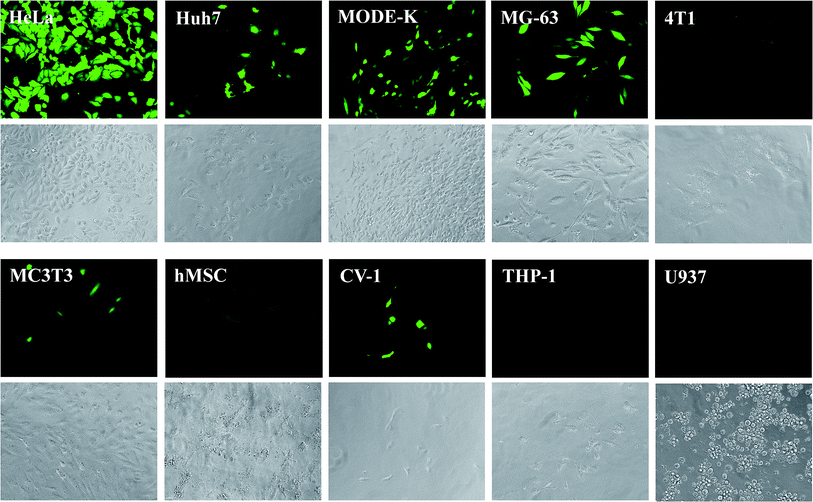 | ||
| Fig. 4 Fluorescence and brightfield micrographs, showing the eGFP expression in different cell types after transfection with CaP–DNA–CaP–PEI nanoparticles. Brightfield images are shown below the corresponding fluorescence images. For CaP–PEI–DNA–SiO2–SH-nanoparticles, very similar results were obtained (see Table 3). | ||
| CaP–PEI–DNA–SiO2–SH | CaP–DNA–CaP–PEI | Lipofectamine | |
|---|---|---|---|
| HeLa | 878 | 2461 | 436 |
| Huh7 | 1325 | 497 | 735 |
| Mode-K | 448 | 2262 | 896 |
| MG-63 | 794 | 652 | 886 |
| 4T1 | 187 | 220 | 88 |
| MC3T3 | 532 | 747 | 102 |
| hMSC | 85 | 111 | 56 |
| CV-1 | 208 | 139 | 49 |
| THP-1 | >200 | >200 | >200 |
| U937 | >200 | >200 | >200 |
The numbers of cells that were counted to determine the transfection efficiency are given in Table 3. The numbers denote the cells counted in the brightfield images, i.e. 100% of the cells of which a fraction was green fluorescent due to transfection with eGFP. For THP-1 and U937 cells, no transfection was observed (no green fluorescent cells).
Clear distinctions in the transfection efficiency between the ten cell types are seen. The most effective transfection results were obtained with HeLa, Huh7, Mode-K and MG-63 cell lines with both nanoparticles and Lipofectamine. Lipofectamine was the most efficient transfection agent, but the efficiency of the nanoparticles was typically close to Lipofectamine. There were no major differences between the two types of cationic calcium phosphate nanoparticles, indicating that their surface termination (thiol or PEI) did not play a major role.
A set of cell types that was transfected with much lower efficiency comprised 4T1, MC3T3, hMSC, and CV-1 cells. The only two cell lines that were transfected by any of three applied transfection agents were the monocyte cell lines U937 and THP-1, which were previously differentiated into macrophages. Although these cells took up the nanoparticles as shown in Fig. 3, a transfection of these cell lines did not occur. This indicates that the DNA was not processed inside the cells.
Fig. 5 quantitatively shows that some cell types are more easily transfectable than others. In fact, the cells that were transfected with high efficiency were cells that divide more rapidly, namely HeLa, Huh7, Mode-K, and MG-63. It is noteworthy that for efficiently transfected cells, a higher cytotoxicity was observed as well. These cells were also highly abundant on the images (Table 3), indicating their higher proliferation rate. The correlation of the transfection efficiency with the proliferation rate is in line with reports in the literature that showed a dependence of the transfection on cell division. In order to promote protein expression the plasmid DNA must enter the nucleus. This crucial step was shown to occur after mitosis in HeLa cells, independently from the transfection agent used, as observed by life cell imaging.35,36 The protein expression was observed 2–5 h after mitosis.36 Furthermore, it was shown for hMSC that cells were transfected more efficiently under conditions that promote cell division.37 On the other hand, cells that divide very slowly or not at all were transfected only poorly or even not at all (4T1, hMSC, THP-1, U937).
The low transfection efficiency in monocytes/macrophages may also be due to high enzymatic activities in phagosomes/phagolysosomes. It is likely that these cell lines take up the nanoparticles and Lipofectamine by phagocytosis and not by endocytosis. Macrophages are scavenging cells with a high level of digestive enzymes which will degrade DNA in the phagosome, resulting in an inefficient transfection.38
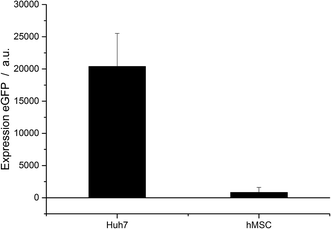
To underline the uptake and transfection results, the transfection efficiency was also measured at the mRNA level of protein expression (Fig. 6). The two cell types Huh7 and hMSC were analysed by qPCR. Transfection was carried out with CaP–PEI–DNA–SiO2–SH nanoparticles.
The different transfection efficiencies of the different cell types were even more pronounced by qPCR analysis. The relative expression of eGFP in untreated control cells was normalized to 1. In the case of the Huh7 cells, the mRNA signal of eGFP was 20![[thin space (1/6-em)]](https://www.rsc.org/images/entities/char_2009.gif) 000 times elevated in comparison to the untreated control cells. In the case of hMSC, the signal was only 1000 times higher.
000 times elevated in comparison to the untreated control cells. In the case of hMSC, the signal was only 1000 times higher.
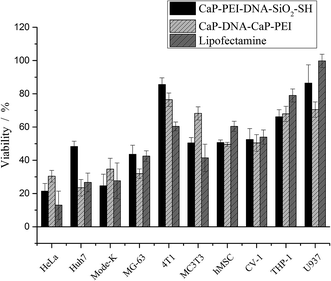
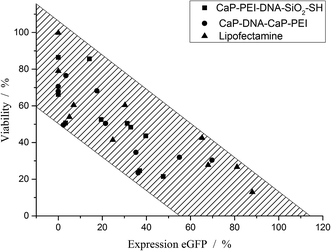
On the other hand, the cell viability showed a completely different trend (Fig. 7). The cell lines that were efficiently transfected also displayed a high toxicity, and poorly transfected cell lines were less sensitive, even though all cell lines took up particles (Fig. 3). This correlation was independent from the transfection agent used, i.e. nanoparticles or Lipofectamine.
Fig. 8 shows the correlation between the cell viability and the transfection efficiency. It is important to note that a correlation never proves a causality, but may point to the fact that two variables (in this case, the transfection efficiency and the cell viability) depend on a third common parameter. This parameter is not yet known, but possibly the cationic compounds Lipofectamine and poly(ethyleneimine) are on the one hand promoting the uptake and the endosomal escape of DNA, and on the other hand have harmful side effects.39–42
Liu et al. showed that lysosomal rupture may cause necrosis.43 However, the transfection efficiency depends also on the lyso-/endosomal release of the DNA in the case of the transfection agents used (Fig. 9). Elevated intracellular calcium levels induced by nanoparticles should not play a major role causing the toxicity by apoptosis as shown earlier.44,45
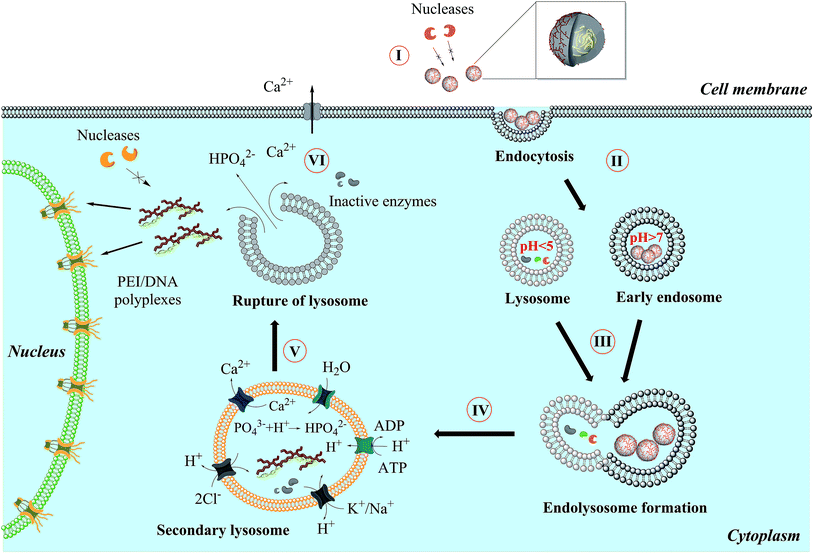 | ||
| Fig. 9 General mechanism proposed for the uptake and intracellular processing of calcium phosphate nanoparticles by cells. | ||
Fig. 9 shows the general mechanism which we propose for the uptake of calcium phosphate nanoparticles by eukaryotic cells. A nanoparticle loaded with pDNA (plasmid DNA) (I) must overcome a number of biological barriers to enter the cell nucleus and finally be processed inside.46 After endocytosis (II), the nanoparticles end up in an endosome that then fuses with a lysosome (III). Unless the lysosome bursts before the full degradation of the DNA, the degraded DNA will not be effective anymore, and the transfection efficiency will be zero.1,5,19,47 An endosomal escape is supported by an increased osmotic pressure inside the lysosome due to neutralization of acid by suitable basic compounds (IV). Poly(ethyleneimine) is well known for the so-called proton sponge effect,48 and the acid-soluble calcium phosphate will also lead to a considerable number of calcium and hydrogen phosphate ions after dissolution.43,44,49,50 The lysosome ruptures (V) and released its cargo into the cytosol. Excess calcium is pumped out (VI) and the DNA is entering the nucleus, possibly together with PEI as polyplex.
Cell uptake studies performed with different synthetic vectors and on different cell types showed that endocytosis occurs efficiently either by the clathrin and/or by caveolae-dependent pathways.47,51–57 Cationic calcium phosphate nanoparticles were shown to enter HeLa cells by micropinocytosis.28
When the endocytosis of pDNA/cationic polymer polyplexes occurs by the clathrin-dependent pathway, these polyplexes can escape from the endosomal route and reach the cytosol, taking advantage of the proton sponge effect induced by the polymers that not only carry cationic groups for condensing pDNA, but also basic groups like secondary amines42,48,58–60 or imidazole rings.61 To enhance the nuclear targeting of pDNA, specific DNA sequences recognized by transcription factors such as NFkB can be inserted into pDNA.62–64 However, the sub-cellular trafficking of pDNA to the nucleus up to now remains unclear and poorly described in the literature.46
Conclusions
Different cell lines show a different susceptibility to transfection, despite the fact that they all take up nanoparticles. This is negatively correlated with the cell viability, irrespective of the transfection agent, pointing to a hitherto unknown common mechanism of transfection and cytotoxicity. Transfection systems that show a good transfection efficiency cause to a high cytotoxicity and vice versa. Altogether, we have shown that cells react very differently to transfection agents, including nanoparticles, and that one may not generalize results obtained for one cell line.Acknowledgements
This work was supported by the Deutsche Forschungsgemeinschaft (DFG) to M. E. and A. M. W. within the projects Ep 22/35-1 and We 4472/5-1. We are grateful to Prof. Mengji Lu for the provision of Huh7 cells.References
- F. Pérez-Martínez, J. Guerra, I. Posadas and V. Ceña, Pharm. Res., 2011, 28, 1843–1858 CrossRef PubMed.
- P. Midoux, C. Pichon, J. J. Yaouanc and P. A. Jaffres, Br. J. Pharmacol., 2009, 157, 166–178 CrossRef CAS PubMed.
- S. Bhattacharya and A. Bajaj, Chem. Commun., 2009, 4632–4656 RSC.
- M. Morille, C. Passirani, A. Vonarbourg, A. Clavreul and J. P. Benoit, Biomaterials, 2008, 29, 3477–3496 CrossRef CAS PubMed.
- I. S. Zuhorn, J. B. F. N. Engberts and D. Hoekstra, Eur. Biophys. J., 2007, 36, 349–362 CrossRef CAS PubMed.
- J. Kurreck, Angew. Chem., Int. Ed., 2009, 48, 1378–1398 CrossRef CAS PubMed.
- J. Wang, Z. Lu, M. G. Wientjes and J. L. S. Au, AAPS J., 2010, 12, 492–503 CrossRef CAS PubMed.
- A. S. Abdolhamid, S. S. Hedayati, R. H. Poor, S. Madani, S. S. Poor and S. Panahi, J. Genet., 2010, 89, 527–537 CrossRef.
- P. N. Pushparaj and A. J. Melendez, Clin. Exp. Pharmacol. Physiol., 2006, 33, 504–510 CrossRef CAS PubMed.
- X. Guo and L. Huang, Acc. Chem. Res., 2012, 45, 971–979 CrossRef CAS PubMed.
- D. Reischl and A. Zimmer, Nanomedicine, 2009, 5, 8–20 CrossRef CAS PubMed.
- J. Zabner, A. J. Fasbender and T. Moninger, J. Biol. Chem., 1995, 270, 18997–19007 CrossRef CAS PubMed.
- M. Nishikawa and L. Huang, Hum. Gene Ther., 2001, 12, 861–870 CrossRef CAS PubMed.
- C. M. Wiethoff and C. R. Middaugh, J. Pharm. Sci., 2003, 92, 203–217 CrossRef CAS PubMed.
- S. C. de Smedt, K. Remaut, B. Lucas, K. Braeckmans, N. N. Sanders and J. Demeester, Adv. Drug Delivery Rev., 2005, 57, 191–210 CrossRef CAS PubMed.
- H. Hillaireau and P. Couvreur, Cell. Mol. Life Sci., 2009, 66, 2873–2896 CrossRef CAS PubMed.
- M. S. Shim and Y. J. Kwon, FEBS J., 2010, 277, 4814–4827 CrossRef CAS PubMed.
- F. M. Kievit and M. Q. Zhang, Adv. Mater., 2011, 23, H217–H247 CrossRef CAS PubMed.
- P. Kesharwani, V. Gajbhiye and N. K. Jain, Biomaterials, 2012, 33, 7138–7150 CrossRef CAS PubMed.
- V. Sokolova and M. Epple, Angew. Chem., Int. Ed., 2008, 47, 1382–1395 CrossRef CAS PubMed.
- J. Klesing, S. Chernousova and M. Epple, J. Mater. Chem., 2012, 22, 199–204 RSC.
- X. Ming, K. Sato and R. L. Juliano, J. Controlled Release, 2011, 153, 83–92 CrossRef CAS PubMed.
- B. Dalby, S. Cates, A. Harris, E. C. Ohki, M. L. Tilkins, P. J. Price and V. C. Ciccarone, Methods, 2004, 33, 95–103 CrossRef CAS PubMed.
- V. Sokolova, S. Neumann, A. Kovtun, S. Chernousova, R. Heumann and M. Epple, J. Mater. Sci., 2010, 45, 4952–4957 CrossRef CAS.
- V. V. Sokolova, I. Radtke, R. Heumann and M. Epple, Biomaterials, 2006, 27, 3147–3153 CrossRef CAS PubMed.
- D. Kozlova, S. Chernousova, T. Knuschke, J. Buer, A. M. Westendorf and M. Epple, J. Mater. Chem., 2012, 22, 396–404 RSC.
- G. Doerdelmann, D. Kozlova, S. Karczewski, R. Lizio, S. K. Knauer and M. Epple, J. Mater. Chem. B, 2014, 2, 7250–7259 RSC.
- V. Sokolova, D. Kozlova, T. Knuschke, J. Buer, A. M. Westendorf and M. Epple, Acta Biomater., 2013, 9, 7527–7535 CrossRef CAS PubMed.
- M. L. Wu, S. S. Freitas, G. A. Monteiro, D. M. Prazeres and J. A. Santos, Biotechnol. Appl. Biochem., 2009, 53, 237–246 CAS.
- V. Sokolova, O. Rotan, J. Klesing, P. Nalbant, J. Buer, T. Knuschke, A. M. Westendorf and M. Epple, J. Nanopart. Res., 2012, 14, 910 CrossRef.
- I. Canton and G. Battaglia, Chem. Soc. Rev., 2012, 41, 2718–2739 RSC.
- T. G. Iversen, T. Skotland and K. Sandvig, Nano Today, 2011, 6, 176–185 CrossRef CAS.
- G. Sahay, D. Y. Alakhova and A. V. Kabanov, J. Controlled Release, 2010, 145, 182–195 CrossRef CAS PubMed.
- G. J. Doherty and H. T. McMahon, Annu. Rev. Biochem., 2009, 78, 857–902 CrossRef CAS PubMed.
- K. Hakamada and J. Miyake, J. Biosci. Bioeng., 2012, 113, 124–127 CrossRef CAS PubMed.
- I. Kirchenbuechler, D. Kirchenbuechler and M. Elbaum, Exp. Cell Res., 2015 DOI:10.1016/j.yexcr.2014.11.019.
- W. J. King, N. A. Kouris, S. Choi, B. M. Ogle and W. L. Murphy, Cell Tissue Res., 2012, 347, 689–699 CrossRef CAS PubMed.
- S. Dokka, D. Toledo, X. Shi, J. Ye and Y. Rojanasakul, Int. J. Pharm., 2000, 206, 97–104 CrossRef CAS PubMed.
- H. T. Lv, S. B. Zhang, B. Wang, S. H. Cui and J. Yan, J. Controlled Release, 2006, 114, 100–109 CrossRef CAS PubMed.
- A. Paul, C. J. Eun and J. M. Song, Polymer, 2014, 55, 5178–5188 CrossRef CAS.
- W. T. Godbey, K. K. Wu and A. G. Mikos, Biomaterials, 2001, 22, 471–480 CrossRef CAS PubMed.
- A. Akinc, M. Thomas, A. M. Klibanov and R. S. Langer, J. Gene Med., 2005, 7, 657–663 CrossRef CAS PubMed.
- Z. Liu, Y. Xiao, W. Chen, Y. Wang, B. Wang, G. Wang, X. Xu and R. Tang, J. Mater. Chem. B, 2014, 2, 3480–3489 RSC.
- S. Neumann, A. Kovtun, I. D. Dietzel, M. Epple and R. Heumann, Biomaterials, 2009, 30, 6794–6802 CrossRef CAS PubMed.
- Y. C. Tseng, A. Yang and L. Huang, Mol. Pharm., 2013, 10, 4391–4395 CrossRef CAS PubMed.
- B. Maury, C. Goncalves, G. Tresset, M. Zeghal, H. Cheradame, P. Guegan, C. Pichon and P. Midoux, Biomaterials, 2014, 35, 5977–5985 CrossRef CAS PubMed.
- C. Pichon, L. Billiet and P. Midoux, Curr. Opin. Biotechnol., 2010, 21, 640–645 CrossRef CAS PubMed.
- G. Creusat, A. S. Rinaldi, E. Weiss, R. Elbaghdadi, J. S. Remy, R. Mulherkar and G. Zuber, Bioconjugate Chem., 2010, 21, 994–1002 CrossRef CAS PubMed.
- A. E. Ewence, M. Bootman, H. L. Roderick, J. N. Skepper, G. McCarthy, M. Epple, M. Neumann, C. M. Shanahan and D. Proudfoot, Circ. Res., 2008, 103, e28–e32 CrossRef CAS PubMed.
- Y. Dautova, D. Kozlova, J. N. Skepper, M. Epple, M. D. Bootman and D. Proudfoot, PLoS One, 2014, 9, e97565 Search PubMed.
- L. Billiet, J. P. Gomez, M. Berchel, P. A. Jaffres, T. Le Gall, T. Montier, E. Bertrand, H. Cheradame, P. Guegan, M. Mevel, B. Pitard, T. Benvegnu, P. Lehn, C. Pichon and P. Midoux, Biomaterials, 2012, 33, 2980–2990 CrossRef CAS PubMed.
- C. Troiber and E. Wagner, Bioconjugate Chem., 2011, 22, 1737–1752 CrossRef CAS PubMed.
- D. Vercauteren, J. Rejman, T. F. Martens, J. Demeester, S. C. De Smedt and K. Braeckmans, J. Controlled Release, 2012, 161, 566–581 CrossRef CAS PubMed.
- T. E. Park, B. Kang, Y. K. Kim, Q. Zhang, W. S. Lee, M. A. Islam, S. K. Kang, M. H. Cho, Y. J. Choi and C. S. Cho, Biomaterials, 2012, 33, 7272–7281 CrossRef CAS PubMed.
- C. Y. Hsu and H. Uludag, Biomaterials, 2012, 33, 7834–7848 CrossRef CAS PubMed.
- Z. Hyvonen, V. Hamalainen, M. Ruponen, B. Lucas, J. Rejman, D. Vercauteren, J. Demeester, S. De Smedt and K. Braeckmans, J. Controlled Release, 2012, 162, 167–175 CrossRef CAS PubMed.
- S. Yamano, J. Dai, C. Yuvienco, S. Khapli, A. M. Moursi and J. K. Montclare, J. Controlled Release, 2011, 152, 278–285 CrossRef CAS PubMed.
- O. Boussif, F. Lezoualch, M. A. Zanta, M. D. Mergny, D. Scherman, B. Demeneix and J. P. Behr, Proc. Calif. Acad. Sci., 1995, 92, 7297–7301 CrossRef CAS.
- R. K. Oskuee, A. Philipp, A. Dehshahri, E. Wagner and M. Ramezani, J. Gene Med., 2010, 12, 729–738 CrossRef CAS PubMed.
- C. Lin and J. F. Engbersen, J. Controlled Release, 2008, 132, 267–272 CrossRef CAS PubMed.
- C. Pichon, C. Gonçalves and P. Midoux, Adv. Drug Delivery Rev., 2001, 53, 75–94 CrossRef CAS PubMed.
- A. Hayer, M. Stoeber, D. Ritz, S. Engel, H. H. Meyer and A. Helenius, J. Cell Biol., 2010, 191, 615–629 CAS.
- C. Goncalves, M. Y. Ardourel, M. Decoville, G. Breuzard, P. Midoux, B. Hartmann and C. Pichon, J. Gene Med., 2009, 11, 401–411 CrossRef CAS PubMed.
- A. Mesika, I. Grigoreva, M. Zohar and Z. Reich, Mol. Ther., 2001, 3, 653–657 CrossRef CAS PubMed.
| This journal is © The Royal Society of Chemistry 2016 |

