
 Open Access Article
 This Open Access Article is licensed under a
 Creative Commons Attribution 3.0 Unported Licence
The oxidation of copper catalysts during ethylene epoxidation†
M. T.
Greiner
*a,
T. E.
Jones
a,
B. E.
Johnson
a,
T. C. R.
Rocha
a,
Z. J.
Wang
a,
M.
Armbrüster
b,
M.
Willinger
a,
A.
Knop-Gericke
a and
R.
Schlögl
a
aFritz-Haber Institute of the Max-Planck Society, Inorganic Chemistry Department, 4-6 Faradayweg, 14195 Berlin, Germany. E-mail: mgreiner@fhi-berlin.mpg.de
bInstitut für Chemie, Technische Universität Chemnitz, Straße der Nationen 62, R. 312, 09111, Chemnitz, Germany
First published on 28th August 2015
Abstract
The oxidation of copper catalysts during ethylene epoxidation was characterized using in situ photoemission spectroscopy and electron microscopy. Gas chromatography, proton-transfer reaction mass spectrometry and electron-ionization mass spectrometry were used to characterize the catalytic properties of the oxidized copper. We find that copper corrodes during epoxidation in a 1![[thin space (1/6-em)]](https://www.rsc.org/images/entities/char_2009.gif) :1 mixture of oxygen and ethylene. The catalyst corrosion passes through several stages, beginning with the formation of an O-terminated surface, followed by the formation of Cu2O scale and eventually a CuO scale. The oxidized catalyst exhibits measurable activity for ethylene epoxidation, but with a low selectivity of <3%. Tests on pure Cu2O and CuO powders confirm that the oxides intrinsically exhibit partial-oxidation activity. Cu2O was found to form acetaldehyde and ethylene epoxide in roughly equal amounts (1.0% and 1.2% respectively), while CuO was found to form much less ethyl aldehyde than ethylene epoxide (0.1% and 1.0%, respectively). Metallic copper catalysts were examined in extreme dilute-O2 epoxidation conditions to try and keep the catalyst from oxidizing during the reaction. It was found that in feed of 1 part O2 to 2500 parts C2H4 (PO2 = 1.2 × 10⁻⁴ mbar) the copper surface becomes O-terminated. The O-terminated surface was found to exhibit partial-oxidation selectivity similar to that of Cu2O. With increasing O2 concentration (>8/2500) Cu2O forms and eventually covers the surface.
:1 mixture of oxygen and ethylene. The catalyst corrosion passes through several stages, beginning with the formation of an O-terminated surface, followed by the formation of Cu2O scale and eventually a CuO scale. The oxidized catalyst exhibits measurable activity for ethylene epoxidation, but with a low selectivity of <3%. Tests on pure Cu2O and CuO powders confirm that the oxides intrinsically exhibit partial-oxidation activity. Cu2O was found to form acetaldehyde and ethylene epoxide in roughly equal amounts (1.0% and 1.2% respectively), while CuO was found to form much less ethyl aldehyde than ethylene epoxide (0.1% and 1.0%, respectively). Metallic copper catalysts were examined in extreme dilute-O2 epoxidation conditions to try and keep the catalyst from oxidizing during the reaction. It was found that in feed of 1 part O2 to 2500 parts C2H4 (PO2 = 1.2 × 10⁻⁴ mbar) the copper surface becomes O-terminated. The O-terminated surface was found to exhibit partial-oxidation selectivity similar to that of Cu2O. With increasing O2 concentration (>8/2500) Cu2O forms and eventually covers the surface.
Introduction
Ethylene epoxidation is an important topic both from an academic and industrial standpoint. Academically, it represents one of the most fundamental partial oxidation reactions, and is one of the most-studied catalytic reactions in surface-science.1 The understanding of catalytic epoxidation provides valuable insight into how heterogeneous catalysts permit a thermodynamically meta-stable molecule—such as an epoxide—to be preferentially synthesized over the thermodynamically most stable product, CO2.From an industrial point of view, ethylene epoxide is an important feedstock for the production of a variety of valuable materials and chemicals. It is produced worldwide in amounts of ca. 19 million tons annually (2010).2 It is usually produced via direct oxidation of ethylene by O2 over promoted silver catalysts, using promoters such as Cl, Cs and Re.3,4 Although the direct epoxidation process is relatively efficient—with selectivities greater than 85% achievable—given the large scale of epoxide production, even a 1% improvement in selectivity is worth close to $200M USD annually to producers.5 Furthermore, less expensive catalysts than silver and less-toxic promoters than chlorinated hydrocarbons are of interest to industry. While silver is the only catalyst that performs direct epoxidation well enough for use at an industrial scale,3 recent studies have demonstrated that copper also exhibits interesting epoxidation behavior and holds promise as a possible alternative or perhaps additive to silver catalysts.
It has been shown—via model ultra-high vacuum (UHV) studies of single crystals—that copper can epoxidize several olefins with very high selectivity.6–8 In fact, UHV studies using styrene as a model molecule for ethylene found that styrene can be epoxidized on Cu(111) with essentially 100% selectivity.8 In support of these findings, density functional theory (DFT) computations have also suggested that metallic copper should be a more selective catalyst than silver for epoxidation.9 Analysis of the reaction pathway, based on DFT computations, can explain copper's high selectivity in terms of its relative copper/oxygen and copper/carbon bond strengths in the oxametallacycle intermediate.10 Due to copper's strong bonding to oxygen and relatively weak bonding to carbon, the reaction pathway to the epoxide is favored over the pathway to the aldehyde.
These studies suggest that, in order for high-selectivity epoxidation to occur on copper, both metallic copper sites and adsorbed oxygen sites are required. Indeed, the UHV studies on Cu single crystals demonstrated high selectivities for copper surfaces covered with only 0.03 monolayers of atomic oxygen.8 After the copper surface became saturated with atomic oxygen it exhibited no measurable activity.8
Under industrial epoxidation conditions—i.e. in a mixture of O2 and an olefin at atmospheric pressures and temperature of 250–350 °C—copper does not remain metallic but rather oxidizes to form copper oxides,11,12 although there are some reports that suggest Cu(0) is present under atmospheric-pressure operating conditions in propylene epoxidation.13,14 Thus another consequence of copper's strong oxygen bonding is that, under high oxygen pressures, its surface cannot remain in a state that offers the same high selectivity of the oxygen-adsorbed metal.
The oxides of copper were believed not to be able to catalyze epoxidation.11,12,15 For instance, in propylene epoxidation Cu2O was found to generate acrolein, while CuO gave rise only to total oxidation.16 Contrary to this belief, a few recent works have implicated Cu(I) as an active species in epoxidation,17–19 although supported or promoted catalysts were investigated in these reports, so it is not certain whether the copper oxides alone are intrinsically active for epoxidation.
A recent work by Jayamurthy et al. demonstrated that oxidized copper can in fact epoxidize ethylene with an initial moderate selectivity of 28%, followed by a progressive decrease in selectivity to 1%.18 Based on ex situ X-ray diffraction measurements, the decrease in selectivity was attributed to oxidation of Cu(I) to Cu(II).
One possible route to keeping copper in an oxidation state that provides a selective pathway to epoxidation is via alloying with another metal. Copper–silver catalysts in ethylene epoxidation have demonstrated selectivities that are better than the respective pure metals.4,20,21 In this case, copper segregates to the silver surface and forms a surface oxide that is predicted to possess a unique electronic structure.22 It is postulated that the copper–silver interaction influences the copper oxidation state. This issue is not yet resolved, and a closer investigation of the oxidation behavior of copper in alloys is needed.
Although it is acknowledged in several publications that copper becomes oxidized under epoxidation conditions,11,12 an in-depth investigation of copper oxidation during epoxidation has not yet been documented in the literature. As it stands, it is not clear whether copper oxides are intrinsically active for epoxidation, whether the metal/oxide interface plays an important role, under what conditions metallic copper may remain stable during epoxidation, and what role copper oxidation plays in bimetallic catalysts.
In order to understand copper's behavior under epoxidation conditions we find it appropriate to examine the oxidation process in more detail. In the current report, we present an in situ photoemission study of the oxidation of copper during ethylene epoxidation. Our findings illustrate that the initial stages of copper corrosion proceed via the formation of an O-terminated surface, followed by the formation of Cu2O and eventually CuO layers. These findings are consistent with DFT computations of phase stability of O-terminated copper and copper–oxide surfaces.23–25 The corrosion of copper under these conditions is extensive, and the oxide layer continues to grow indefinitely with reaction time. However, oxidized copper was found to exhibit partial-oxidation activity, which is consistent with the recent observations of Jayamurthy et al.18
During the reaction in which partial-oxidation activity was detected from oxidized copper, copper metal was still present in the sample underneath the oxide layer, thus it is possible that the partial-oxidation activity originates from the metal/oxide interface rather than from the oxides themselves. In order to confirm that the copper oxides exhibit partial oxidation activity, we have examined pure un-supported Cu2O and CuO powders in epoxidation. We found that indeed both oxides (CuO and Cu2O) exhibit some partial oxidation activity; however, under the conditions used here (Ptotal = 0.3 mbar, T = 50–400 °C), rather low selectivity to ethylene oxide was observed (between 1–3%). In general, Cu2O was found to be slightly more selective than CuO for forming ethylene oxide. Cu2O was also found to produce a larger proportion of acetaldehyde than CuO. This finding is consistent with recent DFT computations that have predicted acetaldehyde formation to be favorable on Cu2O(001).26
After confirming that copper oxides can perform partial oxidation, we examined whether metallic copper could be maintained under near-ambient pressure epoxidation conditions. We examined the copper catalyst's surface composition when operated in a reactant feed of extremely dilute oxygen (ranging in oxygen-to-ethylene ratio from 1:2500 to 64:2500). We found that even in extremely dilute-O2 conditions, copper forms an oxygen-terminated surface, illustrating that the strong oxo-philic nature of copper combined with the weak reducing power of ethylene cannot maintain a metallic surface under realistic epoxidation conditions. Reactivity tests of the O-terminated surface reveal that it exhibits similar partial-oxidation selectivity to the oxides. With increasing oxygen concentration (>8:2500), Cu2O eventually nucleates and grows to cover the surface.
Experimental and computational methods
Near-ambient pressure photoemission spectroscopy measurements were performed at the ISISS beamline at the synchrotron radiation facility BESSY II of the Helmholtz-Zentrum Berlin. The NAP-XPS set-up consists of a differentially-pumped electrostatic lens and analyzer system, attached to a reaction cell. Details of this equipment are available elsewhere.27 During in situ measurements, reaction gases (from Westfalen AG, purities: ethylene 3.5 N and oxygen 6.0 N) were continuously flowed into the reaction cell via mass-flow controllers, using a total flow of 6 mL min−1, while a constant pressure of 0.3 mbar was maintained by continual pumping, via a molecular drag pump whose pumping speed was adjusted via a regulating valve. The samples were heated from the back side using an infrared laser, and temperature was measured via type K thermocouples clamped to the sample surface.The analysis of gas-phase products was performed using online gas chromatography (GC, Varian Micro-GC CP4900), electron-ionization quadrupole mass spectrometry (EI-QMS, from Balzers) and proton-transfer reaction mass spectrometry (PTR-MS, from Ionicon Analytik). All gas analytical instruments were calibrated for product quantification.
Cu L3-edge NEXAFS were measured in total-electron-yield (TEY) mode by measuring the current collected at the photoelectron spectrometer entrance nozzle. The O K-edge NEXAFS spectra were measured in Auger yield mode (measuring electrons of 493 eV kinetic energy) in order to avoid interference from the O2 gas-phase signal. For the Auger Yield spectra the probing depth was between 4.3 and 5.3 nm (depending on whether the material is Cu, Cu2O or CuO). The probing depth for the Cu L3-edge TEY spectra are about 10 nm.28 Here we define probing depth as the depth at which the measured signal falls below 1% of the intensity of the pure material.
The Cu-L3 edge of metallic copper was calibrated by taking the derivative of the absorption spectrum, then setting the peak position of the derivative spectrum to the binding energy of the Cu2p3/2, namely 932.67 eV. The M1 mirror on the ISISS beamline contains a small amount of Cu, so that measuring the mirror current shows a small absorption at the Cu-L3 edge. This signal was used as an internal standard. All spectra of the copper oxides could be calibrated by ensuring that the Cu-L3 signal seen in the mirror current for the oxide spectra lines up with the Cu-L3 signal of the mirror current for the metallic Cu standard. This calibration procedure gives the following Cu-L3 absorption peak positions: Cu (933.40 eV), Cu2O (933.56 eV) and CuO (931.26 eV), and the following Cu-L3 edge positions (i.e. the position of the peak of the derivative spectrum): Cu (932.67 eV), Cu2O (932.87 eV) and CuO (930.71 eV).
The copper foils used in the temperature ramp experiments were purchased from Advent Research Materials Ltd and were 99.998% pure on a metals basis. CuO and Cu2O powders were purchased from Sigma-Aldrich and were 99.999% and 99.99% pure (metals basis), respectively. Prior to all NAP-XPS experiments, copper metal surfaces were cleaned by several cycles of heating to 550 °C in 0.5 mbar H2 for 30 minutes, followed by sputter cleaning for 10 minutes using 1 kV Ar+. Copper foam was produced by sintering pre-pressed copper powder (ChemPur, 99.95%) in static vacuum at 700 °C for 12 hours.
Laboratory-based UHV photoemission and LEED measurements were performed at the Fritz-Haber Institute in Berlin, Dahlem, in a UHV chamber with a base pressure of 3 × 10⁻¹⁰ mbar. Photoemission measurements were done using a non-monochromated Al Kα X-ray source and a Phoibos 150 hemispherical analyzer from Specs GmbH. Copper single crystals were mechanically polished to a mirror finish and were sputter annealed in UHV until no contaminants were detectible and sharp LEED patterns were obtained.
All DFT calculations were performed using the Perdew, Burke, and Ernzerhof exchange (PBE) and correlation potential29 without spin-polarization, as implemented in Quantum ESPRESSO.30 Ultra-soft pseudopotentials from the PS library were used to describe the interactions between electrons and ions. In order to compute O K-edge spectra, two Gauge Including Augmented Wave (GIPAW) projectors were included for the l = 1 channel of the oxygen pseudopotential. Wave functions were expanded in a plane wave basis set with a kinetic energy cutoff of 30 Ry, and a charge density cutoff of 300 Ry. For the metallic surfaces Brillouin zone integrations were performed using a (12 × 12 × 1) Monkhorst–Pack31k point grid for the (1 × 1) surface unit cell. Marzari–Vanderbilt cold smearing32 was employed with a smearing parameter of 0.02 Ry to improve convergence. For the Cu2O calculations k point meshes were equivalent (16 × 16 × 16) for the conventional bulk unit cell (Cu4O2) and (16 × 16 × 1) for the surface unit cells.
Within this approach we found the lattice constant of fcc Cu to be 6.92 au, in good agreement with the 6.83 au found experimentally,33 and the 6.86 au obtained from full potential PBE calculations.34 Metallic surfaces were modeled as five layer slabs using the computed lattice constant and ca. 10 Å of vacuum separating periodic images. The bottom two layers of the slabs were held fixed at their bulk values during geometry optimizations. The remaining atoms were relaxed until the change in total energy was <10−4 Ry and all the components of all the forces was <10−3 Ry au−1. The initial adlayer structures were taken from Duan et al.35 The lattice constant of Cu2O was found to be 8.22 au, about 2% larger than the 8.07 au found experimentally, as may be expected for a GGA calculation. The Cu2O surfaces were calculated using 17-layer thick slab, separated by 20 Å of vacuum, with (2 × 2) surface unit cells (structures are shown in ESI†). The calculations on the bulk vacancy defect were done using a (2 × 2 × 2) supercell with a neutral stoichiometric (i.e. Cu2O) vacancy.
O1s binding energies were computed using the ΔSCF method to capture both initial and final state effects.36 The resultant relative binding energies were shifted to absolute binding energies using a reference calculation on a (4 × 4 × 4) supercell of Cu2O, for which we know the measured O1s BE is 530.2 eV.
The absorption cross section tensors used to generate spectra of oxygen in the c(6 × 2) reconstruction were computed with the XSpectra package,37 using a pseudopotential with a 1/2 O1s core hole on the absorbing atom.38 To account for lifetime broadening, the raw spectra were convoluted with a Lorentzian with an energy dependent linewidth: Γ(E) = Γ0 + Γ(E). Γ0 was taken as the natural linewidth of oxygen, 0.14 eV.39Γ(E) was assumed to increase linearly as Γ(E) = 0.1(E − EFermi). This empirical change in linewidth has been shown to be reasonable for many systems.40 The Fermi energy of the computed spectra was set to the computed O1s binding energy to facilitate comparison with experimental results.
The absorption cross section tensors used to generate the O K-edge of oxygen in the c(6 × 2) reconstruction were computed with the XSpectra package,37 using a pseudopotential with a 1/2 O1s core hole on the absorbing atom.38 Unlike the metallic surface we found that the O K-edge spectra of Cu2O could be calculated without the inclusion of a core hole. As such, the absorption cross section tensors used to generate the O K-edge of oxygen in the various Cu2O structures were computed in the absence of an O1s core hole. To account for lifetime broadening in the spectra of both the metal and the oxide, the raw spectra were convoluted with a Lorentzian with an energy dependent linewidth: Γ(E) = Γ0 + Γ(E). Γ0 was taken as the natural linewidth of oxygen, 0.14 eV.39Γ(E) was assumed to increase linearly as Γ(E) = 0.1(E − EFermi). This empirical change in linewidth has been shown to be reasonable for many systems.40 The Fermi energy of the computed spectra was set to the computed O1s binding energy to facilitate comparison with experimental results.
Results
1. Temperature ramps of Cu in O2 + C2H4
To begin the investigation of the behavior of Cu under reactive epoxidation conditions, we performed heating ramps from 50–400 °C (3.75 °C min−1) using a copper foil catalyst in a 1:1 mixture of O2 + C2H4 (Ptotal = 0.3 mbar). During the heating ramp, the chemical state of the copper surface was monitored in situ using near-ambient pressure photo-emission spectroscopy (NAP-PES). We measured, in alternation, the Cu-L3 and O-K NEXAFS spectra. Simultaneously, the production of partial oxidation products (C2H4O) was measured using an on-line PTR-MS. Note that PTR-MS is sensitive to C2H4O, but not CO2.41 Two temperature ramps were performed: one starting with a metallic copper surface and another starting with a pre-oxidized surface. The results of this investigation are shown in Fig. 1 and 2.
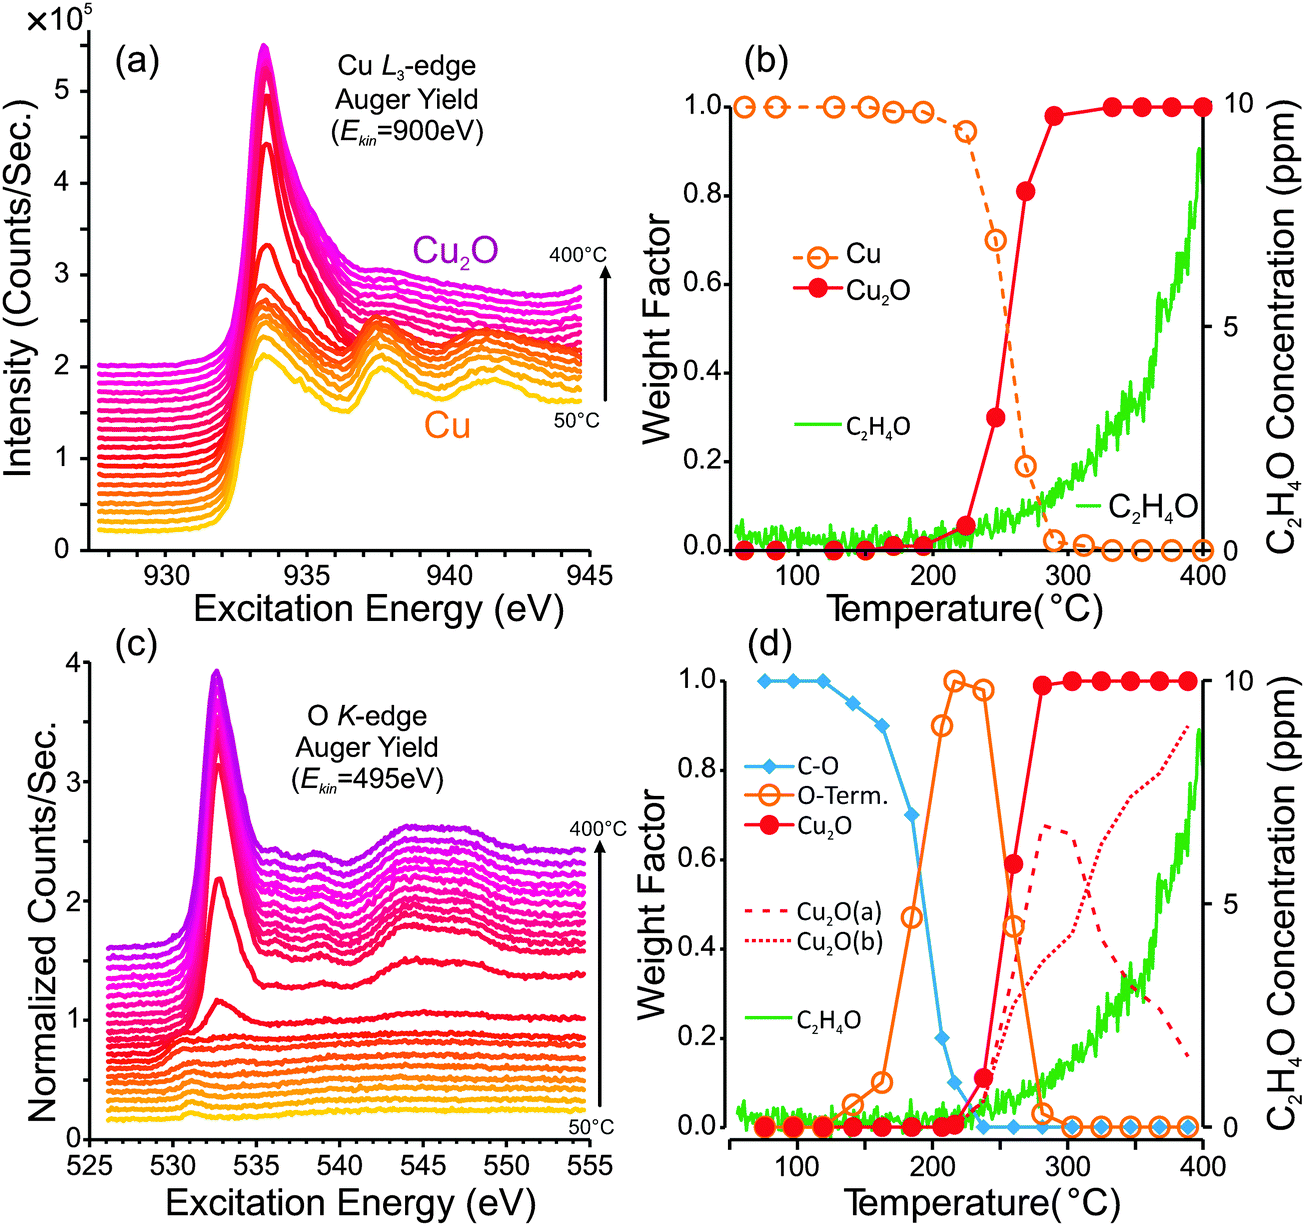 | ||
| Fig. 1
In situ photoemission measurements and partial oxidation production from a reduced copper foil during a heating ramp from 50 °C to 400 °C in 0.3 mbar of a 1:1 mixture of O2 and C2H4. (a) Cu L3-edge NEXAFS spectra, (b) spectral component analysis of the Cu L3 spectra and concentration of C2H4O in the product stream. (c) O K-edge NEXAFS spectra measured during the ramp, (d) spectral component analysis of the O K spectra and concentration of C2H4O in the product stream. The dashed lines in (d) represent two different Cu2O reference spectra: one for Cu2O at low-temperature and one for Cu2O at high temperature, as described in the discussion. | ||
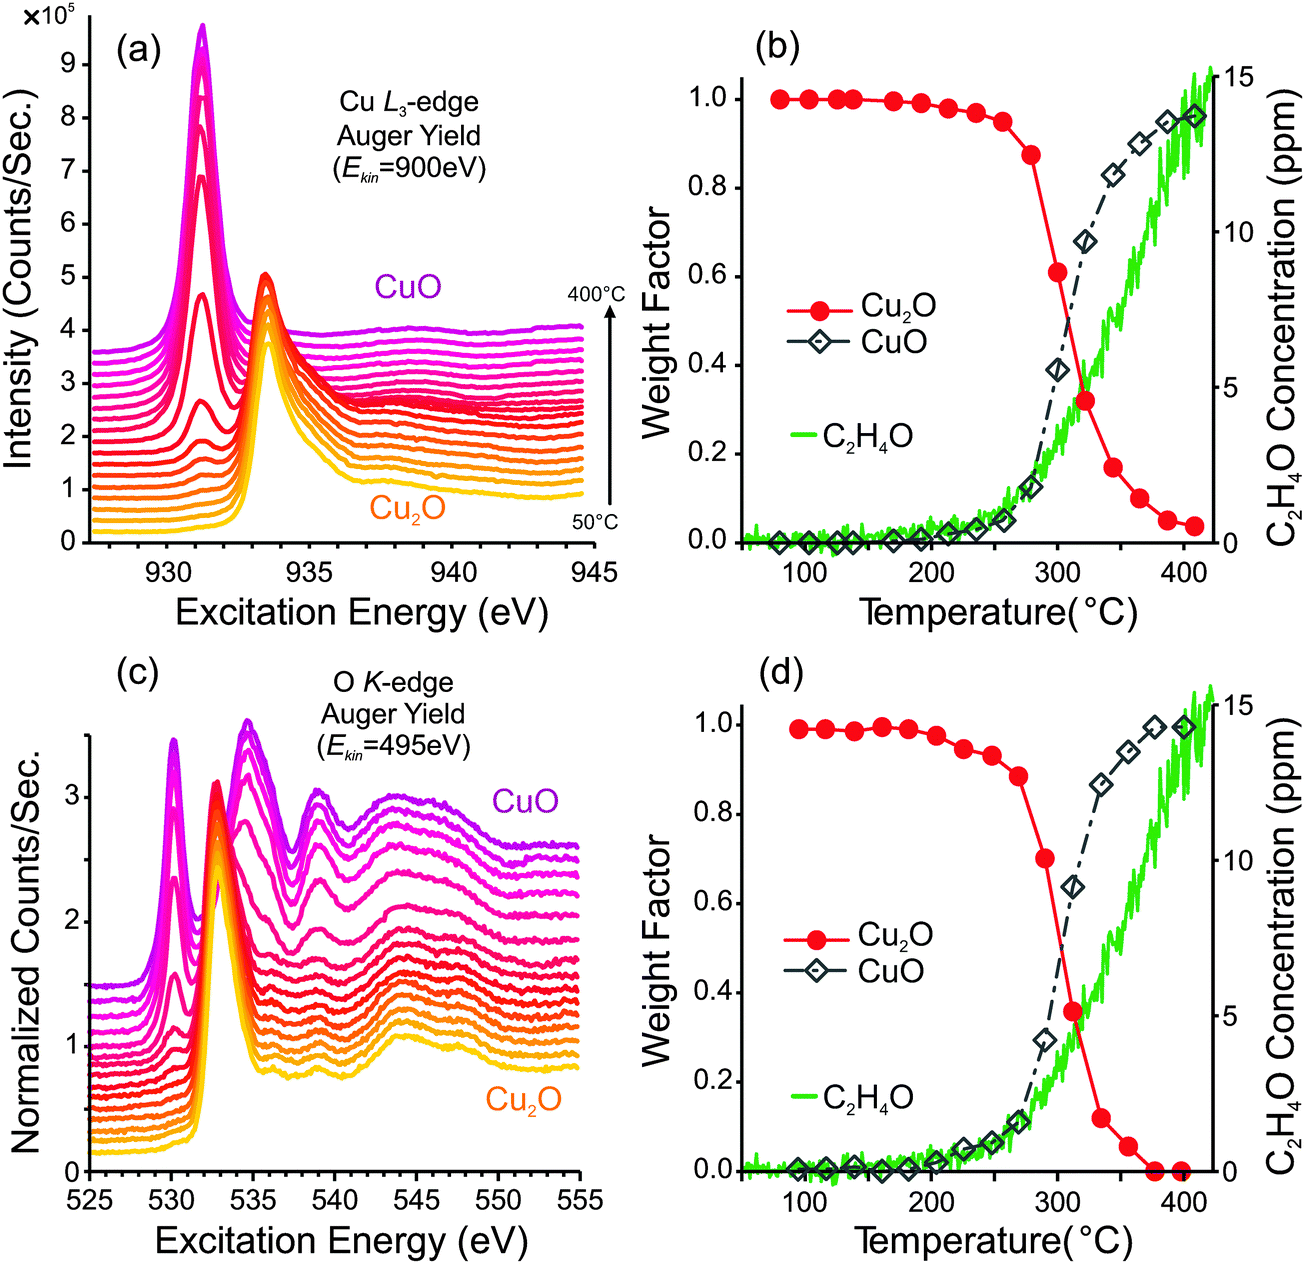 | ||
| Fig. 2
In situ photoemission measurements and partial oxidation production from a pre-oxidized copper foil during a heating ramp from 50 °C to 400 °C in 0.3 mbar of a 1:1 mixture of O2 and C2H4. (a) Cu L3-edge NEXAFS spectra, (b) spectral component analysis of the Cu L3 spectra and concentration of C2H4O in the product stream. (c) O K-edge NEXAFS spectra measured during the ramp, (d) spectral component analysis of the O K-edge spectra and concentration of C2H4O in the product stream. | ||
The foil's surface was pre-reduced to the metallic state by annealing in 0.5 mbar H2 at 550 °C until no O1s signal could be detected (using hν = 700 eV). Note that if the sample is cooled in H2 or vacuum a small O1s signal returns, due to the formation of oxygen surface termination from trace gas-phase oxygen in the chamber. However, by exchanging the H2 with C2H4 at 550 °C, followed by cooling, the sample does not become oxidized during cooling because a protective carbonaceous layer is formed on the surface in C2H4. Thus after reduction, the foil samples were cooled in C2H4 before O2 was introduced into the gas feed.
Fig. 1a and c show the Cu L3-edge and O K-edge NEXAFS spectra that were measured during the first heating ramp. From the stack of Cu L3-edge spectra in Fig. 1a, one can see that the surface begins as metallic copper, and eventually becomes oxidized to Cu2O. A plot of surface composition versus temperature is shown in Fig. 1b. The surface composition was determined by fitting the NEXAFS spectra using calibrated Cu, Cu2O and CuO reference spectra. From the plot of surface composition, one can see that the first signs of Cu2O are detectible at temperatures greater than 200 °C, and after 300 °C the metallic Cu signal is completely absent.
The O K-edge spectra reveal additional information. Due to their sensitivity to oxygen-containing surface species, the O K-edge spectra indicate how the copper surface is terminated prior to oxide formation. At low temperatures (50–180 °C) the carbonaceous layer that covers the copper surface becomes oxygenated, which is evident from the weak absorption edge at ca. 531.0 eV, consistent with an oxygenated carbonaceous species.42 Furthermore, C1s and O1s XPS spectra (Fig. S1 in ESI†) reveal the presence of species with C1s binding energies at 285.8 eV (C–O) and 287.9 eV (C![[double bond, length as m-dash]](https://www.rsc.org/images/entities/char_e001.gif) O) and O1s binding energies at 531.0 eV (CO) and 532.7 eV (C–O).43 While the C1s spectra allow us to identify the type of carbon–oxygen bonding in the surface carbon layer, they do not provide sufficient information to identify the molecular structures of these species. For instance, one might speculate the possible presence of an oxymetallacycle, carbonate species, or carbonyl on the copper surface. While any of these species could be present, further work is needed, for instance using in situ vibrational spectroscopy, to identify these species.
O) and O1s binding energies at 531.0 eV (CO) and 532.7 eV (C–O).43 While the C1s spectra allow us to identify the type of carbon–oxygen bonding in the surface carbon layer, they do not provide sufficient information to identify the molecular structures of these species. For instance, one might speculate the possible presence of an oxymetallacycle, carbonate species, or carbonyl on the copper surface. While any of these species could be present, further work is needed, for instance using in situ vibrational spectroscopy, to identify these species.
At temperatures above ca. 120 °C the carbonaceous layer begins to burn away, and a new oxygen species forms. This species has an O K absorption edge at ca. 530.0–530.5 eV and an O1s binding energy of ca. 529.6 eV (Fig. S1 and S2, ESI†). Based on these spectra, we attribute this species to the oxygen of an O-terminated Cu surface. The justification for this assignment and a more detailed examination of the O-terminated surface is presented in Section 4. As the temperature increases beyond 200 °C, the O-terminated surface is replaced by Cu2O. A plot of the spectral composition of the O K-edge spectra is shown in Fig. 1d. Overlaid onto the surface composition plots of Fig. 1b and d, we have shown the partial-oxidation product (C2H4O) concentration in the product stream, as determined using PTRMS. Here one can see that the onset of C2H4O formation appears concurrently with the formation Cu2O. Note that the product distribution was also measured using GC; however, due to the low surface area of the foil and the comparatively low sensitivity of GC, only a small signal could be detected. The GC data indicate that selectivity to epoxide was 2.7% ± 0.2% (Fig. S3, ESI†).
Note that the Cu2O signal is best fit by using two different Cu2O O K-edge reference spectra: one for low temperature (ca. 100 °C) and one for high temperature (500 °C). The surface compositions of these spectra are indicated in Fig. 1d by the dashed lines. The need for two Cu2O reference spectra in the fit is due to observed subtle differences in the O K-edge with increasing temperature. These differences are believed to be due to slight changes in the electronic structure of the oxide at high temperature, possibly due to defects. The low-temperature and high-temperature spectra are explained in more detail in the discussion section, in conjunction with Fig. 11.
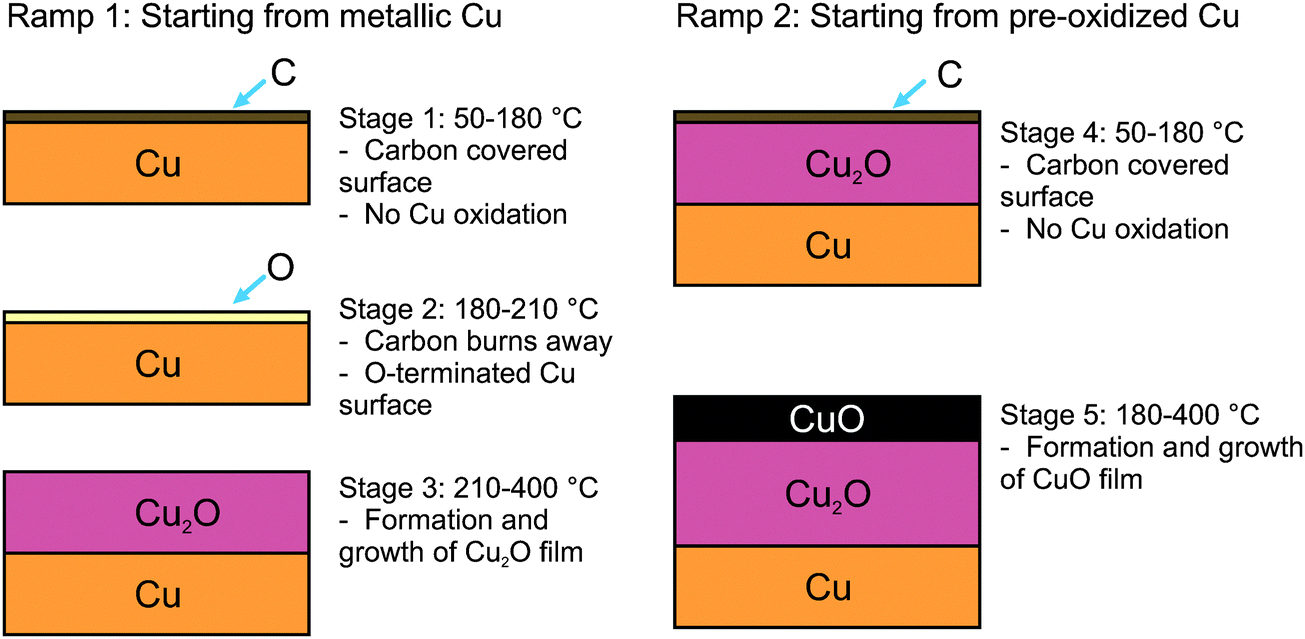 | ||
| Fig. 3 Illustration of the stages of oxidation that a copper foil experiences during temperature ramps under ethylene epoxidation conditions (based on the measurements in a 1:1 mixture of O2 and C2H4 at 0.3 mbar). | ||
After the heating ramp, the sample was cooled to room temperature and a second heating ramp was performed in order to examine how a pre-oxidized sample behaves. From the Cu L3-edge and O K-edge spectra in Fig. 2a and c, one can see that the sample surface begins as Cu2O, and eventually becomes oxidized to CuO. The spectral fitting analyses, in Fig. 2b and d, reveal that the oxidation to CuO begins at ca. 200 °C. Eventually, the entire surface is composed of CuO. The PTRMS data show that the CuO-covered sample is also capable of producing partial-oxidation products, and the GC data indicate selectivity to epoxide of ca. 2.2% ± 0.2%.
A summary of the stages of Cu oxidation during the heating ramps in epoxidation conditions is illustrated in Fig. 3. In general, at low temperatures (<150 °C) the surface is covered with carbonaceous species that become oxygenated once O2 is added to the feed. Above ca. 120 °C these carbon species burn away and the surface begins to oxidize; first with the formation of O-terminated Cu, followed by the formation of Cu2O, and then eventually with the formation of CuO.
Based on the oxygen partial pressures and temperatures used in these experiments (0.15 mbar, 50–500 °C), CuO is expected to be the thermodynamically most stable form of copper.44,45 Interestingly, the CuO does not form on the Cu2O during the first temperature ramp. In fact, the surface can remain kinetically trapped as Cu2O under epoxidation conditions (350 °C in a 1:1 mixture of O2 and C2H4) indefinitely, and only begins to form CuO during cooling (Fig. S4, ESI†). The same behavior can be observed when copper metal is heated in oxygen without ethylene (Fig. S5 and S6, ESI†). When comparing the behavior of copper under epoxidation conditions with the corrosion of copper in pure O2, it is clear that the presence of ethylene in the gas feed plays little role in preventing oxidation. The sequence of oxidation events presented in Fig. 3 is the same for copper in pure O2, except that in pure O2 the temperatures at which each phase transition occurs are lower by ca. 30 °C.
The behavior of copper in ethylene epoxidation is in stark contrast with the behavior of copper in methanol oxidation, where metal-like sub-stoichiometric copper oxides have been observed.46,47 One reason for the difference between copper's behavior in methanol oxidation and in ethylene epoxidation is that methanol is a much stronger reducing agent than ethylene. Methanol is a strong enough reducing agent to reduce Cu2O to copper metal at ca. 350 °C (in 0.5 mbar CH4OH). Ethylene will not fully reduce Cu2O to metallic copper even at 500 °C (in 0.5 mbar C2H4). Consequently, during methanol oxidation, the dynamics of copper oxide reduction by methanol and copper re-oxidation by O2 gives rise to a sub-stoichiometric oxidic surface. In the case of ethylene epoxidation, the rate of oxide reduction by ethylene is very slow compared to the re-oxidation by O2, and consequently copper corrosion takes place.
2. SEM investigation
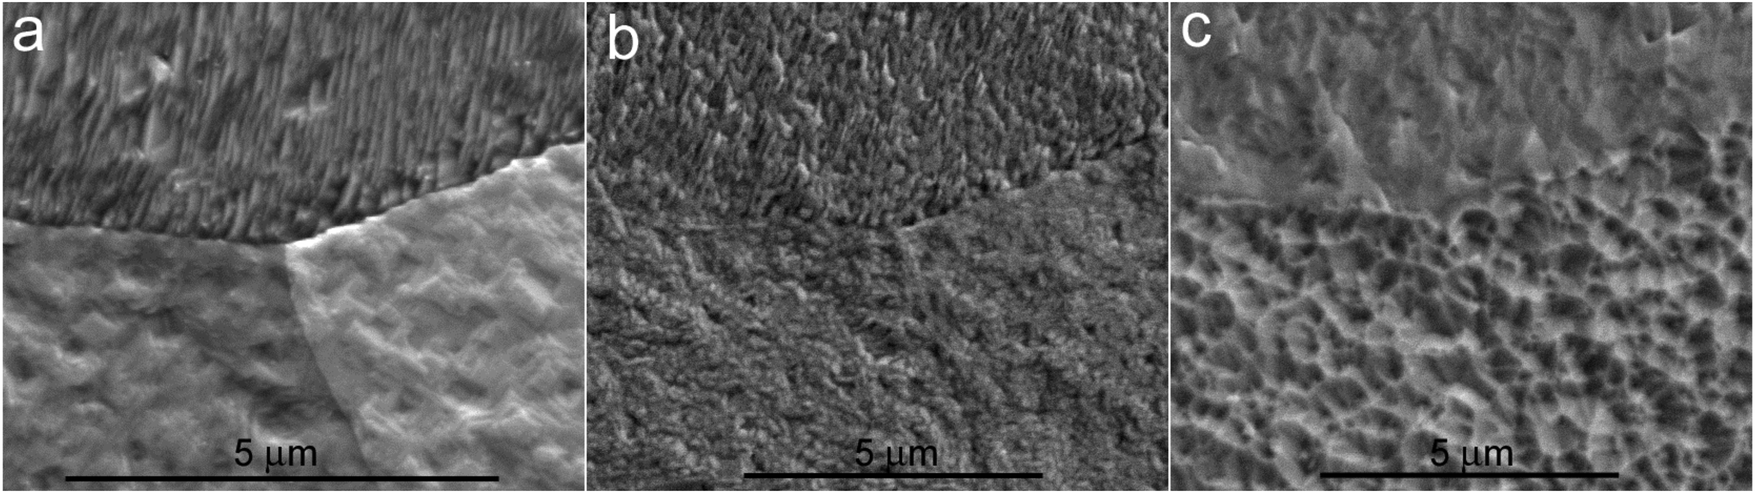
To examine the structure of the oxidized copper, a sample was investigated post-reaction with scanning electron microscopy (SEM). Fig. 4 shows a copper foil sample after 12 hours of reaction in a 1:1 mixture of O2 and C2H4 at 0.3 mbar and 350 °C. The copper surface is covered with a ca. 15 μm-thick oxide film that, at several areas, has broken away from the underlying metallic copper (as seen in Fig. 4a). The oxide scale consists of two distinct layers, seen in Fig. 4b and c. Energy-dispersive X-ray fluorescence spectroscopy (EDX) was performed on the sample to determine the composition of the layers, and reveals that the outermost layer consists of CuO and middle layer of Cu2O and the buried material of Cu, as illustrated in Fig. 4d. This type of layered structure is known to form during dry oxidation of copper.48–50
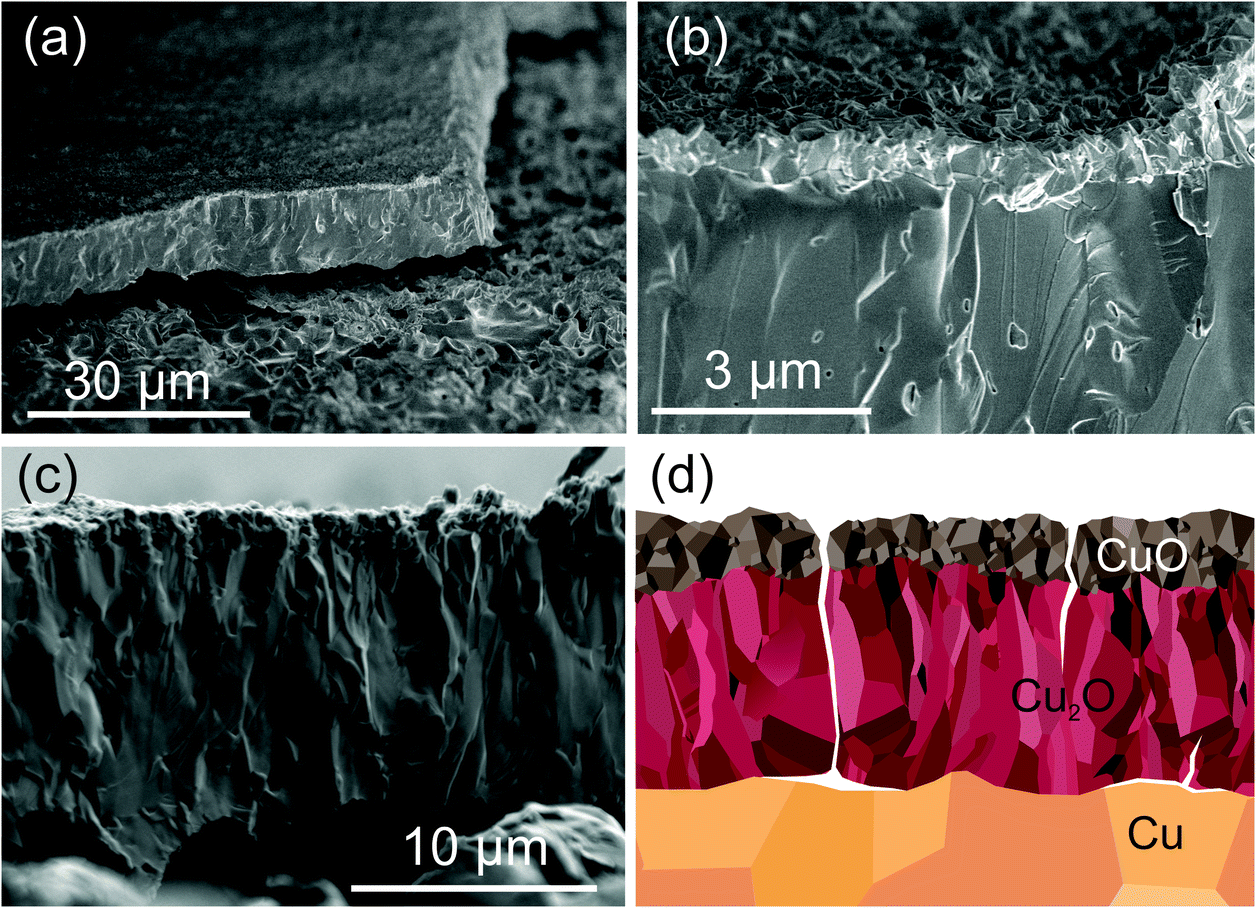 | ||
| Fig. 4 Secondary electron microscope images of the oxide film that formed on a copper foil after 12 hours of reaction in a 1:1 mixture of O2 and C2H4 at a pressure of 0.3 mbar and a temperature of 350 °C. (a) Image showing the layered structure of the film and how the film has broken off from the metal substrate. (b) An image showing a magnified view of the CuO/Cu2O interface. (c) A cross sectional view of the oxide film, showing a film thickness of ca. 15 μm. (d) An illustration of the layered oxide film, with cracks drawn in to illustrate possible pathways that gas molecules might follow reach the metal/oxide interface. | ||
The initial formation of oxide on the copper surface proceeds via nucleation and lateral growth, as seen from in situ environmental SEM (E-SEM) measurements. Fig. 5 shows a series of E-SEM images, measured at different times during the reaction of Cu in 0.3 mbar of a 1:1 mixture of O2 and C2H4 at 350 °C. Fig. 5a shows the reduced metallic surface prior to the introduction of the reaction gas feed. One can see three different grains in the image, all of which are highly faceted. Upon the introduction of the reaction feed, oxide nuclei rapidly form and uniformly cover the surface with a density of ca. 50 nuclei μm−2, as shown in Fig. 5b. Eventually, the nuclei merge together and coarsen, as shown in Fig. 5c. Post-reaction XPS analysis of this sample showed the surface to consist of Cu2O.
 | ||
| Fig. 5 Environmental SEM images of Cu foil measured under epoxidation conditions (1:1 mixture of O2 and C2H4 at a total pressure of 0.3 mbar and temperature of 350 °C). Frame (a) shows the reduced metal surface prior to the introduction of oxygen. Frame (b) shows the oxide nuclei formed on the surface after 10 minutes of reaction. Frame (c) shows the oxidized surface after 80 minutes of reaction. | ||
3. Epoxidation on pure oxides
While metallic copper is predicted to be capable of selective ethylene epoxidation,9 the oxides traditionally have been viewed as only capable of total oxidation. In our temperature-ramp experiments on copper foil, metallic copper was always present underneath the growing oxide layer. Thus we cannot exclude the possibility that metallic copper might still be exposed to the gas phase at the metal/oxide interface. For instance, given the poor adhesion of the oxide film to the underlying metal, it is possible that diffusion pathways through the oxide may exist such that gases may reach the metal/oxide interface, as illustrated in Fig. 4d. If this is the case then it is possible that, even though copper oxide is continually forming, metallic copper at the metal/oxide interface may be responsible for the epoxidation reaction.To investigate whether the copper oxides perform epoxidation we have examined pure oxide powders of Cu2O and CuO, under epoxidation conditions. Fig. 6 shows GC measurements and in situ NEXAFS measurements from pressed Cu2O and CuO powders, heated to 350 °C in 1:1 mixtures of O2 and C2H4 at a total pressure of 0.3 mbar. The GC data shows that Cu2O exhibits activity for epoxidation, but with only 0.9% selectivity to epoxide and 98.0% selectivity to CO2. Interestingly, 1.1% (±0.2%) ethyl aldehyde was also detected. The detection of acetaldehyde is consistent with recent DFT predictions that found ethylene epoxide on Cu2O(100) can easily isomerize to acetaldehyde.26 On silver catalysts acetaldehyde is believed to be very rapidly oxidized to CO2 before it can desorb from the catalyst surface.51,52 Thus, acetaldehyde is not detected in the product stream from silver catalysts (see Fig. S7 in ESI† for GC data on silver in identical conditions). It should be noted that the combustion pathway for ethylene on copper and copper oxides is not as well known as for ethylene combustion on silver. On silver catalysts, it is generally accepted that the total oxidation pathway occurs via the formation of acetaldehyde, and that once acetaldehyde is formed it very rapidly proceeds to complete combustion.52–56 The rate of combustion of acetaldehyde on copper oxides appears to be significantly slower than on silver. This is apparent because acetaldehyde can be detected in the product stream from Cu2O, which implies that at least some portion of the acetaldehyde that is initially formed can desorb from the copper oxide surface before proceeds towards total combustion. However, if we assume a similar reaction pathway on copper oxides as on silver, then most of the CO2 that was produced by the copper oxides would have originated from acetaldehyde combustion.
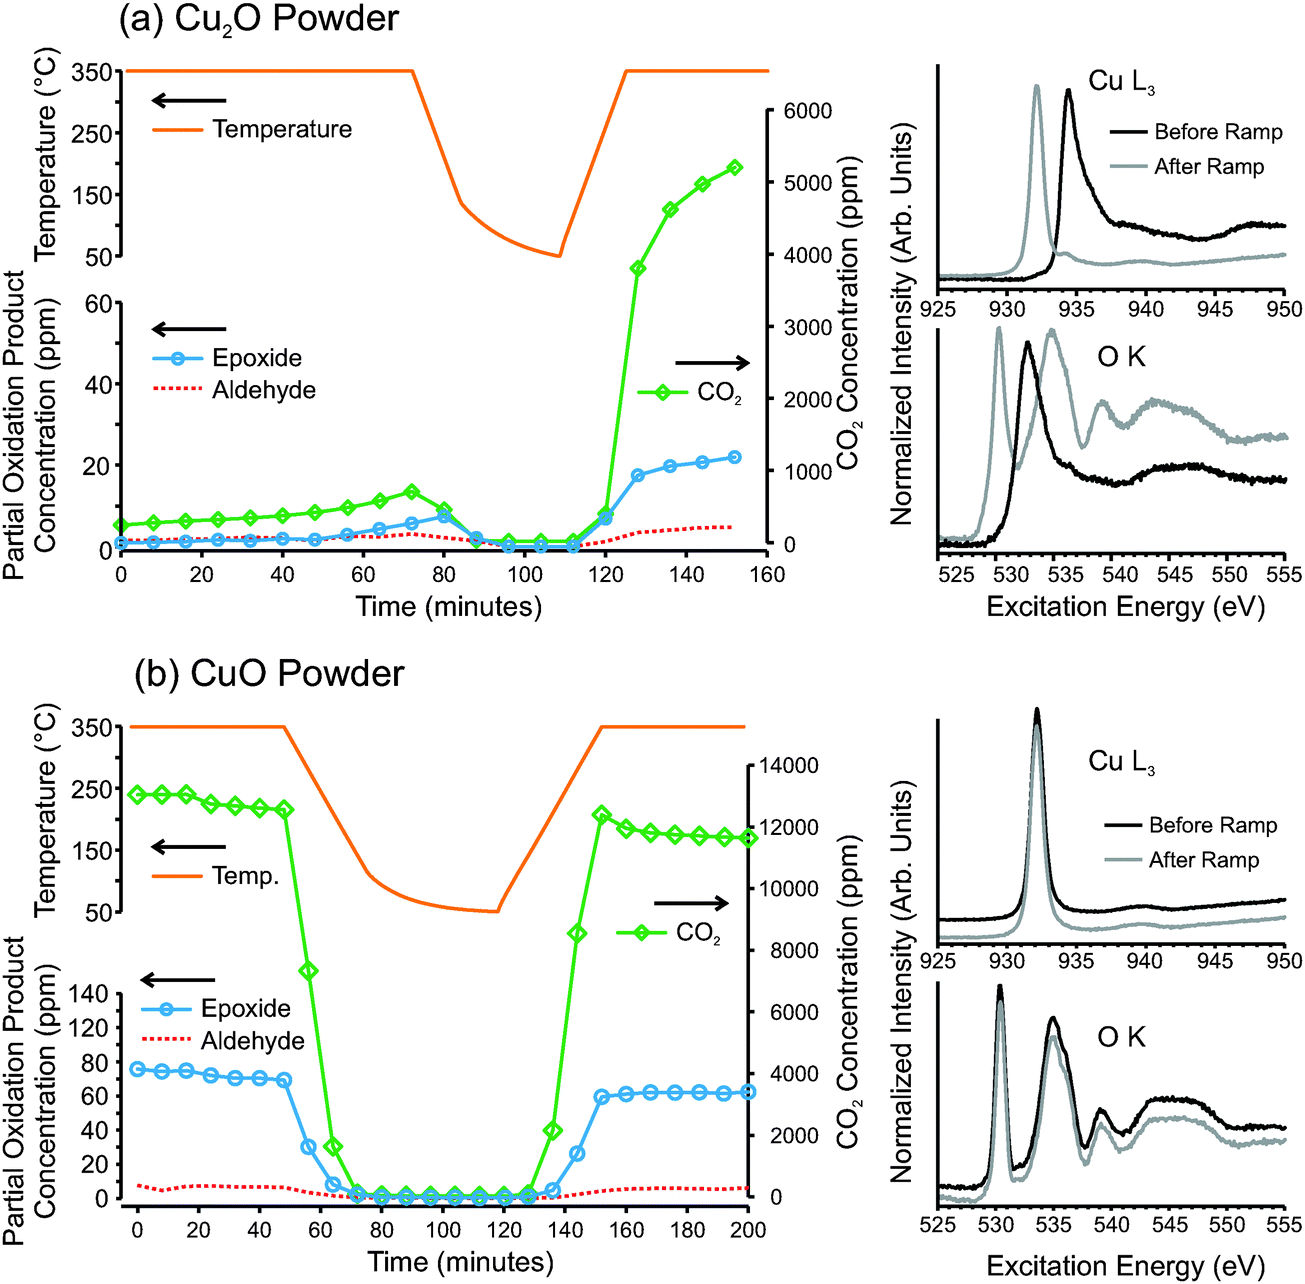 | ||
| Fig. 6 (left) Gas chromatography product analysis and (right) in situ measured NEXAFS spectra of (a) Cu2O and (b) CuO powders heated in a 1:1 mixture of O2 and C2H4 at 0.3 mbar. | ||
Given the high oxo-philic nature of copper and the weak reducing power of ethylene, even Cu2O is not thermodynamically stable in epoxidation conditions. With time on stream, the Cu2O powder begins to oxidize to CuO. The transformation to CuO is slow, but is stimulated by cooling and re-heating, as seen in Fig. 6a. Upon re-heating, the oxide's activity increases by a factor of 10. Furthermore, the product distribution changes such that, after CuO is formed, the product stream consists of 0.9% epoxide, 0.2% (±0.05%) aldehyde and 98.9% CO2. Investigation of the in situ NEXAFS spectra reveals that before the ramp, the sample surface was entirely Cu2O, and after the ramp it was 90% CuO.
The GC results of pure CuO powder reveal similar catalytic behavior for pure CuO as the CuO formed by oxidation of Cu2O (Fig. 6b). The product stream consisted of 1.2% epoxide, 0.1% (±0.05%) aldehyde and 98.8% CO2. Unlike Cu2O, CuO cannot be further oxidized, and the cooling and heating ramps do not significantly change the activity or product distribution of CuO. As can be seen from the NEXAFS spectra, the oxide also does not change its chemical state.
Note that the measured partial-oxidation selectivities were found to depend on sample morphology, with oxidized foils exhibiting higher selectivities than pressed oxide powders. For instance, on oxidized copper foils, a surface composed of Cu2O was found to produce 2.6% ethylene oxide and 2.4% acetaldehyde, while the same foil after oxidation to CuO produced 1.9% ethylene epoxide and 0.9% (±0.1%) acetaldehyde (Fig. S4, ESI†). The observed selectivities of pressed copper oxide powders and oxidized copper foils at steady state are tabulated in Table 1.
:1 feed of ethylene and oxygen at 0.3 mbar (measured with gas chromatography)
| Ethyl oxide (%) | Acetaldehyde (%) | CO2 (%) | |
|---|---|---|---|
| Cu2O on foil | 2.6 ± 0.2 | 2.4 ± 0.2 | 95.0 ± 0.4 |
| Cu2O powder | 0.9 ± 0.2 | 1.1 ± 0.2 | 98.0 ± 0.4 |
| CuO on foil | 1.9 ± 0.1 | 0.9 ± 0.1 | 97.2 ± 0.4 |
| CuO powder | 1.1 ± 0.05 | 0.1 ± 0.05 | 98.8 ± 0.1 |
Thus, although the partial-oxidation selectivities found here are considerably lower than those recently reported by Jayamurthy et al.,18 it should be recognized that this may be due to differences in sample morphology; however, we cannot rule out the possibility that support interactions in Jayamuthy's study might enhance selectivity, or perhaps that the selectivities are lower in our experiments due to the ‘pressure gap’. For instance, non-promoted silver catalysts exhibit epoxide selectivities at atmospheric pressure conditions of ca. 50%,57 while epoxide selectivity in NAP-XPS conditions was found to be ca. 10%.58
Regardless of these differences, we can confirm that the oxides exhibit partial oxidation activity, and in general, Cu2O exhibited higher epoxide selectivity than CuO, and also produced a higher proportion of acetaldehyde than CuO. If we assume that all the CO2 formed had to pass through an acetaldehyde intermediate (as it does on silver catalysts in the total combustion pathway) then it would seem that the different selectivities between Cu2O and CuO could stem from a difference in rates of aldehyde combustion for the two oxides, but also possibly a difference in rates acetaldehyde and isomerisation to/from epoxide and subsequent desorption of the epoxide. A detailed computational investigation of these reaction pathways could be carried out as future work.
4. Dilute O2
After investigating the oxidation of copper during ethylene epoxidation and finding that both copper oxides can perform epoxidation to some degree, we sought to determine whether metallic copper could be maintained under near-ambient pressure conditions and whether the high selectivity seen for copper under UHV conditions could be achieved. To do so, we carried out reactions under a gas feed of extremely dilute O2, ranging in composition from 1:2500 to 64:2500 (O2:C2H4), equivalent to oxygen partial pressures ranging from 1.2 × 10⁻⁴ mbar to 7.7 × 10⁻³ mbar. Under these conditions, a unique non-oxide oxygen species is observed. The spectral features of this species—i.e. the O1s, O K-edge and valence band spectra—resemble O-terminated copper surfaces (e.g. Cu(110)-[2 × 1]O, Cu(110)-c[6 × 2]O, Cu(111)-‘29’O), as shown in Fig. 7b.
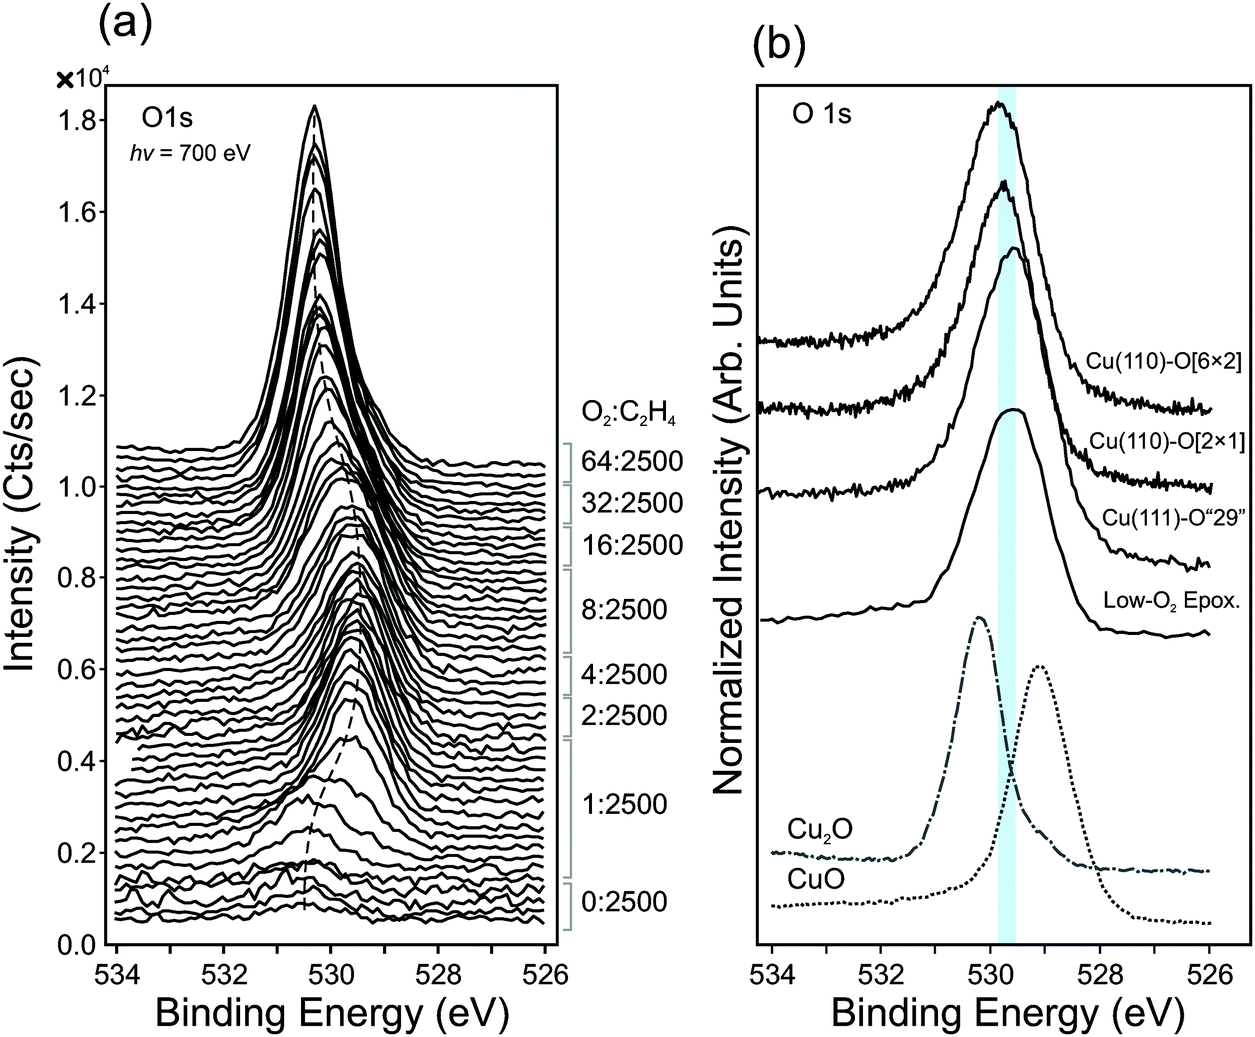 | ||
| Fig. 7 (a) O1s spectra of Cu foil, measured at 0.3 mbar in various gas mixtures ranging from 1:2500 to 64:2500 (oxygen-to-ethylene ratios). The dashed line shows the change in binding energy with increasing oxygen concentration in the gas feed. (b) Reference O1s spectra of several O-terminated Cu single crystals (measured in UHV using a laboratory photon source, hν = 1486.6 eV) and reference spectra of Cu2O and CuO (measured UHV using synchrotron radiation, hν = 700 eV). The shaded area represents the range of binding energies observed for O-terminated Cu surfaces. | ||
Fig. 7a shows the O1s spectra measured in dilute-O2 conditions (T = 350 °C, Ptotal = 0.3 mbar). One can see that the reduced metallic surface (bottom most spectrum in the spectrum stack) contains a small oxygen signal. No impurities were detectible even when using a photon energy that is highly sensitive for the common contaminants, such as Si, P, S, and Cl.59 The observed oxygen species has an O1s binding energy of ca. 530.3 eV, which is consistent with previous reports of sub-surface oxygen in copper.60 Upon the addition of O2 into the gas feed, this peak initially grows in intensity with time (Fig. S8, ESI†).
After about 4 minutes under these conditions, a new oxygen species begins to form at lower binding energy (529.6 eV). The O1s binding energy of this species is not consistent with CuO (O1s at 529.1 eV) or Cu2O (O1s at 530.2 eV), as shown in Fig. 7b. The Cu2p spectra and Cu LMM spectra also show no evidence of CuO or Cu2O (Fig. S9, ESI†).
The oxygen species at 529.6 eV is consistent with what is found for O-reconstructed Cu single crystals. The O1s spectra of Cu(110)-[2 × 1]O, Cu(110)-c[6 × 2]O, Cu(111)-‘29’O surfaces was measured in UHV (LEED images in Fig. S10, ESI†) are shown in Fig. 7b for comparison. Their binding energies fall within the range of 529.5 to 529.8 eV.
The species at 529.6 eV remains on the surface while the O2-to-C2H4 ratio is increased from 1:2500 to 8:2500. At reaction feeds more oxygen-rich than 8:2500, Cu2O begins to form. The Cu2O signal continues to increase until, in a reactant mixture of 64:2500, Cu2O completely covers the catalyst surface. From the valence band spectra (hν = 150 eV) and Cu LMM Auger spectra (Fig. S9, ESI†), no metallic copper signal can be seen, indicating a Cu2O film thicker than 8 nm (IMFP in Cu2O of 900 eV electrons is ca. 1.7 nm, and probing depth is ca. 4 × IMFP).
To support our assignment of the oxygen species at 529.6 eV, we also examine the valence band spectra measured in dilute-O2 epoxidation conditions. The valence band spectrum of metallic Cu is compared with that of Cu measured in 1:2500 O2:C2H4 (Ptotal = 0.3 mbar, T = 350 °C), in Fig. 8a. Here one can see that in dilute-O2 conditions, new valence states arise on the high- and low-binding energy sides of the Cu3d band.
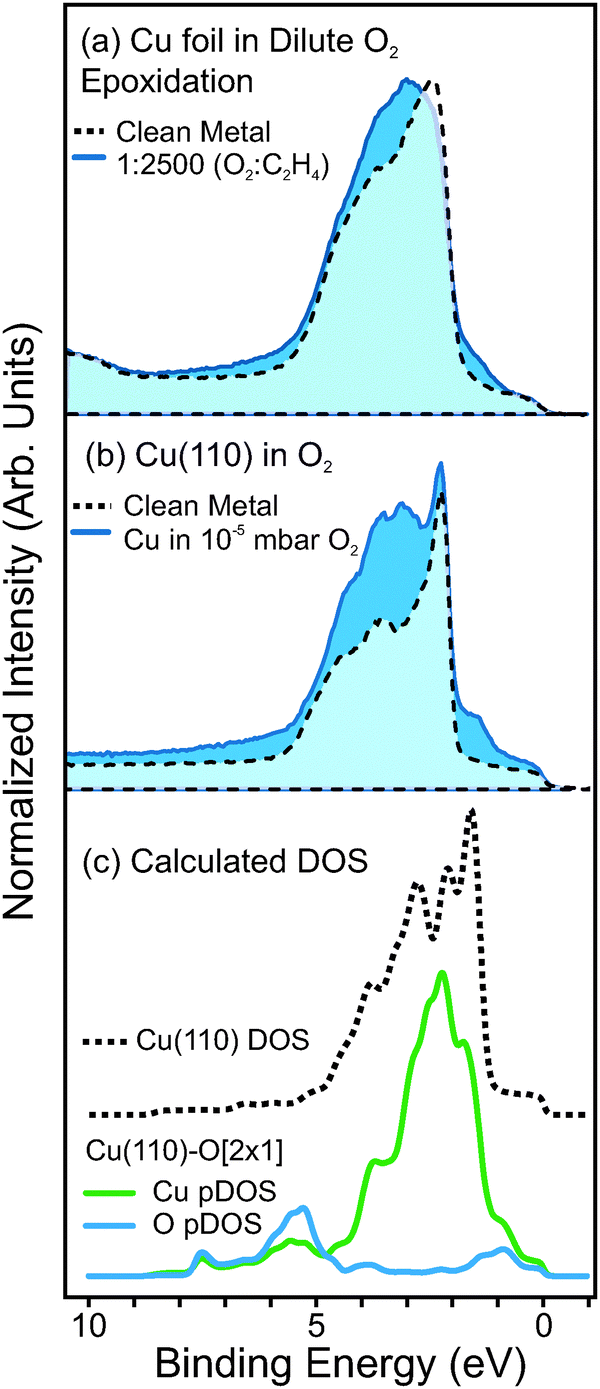 | ||
| Fig. 8 (a) Valence band spectra of polycrystalline Cu foil, (dashed line) measured in vacuum after reduction in H2, (solid line) measured in a 1:2500 mixture of O2:C2H4 at 350 °C. Photon energy was 150 eV. (b) Valence band spectra of single crystal Cu(110), (dashed line) measured in vacuum after reduction in H2, (solid line) measured in a 1 × 10⁻⁵ mbar of O2:C2H4 at 350 °C. (c) Density of occupied states (DOS) calculated using DFT for metallic Cu(110) (dashed line) and Cu-partial DOS (green line) and O-partial DOS (blue line) of the Cu(110)-O[2 × 1] surface. The DOS was calculated using a 6-layer slab of Cu atoms and periodic boundary conditions. The DOS from the buried atomic layers were attenuated by the electron escape depth (IMFP of 4.6 Å) so that the calculated occupied DOS are comparable with the measured photoemission spectrum. Note, also that the calculated DOS was multiplied by a Fermi–Dirac function. | ||
We find that the same valence features arise for O-terminated Cu single crystals. Valence spectra of metallic Cu(110) and oxygen-terminated Cu(110), as shown in Fig. 8b. Density functional theory calculations of the Cu(100)-O[2 × 1] also show similar features, and reveal that such valence states arise from hybridization between O p-states and Cu d-states, as seen in the partial density of states (pDOS) plots in Fig. 8c.
Note that in the pDOS plots of Fig. 8c the contribution to the intensity of each atomic layer of the calculated O–Cu slab was attenuated according to Beer's law, using an inelastic mean-free path (IMFP) of 4.6 Å, which is the calculated IMFP of photoelectrons with 150 eV kinetic energy.61 This was done so that the pDOS plots could be easily comparable with the measured photoemission spectra. Furthermore, the pDOS plots were multiplied by a Fermi–Dirac function, such that the pDOS represents only occupied states.
The O K-edge and Cu L3-edge NEXAFS spectra of copper in dilute-O2 epoxidation conditions were measured and compared with reference spectra of the copper oxides and O-terminated copper single crystals. These spectra are shown in Fig. 9. The bottom four spectra are of a metallic copper surface during exposure to increasing O2 concentrations in the gas feed (Ptotal = 0.3 mbar, T = 350 °C). In the O K-edge spectra, one can see that in the most dilute oxygen conditions (1:1100) there is an absorption feature at ca. 530.3 eV, and another absorption feature at ca. 533.0 eV. These features appear at similar energies to the white lines of CuO (530.3 eV) and Cu2O (532.6 eV), respectively. However, examination of the corresponding Cu L3-edge spectra reveals that the surface contains no trace of CuO or Cu2O, and appears to consist only of metallic copper. Comparison of the NEXAFS spectra with O-terminated Cu single crystals reveals that similar features are observed for the O-terminated Cu surfaces, and is consistent with the interpretation of the O1s and valence band spectra.
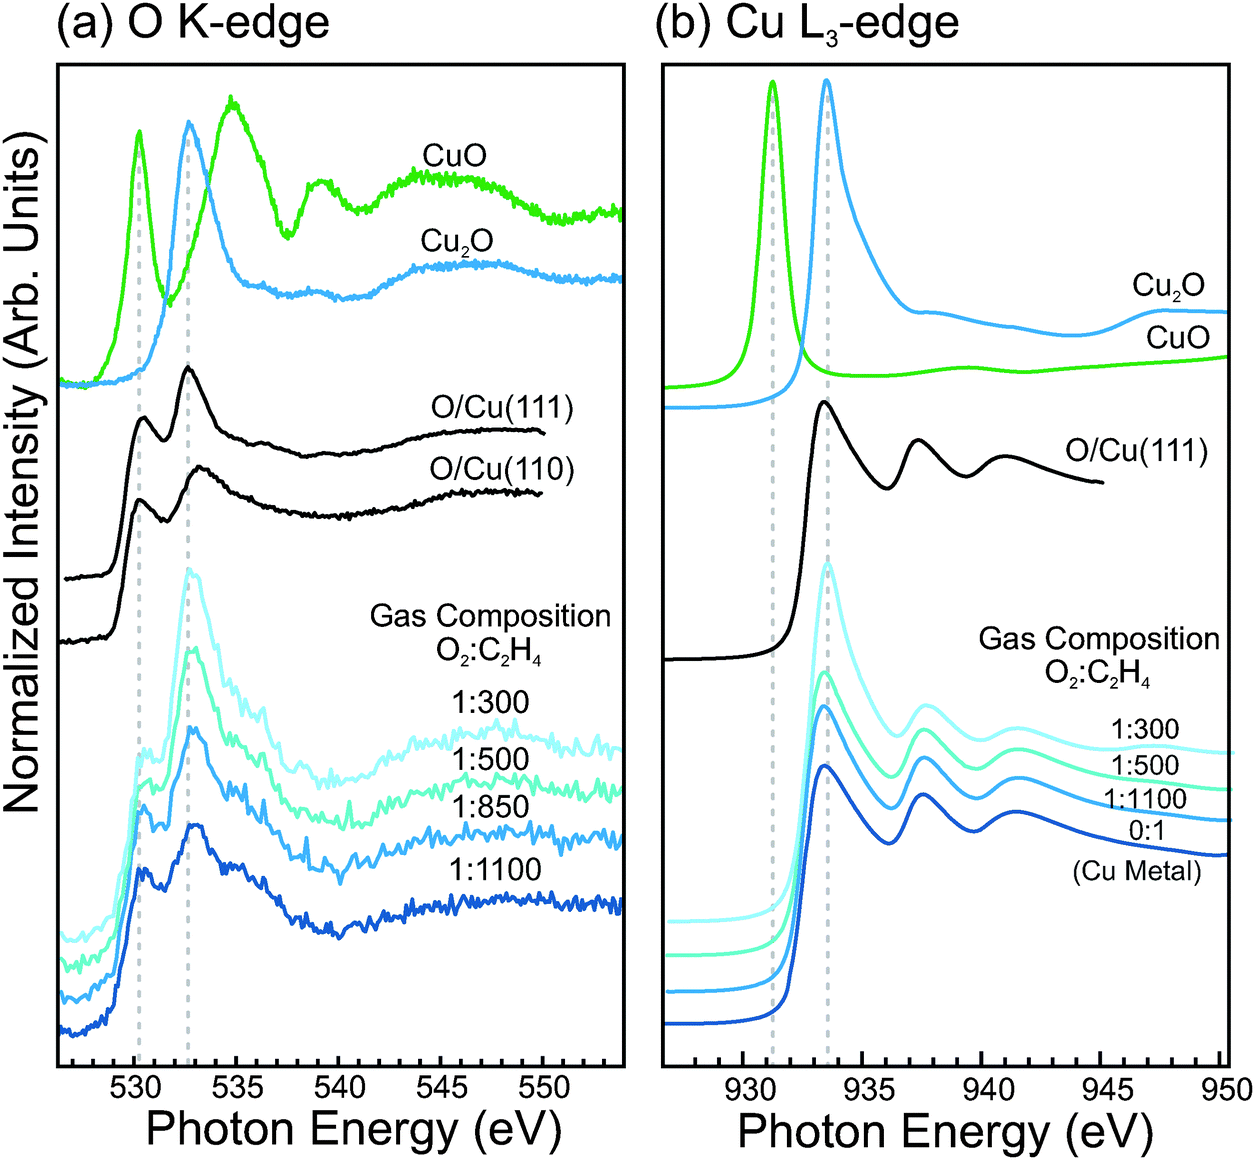 | ||
| Fig. 9 (a) O K-edge NEXAFS spectra. (b) Cu L3-edge NEXAFS spectra. In (a) and (b) the bottom four spectra are of Cu foil under epoxidation conditions (P = 0.3 mbar, T = 350 °C) in a dilute oxygen feed, and the top two spectra are reference spectra for Cu2O and CuO. (c) O K-edge NEXAFS spectra of O-terminated Cu single crystals, measured in 10−4 mbar O2 at 350 °C. For comparison, the O K-edge of Cu foil in epoxidation conditions and a DFT-calculated spectrum of an O-terminated surface are shown. | ||
With increasing O2 concentration in the gas feed, the O K and Cu L3 spectra begin to show Cu2O contributions. The fact that both Cu2O features and O-terminated Cu features are observed simultaneously likely indicates a non-uniform surface, where Cu2O nuclei have formed and grown to partially cover the surface. Such behavior is known to occur during the initial stages of oxide formation on metallic copper.62,63
While our photoemission analysis indicates that, even when very dilute oxygen feeds are used for ethylene epoxidation, copper becomes covered by an atomic layer of oxygen, one wonders whether such a surface can exhibit the high activity of the metallic surface. Measuring activity under such a dilute oxygen feed is difficult due to the extremely low conversion. To increase conversion we used high-purity copper foam with a surface area that is roughly 50 times greater than a copper foil. Using such a sample, we were able to detect C2H4O using PTRMS and CO2 using EI-QMS; however, the oxygen concentration had to be increased to 1:800 before anything could be detected.
The results of this investigation are shown in Fig. 10. The C2H4O and CO2 concentrations in the product stream—with the Cu foam heated at 350 °C in 0.3 mbar of 1:800 O2:C2H4—are shown in Fig. 10a and b, respectively. The Cu L3-edge and O K-edge spectra, measured during the reaction, are shown in Fig. 10c.
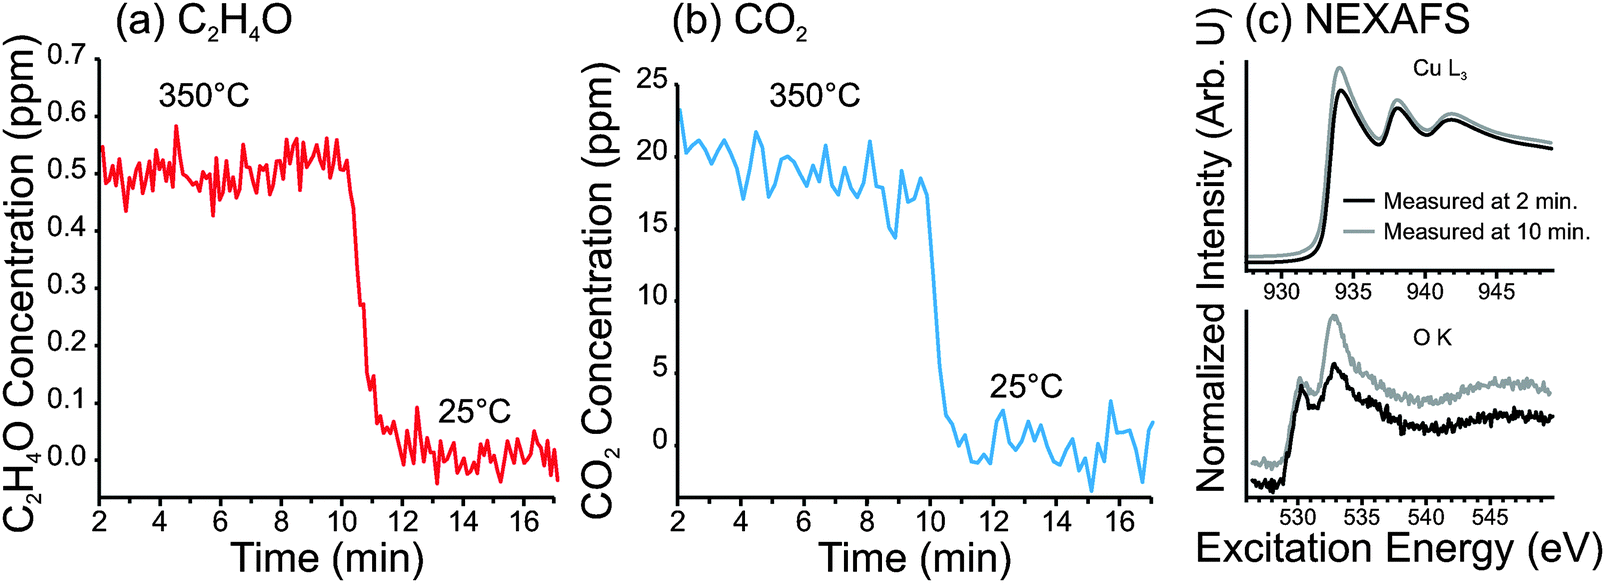 | ||
| Fig. 10 Data from a copper foam heated at 350 °C in a gas feed with an oxygen-to-ethylene ratio of 1:800 and total pressure 0.3 mbar. (a) Concentration of partial oxidation products in the product stream, having molecular formula C2H4O, measured using PTRMS. (b) Concentration of CO2 in the product stream, measured using EI-QMS. (c) NEXAFS spectra of the surface of the Cu foam, measured in situ at the start of the reaction (in grey), and just prior to cool-down (black). Top spectra are of the total-electron yield spectra of Cu L3-edge and bottom spectra are Auger-electron yield spectra (Ekin = 493 eV) of the O K-edge. | ||
From these measurements we have found that the O-terminated Cu surface exhibited selectivity to partial oxidation products of ca. 4%. However, it should be noted that PTR-MS cannot distinguish ethylene epoxide from acetaldehyde. From the Cu2O powder samples shown earlier, it was found by GC that about 50% of the partial oxidation product was acetaldehyde at 350 °C. If we assume the same product distribution from the O-terminated copper surface, then we obtain an epoxidation selectivity of only 2%. It should also be noted that, under these conditions, the copper surface eventually began to show signs of Cu2O formation, as seen in the O K-edge spectra. Therefore, one cannot be certain that the observed activity originates completely from the O-terminated Cu surface (i.e. some of the activity could be the result of Cu2O).
The reactivity data indicates that the O-terminated surface exhibits catalytic properties comparable to the bulk oxides, and does not exhibit the high selectivity predicted for metallic copper. Thus we surmise that, even under the most dilute oxygen conditions achieved here, the copper surface becomes completely saturated with oxygen.
Discussion
The number of research articles addressing copper's behavior in epoxidation is relatively few compared to silver. Thus we find it instructive to start the discussion with some comparisons between copper and silver. Copper is a very oxo-philic material compared to silver. Under typical epoxidation conditions, silver oxides are not thermodynamically stable; however, the silver surface is covered by various adsorbed oxygen species.58,64 Conversely, copper oxides are stable under epoxidation conditions – in particular, CuO – and consequently copper corrodes under such conditions, as we have seen in the present study. Thus, even though metallic copper can perform high selectivity epoxidation,65 under realistic operating conditions, oxygen covers the metal surface much faster than it can be removed by epoxidation of ethylene. Strategies could potentially be employed to stabilize copper in a low oxidation state, as was recently demonstrated using a mixed metal oxide TiCuOx.66The reaction mechanism for epoxide formation on silver is still a matter of debate. There are several excellent reviews on the topic that elaborate on all the proposed mechanisms and the experimental findings that have led to these hypotheses.1,53,67–69 Here we will limit ourselves to a very brief overview of the topic. Early experimental results demonstrated evidence that a common intermediate may be involved in both the total- and partial-oxidation pathways.70 Further experimental and theoretical evidence suggests such an intermediate could be an oxametallocycle.1,51,71,72 Within the oxametallacycle model, DFT studies have demonstrated that the selectivity towards partial oxidation is governed by the strength of the metal–oxygen bond relative to the metal–carbon bond in the oxametallacycle.
An alternative mechanism has also been proposed in which epoxidation occurs via direct addition of surface oxygen to ethylene's CC bond, while total oxidation occurs via hydrogen abstraction.73,74 This affirms that surface atomic oxygen that is relatively electron deficient (termed electrophilic oxygen) performs epoxidation, while surface atomic oxygen that is relatively electron rich (termed nucleophilic oxygen) performs hydrogen abstraction.
There is experimental evidence that shows several surface oxygen species are present on the silver surface under reaction conditions.41,58,64 These species presumably differ from one another in terms of their valence electron densities. Interestingly the relative populations of the various species is correlated with epoxide selectivity, suggesting that multiple surface species influence the reaction mechanism in an intricate way.58,64 In general, one would expect the valence electron density of adsorbed oxygen to have a strong influence on selectivity, regardless of whether the epoxidation mechanism follows a common-intermediate route or a direct epoxidation route. The valence electron density of surface oxygen species could be affected by such factors as oxygen surface coverage, the presence of sub-surface oxygen75 and the presence of electron donating or withdrawing impurities.58
Model UHV studies and DFT calculations suggest that metallic copper that is pre-adsorbed with a very small amount of atomic oxygen follows the ‘common intermediate’ mechanism.6,8,9,65 Due to the strong Cu–O bond relative to the Cu–C bond, the route from the oxametallacycle to ethylene epoxide is predicted to have a significantly lower barrier than the route to acetaldehyde, giving rise to a high epoxide selectivity on metallic copper.10
Traditionally, copper oxides were not considered to be capable of ethylene epoxidation because lattice O2− was considered to be too nucleophilic to perform epoxidation, due to the strong Cu–O bond; however, recent theoretical studies have predicted epoxidation to be feasible on Cu2O.26,67 In particular it was found that when ethylene is adsorbed to a Cu2O(001) surface that contains an oxygen vacancy, an oxametallacycle can be formed with a relatively small activation energy; however, the barrier for forming the acetaldehyde from the oxametallacycle was significantly lower than the barrier for ethylene epoxidation, suggesting that aldehyde production is preferred over epoxide production.
Interestingly, these studies also indicated that on an oxygen-saturated Cu2O surface – in which no metal site is available to form the oxametallacycle – direct epoxidation may occur; however, the epoxide would rapidly isomerise to acetaldehyde, due to the strong Cu–O bond.26 If isomerization is favored by the strong Cu–O bond, then isomerization might be avoided when a weaker Cu–O bond is involved in the mechanism. One could imagine weak Cu–O bonds would be present when the surface contains excess oxygen. We speculate that oxygen-rich defects, such as copper vacancies, may be involved in the epoxidation observed in the present study. Under the conditions used here – namely, temperatures of 200–500 °C and at oxygen partial pressures 0.15 mbar – one would expect the Cu2O surface to be oxygen-rich.
The types of defect present in Cu2O, as well as their thermodynamic and electronic properties, are more thoroughly characterized in the literature than those of CuO. It is well established that the most dominant defect in Cu2O is the copper vacancy.76,77 In CuO, copper vacancies have also been proposed to be the main point defect, although they are likely present in very low concentrations.48 Due to the scarcity and uncertainty of present knowledge on CuO, we will mainly focus the following discussion on Cu2O.
The concentrations of various defects in oxides depend strongly on oxygen pressure and temperature. Defects in an oxide can give rise to deviations from stoichiometry. Truly “stoichiometric” cuprous oxide (i.e. Cu2−yO, where y = 0) exists only for a very limited range of conditions.76 Any deviation in temperature or oxygen chemical potential from such conditions gives rise to point defects, such as oxygen and copper vacancies.
The experimental determination of Cu2O non-stoichiometry has shown that y in Cu2−yO can range from ca. −0.00003 to 0.00005 at 600 °C, depending on the oxygen partial pressure.76 The copper vacancy is generally accepted to be the most thermodynamically stable point defect in Cu2O.78 However, at elevated temperatures a considerable number of oxygen vacancies can also be present (especially in oxygen-lean conditions).76 Under the conditions used in the present study, we expect copper vacancies to be the dominant defect, given the high oxygen chemical potential of the gas phase. In fact CuO is the thermodynamically most stable copper oxide under these conditions,79 but it is not immediately formed in our experiments due to kinetic constraints. At the maximum temperatures reached in the present experiments (500 °C) one could expect defect concentrations on the order of 1017–1018 cm−3.76 Unfortunately, such small concentrations of defects are not generally detectible by photoemission spectroscopy, so we can only claim that they are present based on previous literature.76
In addition to bulk defects, surfaces also give rise to under-coordinated oxygen species. Previous DFT calculations by Stampfl and coworkers23 have shown that, under oxygen-rich conditions (similar to those used in the present study), the thermodynamically stable surfaces of Cu2O are: (1) a defective Cu2O(111) surface that contains Cu vacancies by removal of coordinatively unsaturated copper surface atoms; and (2) a Cu2O(110) surface that is terminated such that the top-most atomic layer has a CuO stoichiometry. Both of these surfaces are oxygen rich relative to stoichiometric Cu2O, and thus contain oxygen coordination environments that differ significantly from stoichiometric Cu2O surfaces.
We expect that at high temperature, under the given oxygen partial pressure, the surface oxygen atoms will have lower coordination than at lower temperature, and consequently will be a more active catalyst. Although the aim of the present study is not to elucidate the mechanism of epoxidation on these oxides, we do see some evidence that can provide clues of the structural features that give rise to epoxidation. For instance, from the O K-edge NEXAFS spectra, it is clear that when the oxides are active in epoxidation they do not have their perfect ‘stoichiometric’ structures. We expand on this point in the following discussion.
As mentioned in Section 1, two different O K-edge reference spectra were used to fit the Cu2O component of the measured spectra in Fig. 1c: one spectrum for Cu2O at high temperature and one for Cu2O at low temperature. Two different spectra were necessary because we observed subtle differences in O K-edge peak shape for Cu2O measured at low and high temperatures. The spectra used for reference spectra to fit the data in Fig. 1 are shown in Fig. 11a. These spectra were measured in a 1:10 ratio of O2:C2H4, such that Cu2O remains stable (i.e. does not oxidized to CuO). One can see in Fig. 11a that, at high temperature, the absorption edge (labeled A) shifts to lower excitation energy by 0.3 eV and broadens. Furthermore, the intensities of the feature labeled A, B, C and D in Fig. 11a decrease relative to the continuum intensity (i.e. the intensity at 550 eV excitation energy).
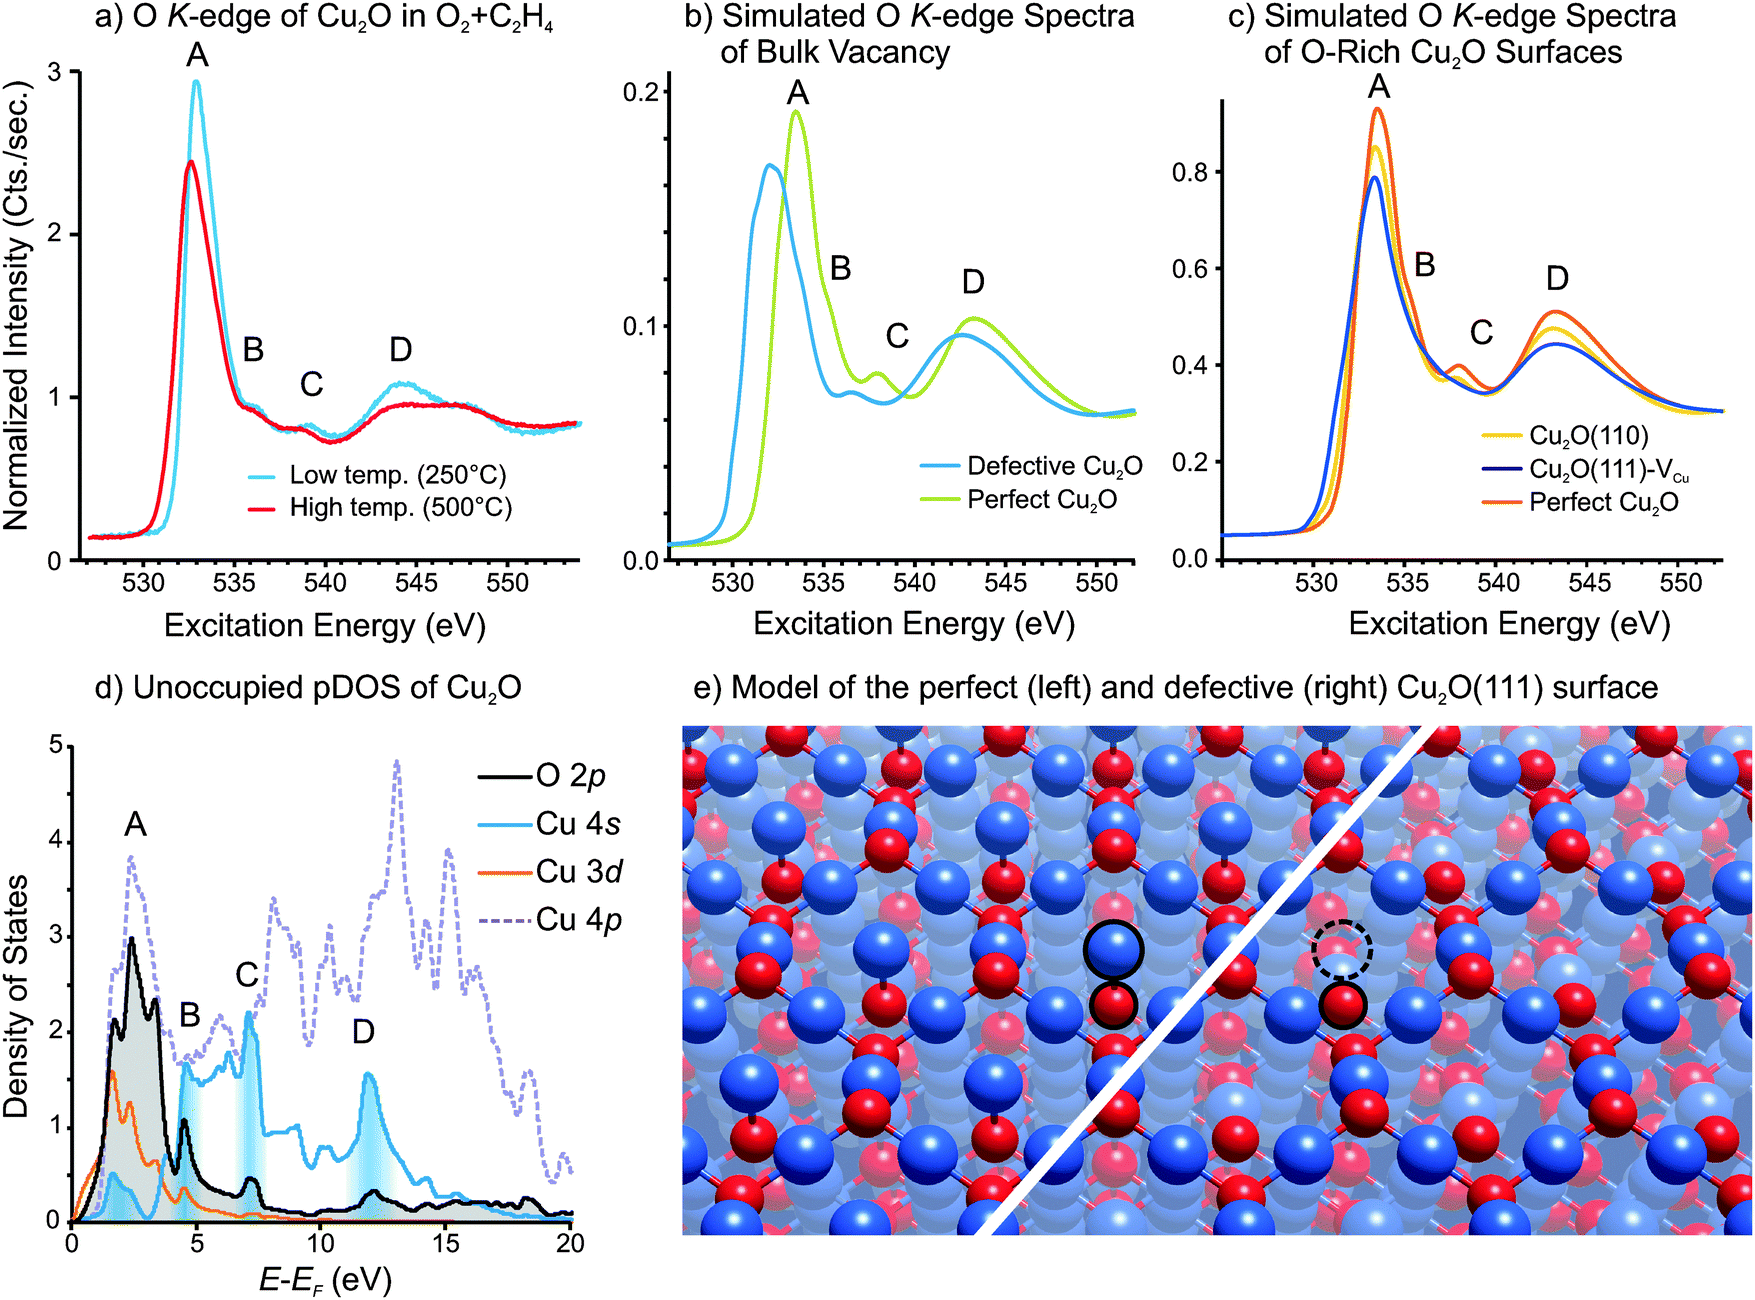 | ||
| Fig. 11 (a) O K-edge spectra of Cu2O measured at ‘low’ temperature (250 °C) and at ‘high’ temperature (500 °C) in a 1:10 mixture of O2 and C2H4 at 0.3 mbar total pressure. (b) Simulated O K-edge spectra of perfect Cu2O and defective Cu2O that contains a neutral Cu2O vacancy. (c) Simulated O K-edge spectra of perfect Cu2O, a Cu2O(111) surface containing copper vacancies, and a Cu2O(110) surface. (d) Calculated unoccupied partial density-of-states for perfect Cu2O. (e) Model of the perfect Cu2O(111) surface (left) and defective Cu2O(111) surface containing copper vacancies (right). | ||
An O K-edge spectrum reflects the local unoccupied p-states on oxygen, so the spectral feature can be assigned by examining the unoccupied partial density-of-states (pDOS). A plot of the unoccupied pDOS of Cu2O is shown in Fig. 11d. One can see that the main feature (labeled A) is primarily due to transition into O2p states that are hybridized with Cu3d, Cu4s and Cu4p states, while the remaining features (B, C and D) are due to transitions into O2p states that are primarily hybridized with Cu4s states. The regions of the Cu4s DOS where there is significant hybridization with O2p states, and which give rise to the features in the O K-edge spectrum are highlighted with shading in Fig. 11d.
In order to investigate how oxygen under-coordination affects the O K-edge spectrum we have performed DFT calculations to simulate the O K-edge spectra of three Cu2O structures: namely, the two surfaces predicted by Stampfl and coworkers to be present in oxygen-rich conditions,23 as well as an oxide containing a neutral vacancy (i.e. two copper vacancies and one oxygen vacancy in a 2 × 2 × 2 Cu2O supercell). The simulated spectrum of Cu2O containing a neutral bulk vacancy, as well as that of perfect Cu2O, is shown in Fig. 11b, while the simulated spectra of the O-rich Cu2O surfaces are shown in Fig. 11c. Note that the calculated spectrum of the bulk defective Cu2O is the sum of the O K-spectra for all oxygen species whose spectra are affected by the presence of the under-coordinated oxygen. The spectra of the defective Cu2O(111) and Cu2O(110) surfaces use the sum of the first five oxygen layers.
Note that all three structures contain under-coordinated oxygen atoms. For instance, Fig. 11e shows the perfect Cu2O(111) surface and the defective Cu2O(111) that contains surface copper vacancies. One can see in Fig. 11d that the copper atoms that were coordinatively unsaturated on the perfect surface (highlighted in Fig. 11d) have been removed to form the defective surface. The result is under-coordinated oxygen atoms in the defective surface. The structures of the other two structures that were calculated can be found in the ESI.†
In the simulated O K-edge spectra, one can see that in all three cases feature A shifts towards lower excitation energy relative to perfect Cu2O. The shift is due to a decrease in the electron density of the coordinatively unsaturated oxygen atoms relative to the oxygen atoms of the perfect lattice. In addition to the shift, the heights of all features that contain a Cu4s component (i.e. A, B, C and D) decrease relative to the continuum intensity (at 550 eV). This observation implies that the density of unoccupied Cu4s states decreases in the presence of under-coordinated oxygen, suggesting that electron density is transferring into the Cu4s states.
This observation can be understood as follows. Under-coordinated oxygen has less electron density than fully coordinated oxygen. One could formally write O−1 for the under-coordinated oxygen ions to signify that they have lost some of their electron density. This charge is given to the neighboring copper ions, and consequently occupies the lowest-lying unoccupied orbital of copper, namely the Cu4s. As a result, the density of unoccupied Cu4s states decreases, giving rise to a decrease in features A, B, C and D in the O K-edge spectra. This kind of ‘reverse oxidation’ (i.e. oxygen donating charge to a metal) is often argued to give rise to a pre-edge peak in the O K-edge spectra.80–83 Such a change in oxygen electron density would give rise to an oxygen species that is chemically electrophilic.
Given that the differences between the experimentally measured O K-edge spectra at low and high temperatures are consistent with the changes predicted by DFT calculations for structures that have under-coordinated oxygen atoms, we consider under-coordinated oxygen to be a plausible origin of the observed spectral changes at high temperature. However, as both bulk vacancies and surface defects give rise to similar changes in the O K-edge spectra, we would not be able to distinguish the various structures by the experimental spectra. Interestingly, as seen in Fig. 1d, the appearance of the high-temperature O K-edge spectrum for Cu2O correlates well with the epoxide production, which may indicate that under-coordinated oxygen plays a role in the epoxidation mechanism.
Similar to Cu2O, the O K-edge of CuO also exhibits subtle changes with increasing temperature (see Fig. S10 in ESI†); however, the spectral changes are even more subtle than for Cu2O. When CuO is heated in an atmosphere of O2 and C2H4 the main absorption feature shifts slightly to lower excitation energy and the feature is broadened, as seen in Fig. 11b. Furthermore, the intensities of the absorption features decrease slightly. Again, we interpret these changes as possibly indicative of a defective structure at elevated temperature. We have not made an attempt at calculating O K-edge spectra for defective CuO structures as this highly correlated material would require an entirely different computational strategy for which PBE calculation, as used in this study, are not suitable. Furthermore, the defect structures of CuO are not well understood, and warrant an in-depth theoretical and experimental investigation in their own right.
It has been said that the necessary and sufficient conditions for epoxidation on copper is to have a copper site for adsorption and a surface oxygen with the appropriate valence charge density.12 If such a condition is met then copper can be very selective for epoxidation.10 However, copper's strong oxo-philicity results in heavy corrosion under epoxidation conditions. As seen in the present work, maintaining the copper surface in a metallic state under oxygen partial pressures used for epoxidation conditions seems to be not feasible. Co-feeding a reducing agent, such as H2 may be able to achieve this; however, this would not be a particularly economical strategy. Furthermore, based on our NAP-XPS experiments, the O-terminated copper surface is stable even in H2 (at P = 0.5 mbar) even up to 500 °C. Thus, in order to attain the metallic surface, one would need to operate the catalyst at very high temperatures, which would change the product distribution towards the total oxidation product.
However, as we have observed epoxidation activity for both CuO and Cu2O-presumably both defective structures – it is possible that under-coordinated surface oxygen provides the necessary oxygen valence-charge density for epoxidation to occur. Further theoretical and mechanistic studies would be necessary to support this hypothesis, but if true, it may be possible to improve the selectivity of copper oxides by tuning the surface defects, using promoters that can stabilize under-coordinated oxygen atoms at the surface.
Conclusions
In the present work, we have characterized the corrosion of copper during ethylene epoxidation. We find that copper goes through several stages of oxidation, beginning with O-termination, followed by the formation and growth of Cu2O, and eventually CuO. Copper corrosion proceeds indefinitely, with several-micron-thick oxide layers forming after hours of epoxidation.Investigation of epoxidation from Cu2O and CuO powders revealed that both oxides exhibited some activity for partial oxidation, with Cu2O exhibiting slightly higher partial oxidation selectivity than CuO. Furthermore, Cu2O was found to produce roughly equal amounts of acetaldehyde as epoxide, while CuO produced roughly ten-times more epoxide than aldehyde.
Examination of copper foils in dilute-O2 epoxidation conditions (1 part O2 in 2500 parts C2H4) revealed the rapid formation of an O-terminated surface. Metallic copper could not be achieved during epoxidation. Reactivity tests of copper foams in dilute-O2 epoxidation conditions (1 part O2 in 800 parts C2H4) showed the O-terminated surface to have partial-oxidation selectivity similar to Cu2O.
By comparing measured and calculated O K-edge spectra of Cu2O, we find that with coordinatively unsaturated oxygen species may be the origin of the spectral features observed on the active catalyst.
Acknowledgements
Financial support for this work has been provided by the Alexander von Humboldt Stiftung and the Max-Planck Gesellschaft. We are indebted to Michael Hävecker, Raoul Blume, Gisela Weinberg for their technical support.Notes and references
- C. Stegelmann, N. C. Schiødt, C. T. Campbell and P. Stoltze, J. Catal., 2004, 221, 630 CrossRef CAS PubMed.
- A. Peschel, F. Karst, H. Freund and K. Sundmacher, Chem. Eng. Sci., 2011, 66, 6453 CrossRef CAS PubMed.
- B. K. Hodnett, in Catalysis: An Integrated Approach, ed. B. A. Averill, J. A. Moulijn, R. A. van Santen and P. W. N. M. van Leeuwen, Elsevier Science & Technology Books, Amsterdam, The Netherlands, 2nd edn, 1999, p. 262 Search PubMed.
- J. C. Dellamorte, J. Lauterbach and M. A. Barteau, Catal. Today, 2007, 120, 182 CrossRef CAS PubMed.
- K. C. Waugh and M. Hague, Catal. Today, 2010, 157, 44 CrossRef CAS PubMed.
- R. L. Cropley, F. J. Williams, O. P. H. Vaughan, A. J. Urquhart, M. S. Tikhov and R. M. Lambert, Surf. Sci., 2005, 578, L85 CrossRef CAS PubMed.
- J. J. Cowell, A. K. Santra, R. Lindsay, R. M. Lambert, A. Baraldi and A. Goldoni, Surf. Sci., 1999, 437, 1 CrossRef CAS.
- A. Santra, J. Cowell and R. Lambert, Catal. Lett., 2000, 67, 87 CrossRef CAS.
- D. Torres, N. Lopez, F. Illas and R. M. Lambert, J. Am. Chem. Soc., 2005, 127, 10774 CrossRef CAS PubMed.
- A. Kokalj, P. Gava, S. de Gironcoli and S. Baroni, J. Catal., 2008, 254, 304 CrossRef CAS PubMed.
- J. R. Monnier and G. W. Hartley, J. Catal., 2001, 203, 253 CrossRef CAS.
- R. M. Lambert, F. J. Williams, R. L. Cropley and A. Palermo, J. Mol. Catal. A: Chem., 2005, 228, 27 CrossRef CAS PubMed.
- O. P. H. Vaughan, G. Kyriakou, N. Macleod, M. Tikhov and R. M. Lambert, J. Catal., 2005, 236, 401 CrossRef CAS PubMed.
- J. Lu, M. Luo, H. Lei, X. Bao and C. Li, J. Catal., 2002, 211, 552 CrossRef CAS.
- R. L. Cropley, F. J. Williams, A. J. Urquhart, O. P. H. Vaughan, M. S. Tikhov and R. M. Lambert, J. Am. Chem. Soc., 2005, 127, 6069 CrossRef CAS PubMed.
- J. B. Reitz and E. I. Solomon, J. Am. Chem. Soc., 1998, 120, 11467 CrossRef CAS.
- W. Zhu, Q. Zhang and Y. Wang, J. Phys. Chem. C, 2008, 112, 7731 CAS.
- M. Jayamurthy, P. Hayden and A. K. Bhattacharya, J. Catal., 2014, 309, 309 CrossRef CAS PubMed.
- J. He, Q. Zhai, Q. Zhang, W. Deng and Y. Wang, J. Catal., 2013, 299, 53 CrossRef CAS PubMed.
- J. T. Jankowiak and M. A. Barteau, J. Catal., 2005, 236, 366 CrossRef CAS PubMed.
- S. Linic, J. Jankowiak and M. A. Barteau, J. Catal., 2004, 224, 489 CrossRef CAS PubMed.
- S. Piccinin, S. Zafeiratos, C. Stampfl, T. W. Hansen, M. Havecker, D. Teschner, V. I. Bukhtiyarov, F. Girgsdies, A. Knop-Gericke, R. Schlogl and M. Scheffler, Phys. Rev. Lett., 2010, 104, 035503 CrossRef.
- A. Soon, M. Todorova, B. Delley and C. Stampfl, Phys. Rev. B: Condens. Matter Mater. Phys., 2007, 75, 125420 CrossRef.
- A. Soon, M. Todorova, B. Delley and C. Stampfl, Phys. Rev. B: Condens. Matter Mater. Phys., 2006, 73, 165424 CrossRef.
- A. Soon, M. Todorova, B. Delley and C. Stampfl, Surf. Sci., 2007, 601, 5809 CrossRef CAS PubMed.
- M. O. Ozbek, I. Onal and R. A. van Santen, J. Catal., 2011, 284, 230 CrossRef CAS PubMed.
- A. Knop-Gericke, E. Kleimenov, M. Havecker, R. Blume, D. Teschner, S. Zafeiratos, R. Schlogl, V. I. Bukhtiyarov, V. V. Kaichev, I. P. Prosvirin, A. I. Nizovskii, H. Bluhm, A. Barinov, P. Dudin and M. Kiskinova, in Adv. Catal., ed. B. C. Gates and H. Knozinger, 2009, vol. 52, p. 213 Search PubMed.
- B. H. Frazer, B. Gilbert, B. R. Sonderegger and G. De Stasio, Surf. Sci., 2003, 537, 161 CrossRef CAS.
- J. P. Perdew, K. Burke and M. Ernzerhof, Phys. Rev. Lett., 1996, 77, 3865 CrossRef CAS.
- G. Paolo, B. Stefano, B. Nicola, C. Matteo, C. Roberto, C. Carlo, C. Davide, L. C. Guido, C. Matteo, D. Ismaila, C. Andrea Dal, G. Stefano de, F. Stefano, F. Guido, G. Ralph, G. Uwe, G. Christos, K. Anton, L. Michele, M.-S. Layla, M. Nicola, M. Francesco, M. Riccardo, P. Stefano, P. Alfredo, P. Lorenzo, S. Carlo, S. Sandro, S. Gabriele, P. S. Ari, S. Alexander, U. Paolo and M. W. Renata, J. Phys.: Condens. Matter, 2009, 21, 395502 CrossRef PubMed.
- H. J. Monkhorst and J. D. Pack, Phys. Rev. B: Solid State, 1976, 13, 5188 CrossRef.
- N. Marzari, D. Vanderbilt, A. De Vita and M. C. Payne, Phys. Rev. Lett., 1999, 82, 3296 CrossRef CAS.
- M. E. Straumanis and L. S. Yu, Acta Crystallogr., Sect. A: Cryst. Phys., Diffr., Theor. Gen. Crystallogr., 1969, 25, 676 CrossRef CAS.
- P. Haas, F. Tran and P. Blaha, Phys. Rev. B: Condens. Matter Mater. Phys., 2009, 79, 085104 CrossRef.
- X. Duan, O. Warschkow, A. Soon, B. Delley and C. Stampfl, Phys. Rev. B: Condens. Matter Mater. Phys., 2010, 81, 075430 CrossRef.
- E. Pehlke and M. Scheffler, Phys. Rev. Lett., 1993, 71, 2338 CrossRef CAS.
- C. Gougoussis, M. Calandra, A. P. Seitsonen and F. Mauri, Phys. Rev. B: Condens. Matter Mater. Phys., 2009, 80, 075102 CrossRef.
- M. Taillefumier, D. Cabaret, A.-M. Flank and F. Mauri, Phys. Rev. B: Condens. Matter Mater. Phys., 2002, 66, 195107 CrossRef.
- A. Menzel, S. Benzaid, M. O. Krause, C. D. Caldwell, U. Hergenhahn and M. Bissen, Phys. Rev. A: At., Mol., Opt. Phys., 1996, 54, R991 CrossRef CAS.
- P. J. W. Weijs, M. T. Czyżyk, J. F. van Acker, W. Speier, J. B. Goedkoop, H. van Leuken, H. J. M. Hendrix, R. A. de Groot, G. van der Laan, K. H. J. Buschow, G. Wiech and J. C. Fuggle, Phys. Rev. B: Condens. Matter Mater. Phys., 1990, 41, 11899 CrossRef CAS.
- V. I. Bukhtiyarov, A. I. Nizovskii, H. Bluhm, M. Havecker, E. Kleimenov, A. Knop-Gericke and R. Schlogl, J. Catal., 2006, 238, 260 CrossRef CAS PubMed.
- S. G. Urquhart and H. Ade, J. Phys. Chem. B, 2002, 106, 8531 CrossRef CAS.
- E. Cano, C. L. Torres and J. M. Bastidas, Mater. Corros., 2001, 52, 667 CrossRef CAS.
- B. Hallstedt, D. Risold and L. J. Gauckler, J. Phase Equilib., 1994, 15, 483 CrossRef CAS.
- L. Schramm, G. Behr, W. Löser and K. Wetzig, J. Phase Equilib. Diffus., 2005, 26, 605 CrossRef CAS.
- T. Schedel-Niedrig, M. Havecker, A. Knop-Gericke and R. Schlogl, Phys. Chem. Chem. Phys., 2000, 2, 3473 RSC.
- A. Knop-Gericke, M. Hävecker, T. Schedel-Niedrig and R. Schlögl, Top. Catal., 2000, 10, 187 CrossRef CAS.
- Z. Grzesik and M. Migdalska, High Temperature Materials and Processes, 2011, vol. 30, p. 277 Search PubMed.
- K. Mimura, J.-W. Lim, M. Isshiki, Y. Zhu and Q. Jiang, Metall. Mater. Trans. A, 2006, 37, 1231 CrossRef.
- W. K. Appleby and R. F. Tylecote, Corros. Sci., 1970, 10, 325 CrossRef CAS.
- S. Linic and M. A. Barteau, J. Am. Chem. Soc., 2003, 125, 4034 CrossRef CAS PubMed.
- E. M. Cordi and J. L. Falconer, Appl. Catal., A, 1997, 151, 179 CrossRef CAS.
- S. Linic and M. A. Barteau, Handbook of Heterogeneous Catalysis, Wiley-VCH Verlag GmbH & Co. KGaA, 2008 Search PubMed.
- G. H. Twigg, Proc. R. Soc. London, Ser. A, 1946, 188, 92 CrossRef CAS.
- A. C. Lukaski and M. Barteau, Catal. Lett., 2009, 128, 9 CrossRef CAS.
- R. E. Kenson and M. Lapkin, J. Phys. Chem., 1970, 74, 1493 CrossRef CAS.
- C. T. Campbell, J. Catal., 1985, 94, 436 CrossRef CAS.
- T. C. R. Rocha, M. Havecker, A. Knop-Gericke and R. Schlogl, J. Catal., 2014, 312, 12 CrossRef CAS PubMed.
- Note that using synchrotron radiation with an excitation energy of 355 eV, photoemission spectra are very sensitive to common contaminants. Cl, S, P and Si can be detected in concentrations greater than 0.12, 0.15, 0.12 and 0.19 atomic percent, respectively.
- H. Bluhm, M. Havecker, A. Knop-Gericke, E. Kleimenov, R. Schlogl, D. Teschner, V. I. Bukhtiyarov, D. F. Ogletree and M. Salmeron, J. Phys. Chem. B, 2004, 108, 14340 CrossRef CAS.
- S. Tanuma, C. J. Powell and D. R. Penn, Surf. Interface Anal., 1994, 21, 165 CrossRef CAS PubMed.
- K. Lahtonen, M. Hirsimäki, M. Lampimäki and M. Valden, J. Chem. Phys., 2008, 129, 124703 CrossRef CAS PubMed.
- M. Lampimäki, K. Lahtonen, M. Hirsimäki and M. Valden, J. Chem. Phys., 2007, 126, 034703 CrossRef PubMed.
- T. C. R. Rocha, A. Oestereich, D. V. Demidov, M. Havecker, S. Zafeiratos, G. Weinberg, V. I. Bukhtiyarov, A. Knop-Gericke and R. Schlogl, Phys. Chem. Chem. Phys., 2012, 14, 4554 RSC.
- J. J. Cowell, A. K. Santra and R. M. Lambert, J. Am. Chem. Soc., 2000, 122, 2381 CrossRef CAS.
- X. Yang, S. Kattel, K. Xiong, K. Mudiyanselage, S. Rykov, S. D. Senanayake, J. A. Rodriguez, P. Liu, D. J. Stacchiola and J. G. Chen, Angew. Chem., Int. Ed., 2015 DOI:10.1002/anie.201504538.
- M. O. Özbek and R. A. van Santen, Catal. Lett., 2013, 143, 131 CrossRef.
- R. A. Van Santen and H. P. C. E. Kuipers, Adv. Catal., 1987, 35, 265 CAS.
- W. M. H. Sachtler, C. Backx and R. A. Van Santen, Catal. Rev., 1981, 23, 127 CAS.
- N. W. Cant and W. K. Hall, J. Catal., 1978, 52, 81 CrossRef CAS.
- S. Linic and M. A. Barteau, J. Am. Chem. Soc., 2002, 124, 310 CrossRef CAS PubMed.
- M.-L. Bocquet, A. Michaelides, D. Loffreda, P. Sautet, A. Alavi and D. A. King, J. Am. Chem. Soc., 2003, 125, 5620 CrossRef CAS PubMed.
- R. B. Grant and R. M. Lambert, J. Catal., 1985, 92, 364 CrossRef CAS.
- E. A. Carter and W. A. Goddard III, Surf. Sci., 1989, 209, 243 CrossRef CAS.
- X. Bao, M. Muhler, T. Schedel-Niedrig and R. Schlögl, Phys. Rev. B: Condens. Matter Mater. Phys., 1996, 54, 2249 CrossRef CAS.
- O. Porat and I. Riess, Solid State Ionics, 1994, 74, 229 CrossRef CAS.
- H. Raebiger, S. Lany and A. Zunger, Phys. Rev. B: Condens. Matter Mater. Phys., 2007, 76, 045209 CrossRef.
- D. O. Scanlon, B. J. Morgan, G. W. Watson and A. Walsh, Phys. Rev. Lett., 2009, 103, 096405 CrossRef.
- R. D. Schmidt-Whitley, M. Martinez-Clemente and A. Revcolevschi, J. Cryst. Growth, 1974, 23, 113 CrossRef CAS.
- J. Zaanen, G. A. Sawatzky and J. W. Allen, Phys. Rev. Lett., 1985, 55, 418 CrossRef CAS.
- C. T. Chen, F. Sette, Y. Ma, M. S. Hybertsen, E. B. Stechel, W. M. C. Foulkes, M. Schulter, S. W. Cheong, A. S. Cooper, L. W. Rupp, B. Batlogg, Y. L. Soo, Z. H. Ming, A. Krol and Y. H. Kao, Phys. Rev. Lett., 1991, 66, 104 CrossRef CAS.
- A. Krol, C. S. Lin, Z. H. Ming, C. J. Sher, Y. H. Kao, C. T. Chen, F. Sette, Y. Ma, G. C. Smith, Y. Z. Zhu and D. T. Shaw, Phys. Rev. B: Condens. Matter Mater. Phys., 1990, 42, 2635 CrossRef CAS.
- H. L. Ju, H. C. Sohn and K. M. Krishnan, Phys. Rev. Lett., 1997, 79, 3230 CrossRef CAS.
Footnote |
| † Electronic supplementary information (ESI) available. See DOI: 10.1039/c5cp03722k |
| This journal is © the Owner Societies 2015 |