 Open Access Article
Effect of process parameters on woody biomass fractionation in a methanol/water mixture in a semi-flow reactor†
Yilin
Yao
 ,
Eiji
Minami
 * and
Haruo
Kawamoto

Department of Socio-Environmental Energy Science, Graduate School of Energy Science, Kyoto University, Yoshida-honmachi, Sakyo-ku, Kyoto 606-8501, Japan. E-mail: minami@energy.kyoto-u.ac.jp; Fax: +81-(0)75-753-4736; Tel: +81-(0)75-753-5713
First published on 14th August 2024
Abstract
The degradation of woody biomass in methanol/water mixtures at elevated temperatures and pressures is a promising candidate for chemical production from renewable resources, combining the wood-degrading ability of water with the product-dissolving capacity of methanol. However, the effects of water and methanol on wood degradation remain unclear. In the present study, the effect of process parameters on the degradation of Japanese cedar in methanol/water at 270 °C and 10–30 MPa was investigated using a semi-flow reactor in which pressure and temperature can be controlled independently. At 270 °C, hemicelluloses were degraded and solubilized more preferentially at 10 MPa, but delignification was more preferred at 20 and 30 MPa. In the resulting products, methylation of coniferyl alcohol from lignin and methyl esterification of methyl glucuronopentosan from hemicellulose were more advanced at 20 and 30 MPa than at 10 MPa. These results suggest that at 10 MPa the influence of water is dominant and promotes polysaccharide degradation, whereas at 20 and 30 MPa the influence of methanol is dominant and promotes delignification. Our findings will provide insight into the establishment of efficient chemical production from woody biomass with solvolysis technology.
Introduction
The efficient conversion of woody biomass into valuable chemicals has always been a popular topic of research, but the strong and complex structure of wood cell walls, which comprise cellulose, hemicelluloses, and lignin, renders it difficult. Supercritical fluid technology is a candidate for wood conversion owing to its unique properties.1 Owing to its high ionic product and solubility, supercritical water (critical point (CP), 374 °C and 22.1 MPa) can serve as a catalyst and solvent for wood decomposition and subsequent solubilization of the resulting products, respectively.2,3 However, undesirable recondensation and over-degradation of the products have been reported owing to the severe reaction conditions.4–9 Therefore, wood decomposition in hot-compressed water at lower temperatures than supercritical water has been studied. Takada and Saka reported that lignin and hemicelluloses were decomposed at 230 °C and cellulose at 270 °C, but the solubility of lignin derivatives in hot-compressed water was not high, resulting in less delignification.8However, methanol, which has a lower CP (239 °C and 8.1 MPa) than water, can provide more moderate reaction conditions and dissolve more lignin-derived products because it dissolves aromatics more readily.10–13 Lignin can be depolymerized by β-ether cleavage, and even oligomers dissolve well in methanol, facilitating delignification.10 Polysaccharides can also be decomposed by methanolysis to produce methylglycosides.14 Owing to the excellent delignification capability of supercritical methanol, the production of aromatic chemicals in combination with catalytic hydrogenolysis and hydrogenation has been studied extensively in recent years.15–21 However, we have reported that methanol is less reactive than water, requiring 270 °C for the degradation of lignin and hemicelluloses, and 350 °C for cellulose.10
Given this situation, mixing methanol and water would combine the wood-decomposing ability of water with the product-solubilizing ability of methanol.22–27 We have reported that the addition of water to methanol facilitates wood decomposition and solubilization better than neat methanol and neat water in a batch reactor, and that Japanese beech sapwood is almost completely decomposed and solubilized at 350 °C with an optimum water content of 10 vol%.22 Cheng et al. obtained 65 wt% bio-oil from white pine sawdust at 300 °C for 15 min using 50 wt% aqueous methanol or ethanol.23 Other studies have demonstrated the positive effect on wood liquefaction of adding water to alcohol, even in the presence of alkaline catalysts such as KOH and NaOH,27 or heterogeneous solid catalysts such as Ru/H-beta zeolite, Ni/Al2O3, and CuZnAl.24–27 Despite such interesting studies, the effects of the physical properties of water and methanol, which change with temperature and pressure, on wood decomposition are not fully understood.
Semi-flow reactors allow rapid recovery of products, thereby preventing unwanted over-degradation. In recent years, the efficient production of aromatic monomers by solvolysis of lignin in a semi-flow reactor followed by catalytic hydrogenolysis and hydrogenation in a fixed bed catalyst column has been extensively studied.19–21 In addition, semi-flow reactors are suitable for investigating the effects of the process parameters because they enable the independent control of temperature, pressure, and flow rate and provide time-resolved data.19 In a previous study, we developed a semi-flow reactor and investigated the effect of pressure on the decomposition of Japanese cedar in supercritical methanol. We reported that high pressure enabled the solubilization of high-molecular-weight lignin-derived oligomers and facilitated delignification.28
In the present study, we investigated the effects of solvent pressure and flow rate on the decomposition of Japanese cedar in methanol with the addition of 10 vol% water. The mechanism by which the decomposition took place is discussed herein to reveal the establishment of sophisticated chemical production from woody biomass.
Experimental
Materials
Japanese cedar (Cryptomeria japonica) sapwood flour (NAKAWOOD Co., Ltd, Tokushima, Japan; sieved to a fraction between 100 and 35 mesh (ca. 0.15–0.5 mm in size)) was extracted with acetone for 4 h using Soxhlet apparatus, and dried overnight at 105 °C. Holocellulose, a delignified sample, was prepared from this extractive-free wood flour by repeating the Wise method29 seven times, and was used for comparison to study the effect of lignin. Methanol (>99.8%, guaranteed reagent grade, Nacalai Tesque Inc., Kyoto, Japan) and deionized water prepared with a Milli-Q Integral 3 system (Merck Millipore, Burlington, MA, USA) were used as solvents.Semi-flow reactor
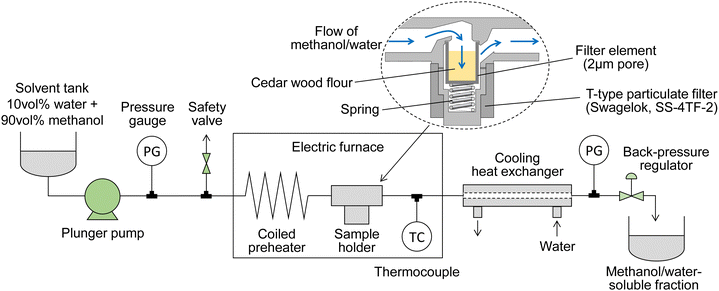
Fig. 1 shows a scheme of the semi-flow reactor, which we have described in detail previously.28 Approximately 150 mg of the wood flour (or 100 mg of its holocellulose) was placed in a particulate filter (SS-4TF-2,2-μm nominal pore size; Swagelok Co., Solon, OH, USA), which served as a sample holder. A methanol/water mixture was supplied with a plunger pump at a ratio of 90/10 v/v (the methanol mole fraction is approximately 0.8), which was the optimum value established in our previous report,22 at flow rates of 5, 10, or 20 mL min−1; the pressure of the mixture was set to 10, 20, or 30 MPa using a back-pressure valve. A coiled preheater and the sample holder were heated in an electric furnace. The reaction temperature, which was measured at the outlet of the sample holder, was controlled from room temperature to 270 °C at a rate of ca. 8 °C min−1, and then maintained at 270 °C for 30 min. Bazaev et al. reported the critical temperature and pressure of the methanol/water mixture (methanol mole fraction 0.8) as 260 °C and 10.2 MPa, respectively.30 In the above treatment, the methanol/water mixture is supercritical from 260 to 270 °C, but is in the liquid phase from room temperature to 260 °C. Therefore, the term supercritical is not used in this paper.During the treatment, the wood-derived products solubilized in the methanol/water mixture flowed out of the sample holder and were collected in a glass bottle after cooling in a cooling tube; this fraction is referred to as the soluble fraction. After treatment, the sample holder was quenched by opening the furnace and increasing the solvent flow rate to 30 mL min−1. The solid residue in the holder was then collected and dried in an oven at 105 °C; this fraction is referred to as the insoluble residue. For comparison, treatment with neat methanol at 270 °C or neat water at 230 °C was conducted in the same manner. The reason we chose different temperatures for neat methanol and neat water is that the reactivity of wood in these solvents is different. Water at 230 °C and methanol at 270 °C are equivalent and can degrade hemicelluloses and lignin, but not cellulose, at these temperatures.9,10 All experiments were performed in duplicate, and the results are reported as averages, except for the experiments with holocellulose, neat methanol, and neat water, which were conducted for comparison.
Analytical methods
The lignin content of the insoluble residue was determined by the Klason method,31 and is reported as the sum of the Klason lignin and the acid-soluble lignin. The cellulose and hemicellulose contents were estimated based on the composition of monosaccharides present in the hydrolysate from lignin determination with the assumption that the glucose/mannose ratio of glucomannan is 1/4 (mol mol−1).32 The hydrolysate was analyzed by high-performance anion-exchange chromatography (HPAEC).We carried out the following analyses on the soluble fraction: HPAEC to determine saccharide yield; high-performance liquid chromatography (HPLC) to quantify lignin-derived monomers; gel permeation chromatography (GPC) to analyze the molecular weight distribution of lignin-derived oligomers; heteronuclear single quantum coherence spectroscopy (HSQC) for chemical structure analysis of lignin-derived oligomers; gas chromatography-mass spectrometry (GC-MS) for product identification, and matrix-assisted laser desorption ionization-time-of-flight mass spectrometry (MALDI-TOF/MS) for oligosaccharide analysis.
Because the soluble fraction contained methylated mono- and oligosaccharides as described below, the saccharide yield is reported as the monosaccharide yield after hydrolysis. For this purpose, the soluble fraction was dried under vacuum, hydrolyzed in an autoclave at 121 °C with 4 wt% aqueous sulfuric acid, and subjected to HPAEC analysis. To remove monomeric compounds prior to HSQC analysis, the soluble fraction was dried under vacuum and fractionated with ethyl acetate and water. The ethyl acetate fraction was then dried under vacuum, washed with n-hexane, and dissolved in deuterated dimethyl sulfoxide.33 For GC-MS analysis, 1,3-diphenoxybenzene was added to the soluble fraction as an internal standard. The mixture was then dried under vacuum and silylated by adding hexamethyldisilizane (150 μL), trimethylchlorosilane (80 μL), and pyridine (100 μL) while stirring at 60 °C for 30 min. The conditions of each analysis were as follows.
HPLC: LC-20A (Shimadzu Corp., Kyoto, Japan); column, Cadenza CD-C18 (Imtakt Corp., Kyoto, Japan); eluent, methanol/water = 20/80 to 100/0 (50 min); flow rate, 1.0 mL min−1; ultraviolet (UV) detector, 280 nm; column temperature, 40 °C.
GPC: LC-20A; column, Shodex KF-803, KF-802.5, KF-802, and KF-801 (Resonac Holdings Corp., Tokyo, Japan) in series; flow rate, 0.6 mL min−1; eluent, tetrahydrofuran; UV detector, 280 nm; column temperature, 50 °C.
HPAEC: Prominence (Shimadzu Corp.); column, CarboPac PA-1 (250-mm analysis column connected with a 50 mm guard column; Thermo Fisher Scientific Inc.); eluent, 30 mM aqueous sodium hydroxide; flow rate, 1.0 mL min−1; electrochemical detector (DECADE Elite, Antec Scientific, Zoeterwoude, The Netherlands); column temperature, 35 °C.
GC-MS: QP2010 Ultra (Shimadzu Corp.); column, CPSil 8CB (Agilent Technologies Inc., 30 m length, 0.25 mm diameter, 0.25 μm thickness); injection temperature, 250 °C; split ratio, 10/1; column temperature, 100 °C (2 min), 4 °C min−1 to 220 °C, 220 °C (2 min), 15 °C min−1 to 300 °C, 300 °C (2 min); carrier gas, hydrogen; flow rate, 37.4 mL min−1.
MALDI-TOF/MS: AXIMA Performance (Shimadzu Corp.); linear mode; acceleration voltage, 20 kV; pulsed laser, 200 μJ per shot; matrix solution, 2,5-dihydroxy-benzoic acid (Sigma-Aldrich, Inc., St. Louis, MD, USA); sodium solution, sodium trifluoroacetate (Sigma-Aldrich, Inc.).
HSQC: Varian AC-400 spectrometer (400 MHz, Varian Medical Systems, Inc., Palo Alto, CA, USA).
Results and discussion
Degradation behavior of wood cell wall components
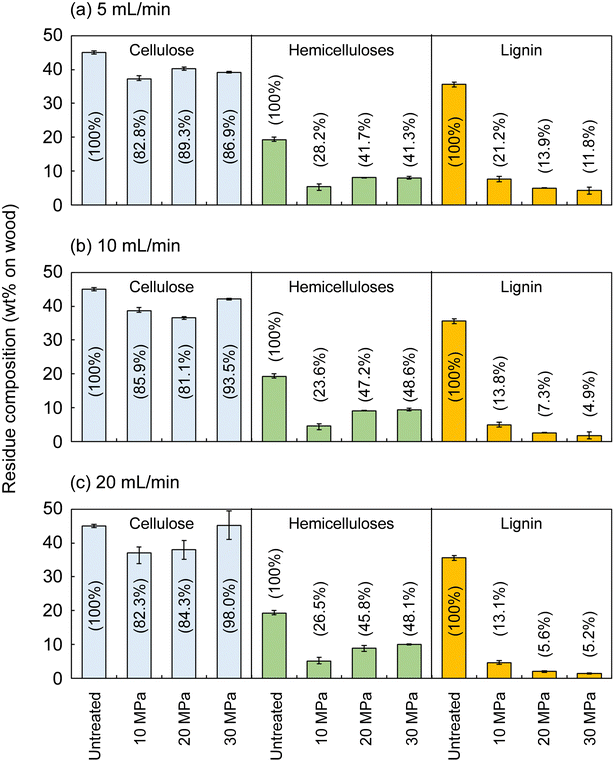
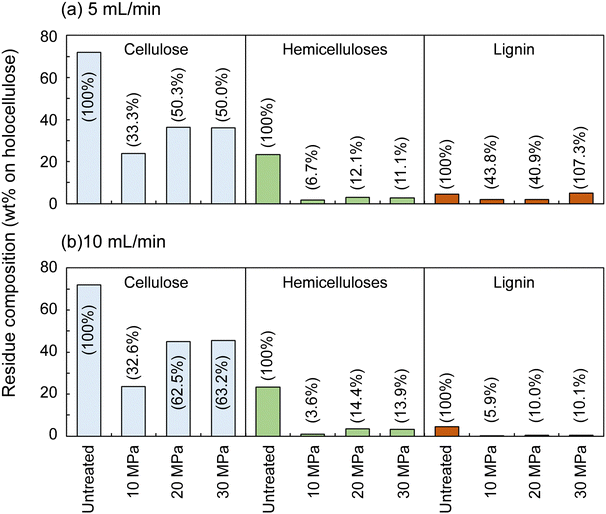
Fig. 2 shows the composition of the insoluble residue obtained from Japanese cedar as treated at 270 °C in methanol/water at various pressures and flow rates in comparison with untreated wood. At this temperature, cellulose did not degrade much, with >80% remaining in the residue under all conditions. Hemicelluloses and lignin were well degraded and solubilized, leaving 23.6–48.6% and 4.9–21.2% in the residue, respectively.The hemicelluloses were less affected by the solvent flow rate, but were affected by pressure: the residual hemicelluloses were significantly reduced by approximately half at 10 MPa compared with at 20 and 30 MPa. Fig. 3 shows the results pertaining to holocellulose, a delignified sample, in which cellulose was degraded to some extent along with the hemicelluloses. As in the case of cedar wood, these polysaccharide components were more degraded and solubilized at 10 MPa, and the remaining cellulose and hemicelluloses were significantly reduced compared with those at 20 and 30 MPa, with little flow rate dependence.
Lignin was affected by both solvent pressure and flow rate (Fig. 2); higher pressures and faster flow rates tended to reduce the residual lignin. We reported greater delignification at higher pressures in the case of supercritical methanol without water in a previous study, which revealed that high pressures improved the solubility of high-molecular-weight lignin-derived oligomers, thereby facilitating delignification.28 This phenomenon was also expected in the water-added case and will be discussed later.
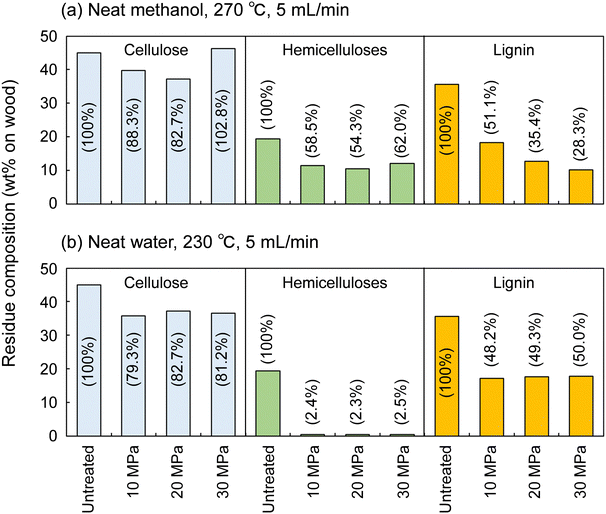
Fig. 4 shows the results for neat methanol at 270 °C and neat water at 230 °C; under those conditions, cellulose did not degrade much. In neat methanol, more hemicelluloses (approximately 60%) and lignin (28.3–51.1%) remained in the residue compared with in the water-added methanol case. Therefore, it is obvious that the addition of 10 vol% water facilitated their degradation and solubilization. Although delignification is facilitated at high pressures in neat methanol, the degradation of hemicelluloses is not pressure dependent. Therefore, in the methanol/water mixture, the pressure dependence of delignification can be attributed to methanol, whereas that of hemicellulose degradation might be due to water. In neat water (Fig. 4b), the hemicelluloses were almost completely degraded and solubilized, leaving little residue, whereas more lignin remained in the residue than in neat methanol and the methanol/water mixture. This comparison of the results for water and methanol shows that methanol is favorable for delignification, and water is preferred for polysaccharide degradation.
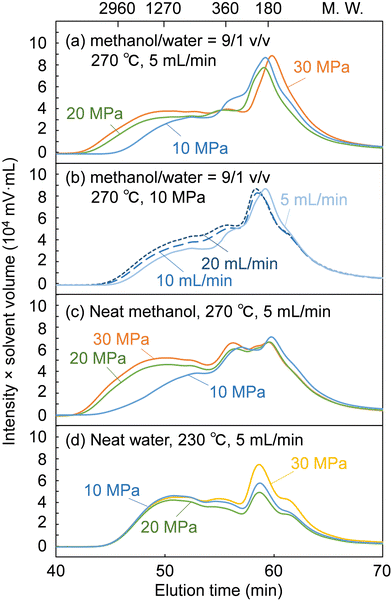
Fig. 5 shows GPC chromatograms of the soluble fractions obtained from the treatment of cedar wood in the methanol/water mixture, compared with the neat methanol and neat water cases. Note that the chromatograms were recorded with a UV detector to provide a rough estimate of the molecular weight distribution of the lignin-derived products that absorbed UV light. The concentration of the soluble fraction decreased in inverse proportion to the flow rate, i.e., the solvent volume decreased the detection intensity during GPC analysis. Therefore, for direct comparison, the vertical axis of the chromatograms was given as the product of the detection intensity and the solvent volume but is hereafter simply referred to as intensity.
The chromatograms show that the molecular weight was distributed from the monomeric region (ca. 180 or less) to over 2960 in polystyrene equivalents. At a constant flow rate of 5 mL min−1 (Fig. 5a), the intensity in the high molecular weight region (from ca. 1270 to above 2960) increased with increasing pressure. This indicates that the facilitated delignification at high pressures (Fig. 2) was due to the dissolution of high-molecular-weight lignin-derived products, as already suggested in the case of neat methanol (Fig. 5c).28 In the case of neat water (Fig. 5d), the molecular weight distribution did not change with increasing pressure. Therefore, it is clear that the facilitated delignification at high pressures originates from methanol, not water.
At a constant pressure of 10 MPa (Fig. 5b), the shape of the molecular weight distribution did not change much, but the intensity tended to increase in the entire molecular weight region with increasing flow rate. This increased intensity can be attributed to the increase in solvent volume proportional to the flow rate, which dissolved more lignin-derived products. This may be the reason for the improved delignification with increasing flow rate (Fig. 2). However, the hemicelluloses were not affected by the solvent flow rate in Fig. 2, probably because the slow decomposition of polysaccharides in methanol was the limiting factor rather than solubility.
As described above, the changes in the molecular weight distribution in Fig. 5 with the solvent pressure and flow rate correspond well to the degradation behavior of lignin shown in Fig. 2. In the methanol/water mixture, because delignification was enhanced at 20 and 30 MPa, and polysaccharide degradation was promoted at 10 MPa, the properties of methanol seemed to dominate at 20 and 30 MPa, and those of water at 10 MPa.
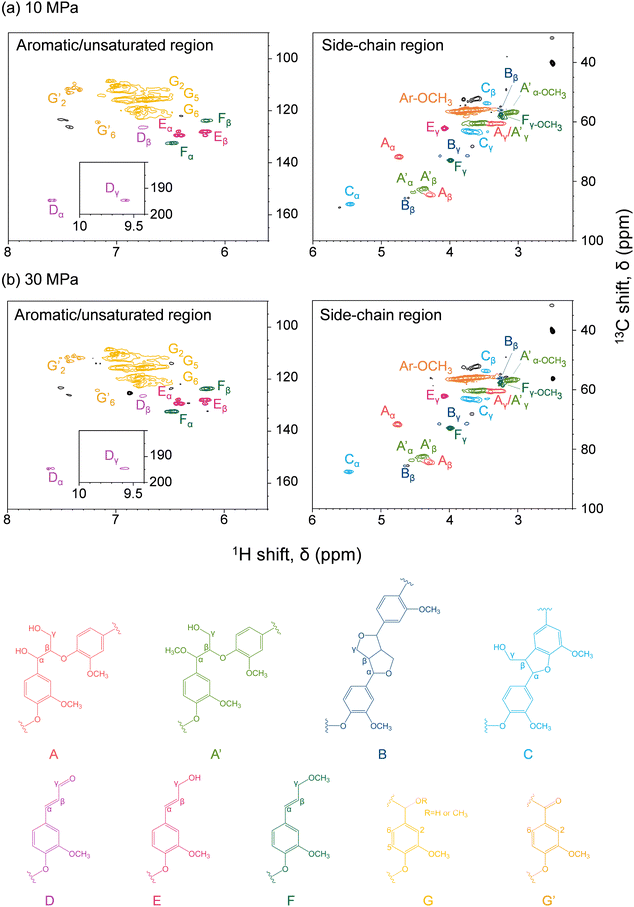
Characterization of lignin-derived products
Fig. 6 shows the HSQC spectra of lignin-derived oligomers in the soluble fraction obtained from Japanese cedar as treated in methanol/water at 10 and 30 MPa, with the corresponding chemical structures. Because β-O-4 (A), pinoresinol (B), and phenylcoumaran (C) structures were found, the lignin-derived oligomers retained the original lignin structures to some extent. In addition, methylation of the α-hydroxy group of the β-O-4 structure (A′) and the γ-hydroxy group of the coniferyl alcohol unit (F) was observed under the influence of methanol.The spectra do not reveal any significant difference between the 10 and 30 MPa cases, indicating that pressure had little effect on the chemical structures of the lignin-derived oligomers, and that the facilitated delignification at 30 MPa was only owing to the improved solubility, as suggested by the GPC analysis reported in Fig. 5. Furthermore, the HSQC spectra do not differ significantly from the case of neat methanol,28 indicating that the addition of 10 vol% water affected the degree of delignification, but not the chemical structures of the lignin-derived products. Note that Andersen et al. also reported similar HSQC spectra when poplar was treated with neat methanol at 190 °C and 6 MPa, although in this case hydrogen gas was introduced simultaneously.19
Fig. 7 shows the GC-MS chromatograms of the soluble fractions. The major peaks of the lignin-derived monomers were attributable to coniferyl alcohol (CA, 15) and its γ-methyl ether (CA-γ, 6). CA is the primary product of the radical cleavage of β-ether bonds via quinone methide intermediates.20,34–36 It is also formed by the supercritical methanol treatment of dimeric β-O-4 lignin model compounds.37 Free CA can be converted into CA-γ in supercritical methanol,37 and can also be formed prior to β-ether cleavage, as confirmed by HSQC in the present study (Fig. 6). Similar γ-esterified CAs have been reported to be formed in other monohydric (e.g., ethanol and 1-propanol) or dihydric (1,3-butanediol) alcohols.11,35 Vanillin (1), isoeugenol (IE, 2), dihydroconiferyl alcohol (DHCA, 8), and coniferyl aldehyde (CAld, 9) were also detected in small quantities.
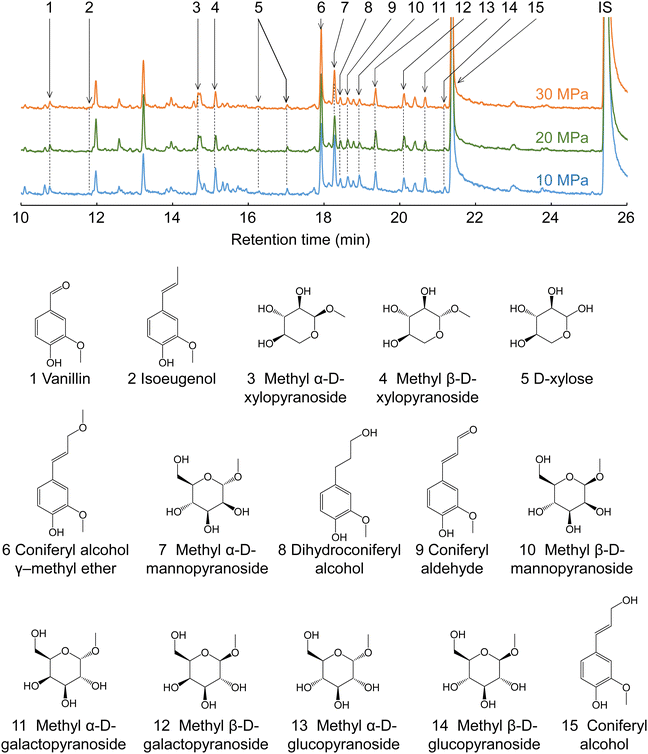 | ||
| Fig. 7 Gas chromatography-mass spectrometry chromatograms of the soluble fractions obtained from Japanese cedar wood after treatment with methanol/water (90/10, v/v) at various pressures. | ||
The quantification results shown in Table 1 indicate that CA and CA-γ accounted for at least >60% of the lignin-derived monomers identified in the methanol/water treatment. The total monomer yield was higher at lower pressures and slower flow rates. For example, at 10 MPa and 5 mL min−1, the total monomer yield peaked at 19.1 wt% based on lignin, but reached a minimum of 11.4 wt% at 30 MPa and 20 mL min−1. This trend was the opposite to that of delignification, which was more favorable at higher pressures and faster flow rates, as shown in Fig. 2. The HSQC spectra (Fig. 6) show that the β-O-4 structures still remained in the lignin-derived oligomers in the soluble fraction. These β-ether bonds can be further cleaved to form more monomers if the oligomers take longer to reach the cooling tube. Higher pressures would extract oligomers from the wood cell walls more efficiently, and faster flow rates would allow oligomers to flow more quickly from the reactor into the cooling tube, thereby suppressing cleavage of these remaining β-ether bonds and decreasing the formation of monomers. This may be the reason for the opposite trends in monomer yield and delignification.
| Solvent | Pressure (MPa) | Flow rate (mL min−1) | Yield (wt% on original lignin) | ||||||
|---|---|---|---|---|---|---|---|---|---|
| CA | CA-γ | Vanillin | CAld | IE | DHCA | Total | |||
| nd, not detected; CA, coniferyl alcohol; CA-γ, coniferyl alcohol γ-methyl ether; Cald, coniferyl aldehyde; IE, isoeugenol; DHCA, dihydroconiferyl alcohol. | |||||||||
| Methanol/water = 90/10 (270 °C) | 10 | 5 | 12.6 | 2.4 | 1.8 | 1.7 | 0.5 | 0.1 | 19.1 |
| 10 | 11.4 | 1.7 | 2.0 | 1.7 | 0.2 | 0.1 | 17.1 | ||
| 20 | 11.4 | 1.2 | 2.1 | 1.9 | nd | 0.2 | 16.7 | ||
| 20 | 5 | 9.5 | 2.8 | 1.2 | 1.5 | 0.4 | 0.1 | 15.5 | |
| 10 | 8.3 | 1.1 | 1.8 | 1.5 | 0.1 | 0.1 | 12.9 | ||
| 20 | 6.5 | 1.6 | 2.3 | 1.8 | nd | 0.1 | 12.3 | ||
| 30 | 5 | 7.9 | 3.4 | 1.2 | 1.4 | 0.2 | 0.1 | 14.2 | |
| 10 | 7.2 | 1.4 | 1.6 | 1.4 | 0.2 | 0.1 | 11.8 | ||
| 20 | 5.8 | 1.4 | 2.3 | 1.8 | nd | 0.1 | 11.4 | ||
| Methanol (270 °C) | 10 | 5 | 4.1 | 4.9 | 0.7 | 0.5 | 1.7 | 0.7 | 12.6 |
| 20 | 5 | 6.8 | 3.6 | 0.8 | 0.5 | 0.8 | 0.4 | 12.9 | |
| 30 | 5 | 6.2 | 3.8 | 0.6 | 0.4 | 0.9 | 0.3 | 12.2 | |
| Water (230 °C) | 10 | 5 | 8.2 | nd | 1.7 | 1.8 | nd | 0.6 | 12.3 |
| 20 | 5 | 7.9 | nd | 1.6 | 1.9 | nd | 0.6 | 11.9 | |
| 30 | 5 | 8.3 | nd | 1.6 | 1.8 | nd | 0.6 | 12.2 | |
The conversion of CA to CA-γ tended to be pronounced at higher pressures and slower flow rates. For example, at 10 MPa and 20 mL min−1, the CA-γ/CA ratio had a minimum value of 1.2/11.4 = 0.11, whereas at 30 MPa and 5 mL min−1, it peaked at 3.4/7.9 = 0.43. The conversion to CA-γ may increase owing to the long residence time in the reactor at slow flow rates, and also increase owing to the marked influence of methanol at high pressures. In Table 1, the CA-γ/CA ratio is higher for neat methanol compared with the water-added methanol cases, whereas CA-γ was not produced in neat water, as expected.
CAld, IE, and DHCA are possible pyrolysis products of CA, and quinone methide and radical mechanisms have been proposed as pathways for their formation.38 CAld formation occurred less in neat methanol and more in neat water, and CAld formation in water-added methanol was similar to, or slightly less than, that in neat water. Conversely, the IE yield was higher in neat methanol, lower in water-added methanol, and undetectable in neat water. DHCA was detected to some extent in neat methanol and neat water, but less so in water-added methanol. It is difficult to produce vanillin from CA. Therefore, it is probably produced by some other mechanism. For example, vanillin is one of the acidolysis products of lignin, and is also found in small amounts in subcritical water or steam explosion treatment.9,39 Although it is interesting that the selectivity of the formation of these minor products changes with the type of solvent, there are insufficient experimental data for a full discussion of this in the present study.
Characterization of polysaccharide-derived products
Cellulose was relatively stable at 270 °C in methanol/water (Fig. 2). Therefore, we expected most of the polysaccharide-derived products to have originated from hemicelluloses. The main monosaccharides detected in the GC-MS spectra (Fig. 7) were methyl glycosides, such as methyl-D-xylopyranosides (3 and 4), methyl-D-mannopyranosides (7 and 10), methyl-D-galactopyranosides (11 and 12), and methyl-D-glucopyranosides (13 and 14), but they were present in low levels, and sugar-derived products such as furfural and 5-hydroxymethylfurfural were not detected. Therefore, most of the polysaccharide-derived products were probably oligosaccharides.Fig. 8 shows the MALDI-TOF/MS spectra of the soluble fractions from Japanese cedar holocellulose treated in the methanol/water mixture. We have included the holocellulose data because the soluble fraction from the Japanese cedar wood was difficult to analyze by MALDI-TOF/MS, probably due to the presence of lignin. The products were detected as sodium-added ions (+23) because a sodium solution was used with the matrix. Based on the mass-to-charge ratios, we detected peaks attributable to the 132 m/z (pentose unit) intervals of +32 (OCH3 + H) and +23 (Na-added) (e.g., 1111.5 and 1243.5), which can be assigned to pentosans with a methylated reducing end (PnMe). Peaks attributable to methyl glucuronic acid (+190, PnMe(MG), e.g., 1037.5 and 1169.5) or its methyl ester (+204, PnMe(MGMe), e.g., 1051.5 and 1183.5) added to the pentosan were also observed. These peaks can be assigned to oligosaccharides produced from arabino-4-O-methylglucuronoxylan by methanolysis, of which some methyl glucuronic acid residues were methyl esterified under the influence of methanol. It is interesting to note that the peaks attributable to pentosans with methyl-esterified methyl glucuronic acid (PnMe(MGMe)) increased with increasing pressure. This result also supports the intense effect of methanol at high pressures. Although methylated hexosans from acetylgalactoglucomannan or cellulose were not detected by MALDI-TOF/MS, they are considered to be present in the soluble fractions as well as the pentosans, according to the sugar analysis below.
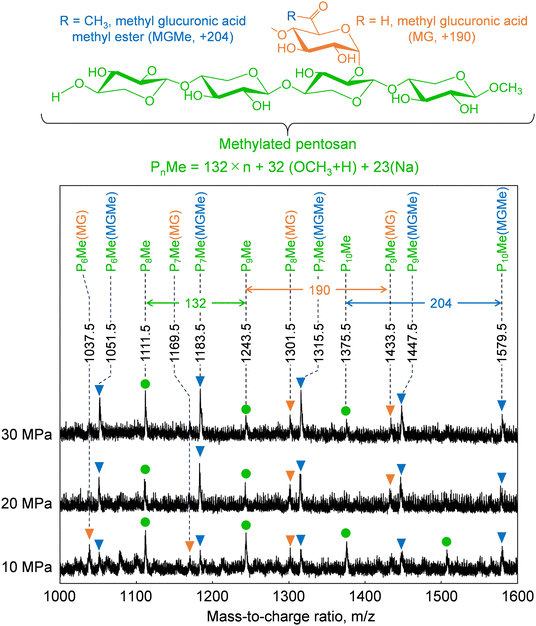 | ||
| Fig. 8 Matrix-assisted laser desorption ionization-time-of-flight mass spectra of oligosaccharides obtained from holocellulose after treatment with methanol/water (90/10, v/v) at various pressures. | ||
The formation of oligosaccharides with few monosaccharides may be due to a feature of the semi-flow reactor that enables rapid flow of the products from the reactor and their recovery as oligosaccharides before decomposition to monomers. Similarly, the formation of oligosaccharides with reducing ends by hydrolysis has also been reported in hot-compressed water treatment with a semi-flow reactor. However, in the present study, no oligosaccharides with reducing ends were detected, despite the presence of water. This may have been because hydrolysis did not proceed well with only 10% water, and/or the unstable reducing ends were rapidly methylated or degraded. We expected hydrolysis to be involved in the mechanism, but only methylglycosides derived from methanolysis were detected, with almost no hydrolysis products. Therefore, the mechanism by which the addition of water promotes wood degradation remains unclear.
To quantify the recovered saccharides, the soluble fractions from Japanese cedar wood were hydrolyzed, and the yields of the resulting monosaccharides are shown in Table 2. Glucose (Glu), mannose (Man), galactose (Gala), xylose (Xyl), and arabinose (Ara) were present as constituent sugars. Therefore, it is clear that galactoglucomannan-derived hexosans were present in the soluble fraction, as well as arabinoxylan-derived pentosans.
| Solvent | Pressure (MPa) | Yield (wt% on original polysaccharides [cellulose + hemicelluloses]) | |||||||
|---|---|---|---|---|---|---|---|---|---|
| Solubilized | Recovered neutral monosaccharides | ||||||||
| Glu | Man | Xyl | Gala | Ara | Rha | Total | |||
| Glu, glucose; Man, mannose; Xyl, xylose; Gala, galactose; Ara, arabinose; Rha, rhamnose; solubilized, percentage of polysaccharide components in Japanese cedar that were degraded and solubilized in the soluble fraction, evaluated from the results in Fig. 2. | |||||||||
| Methanol/water = 90/10 (270 °C) | 10 | 33.4 | 1.2 | 2.7 | 3.0 | 1.3 | 1.3 | 0.2 | 9.7 |
| 20 | 24.8 | 1.1 | 2.4 | 3.2 | 1.3 | 1.2 | 0.2 | 9.4 | |
| 30 | 26.6 | 1.5 | 2.7 | 3.8 | 1.5 | 1.4 | 0.2 | 11.1 | |
| Methanol (270 °C) | 10 | 24.1 | 0.2 | 0.4 | 0.4 | 0.4 | 0.7 | 0.1 | 2.2 |
| 20 | 27.2 | 0.7 | 0.7 | 0.9 | 0.7 | 0.9 | 0.1 | 4.0 | |
| 30 | 15.4 | 1.0 | 1.0 | 1.6 | 1.0 | 1.3 | 0.2 | 6.1 | |
| Water (230 °C) | 10 | 44.8 | 3.8 | 7.5 | 4.4 | 1.1 | 0.8 | 0.2 | 17.8 |
Table 2 also shows the percentages of solubilized products from polysaccharide components in the Japanese cedar, as estimated from the results in Fig. 2. Cellulose was degraded less in methanol/water at 270 °C, but the hemicelluloses were degraded and solubilized most at 10 MPa, resulting in the highest percentage of solubilized products: 33.4 wt% based on the original polysaccharide mass in the cedar wood. However, the total monosaccharide yield was only 9.7 wt%, which was lower than at 30 MPa. This indicates that most of the solubilized saccharides were further decomposed to other products at 10 MPa compared with at 30 MPa. Similarly, in the case of neat methanol, the total monosaccharide yield decreased with decreasing pressure. As explained below, the densities of neat methanol and the methanol/water mixture decrease significantly at 10 MPa at 270 °C (ca. 130 kg m−3, respectively),30,40 resulting in poor solubility, which could prevent rapid solubilization of oligosaccharides from wood cell walls and lead to over-decomposition. In the case of neat water, the density did not change much with pressure (774 kg m−3 at 10 MPa and 798 kg m−3 at 30 MPa) at 270 °C,41 and the total monosaccharide yield was high, even at 10 MPa.
Effects of solvent density on wood degradation
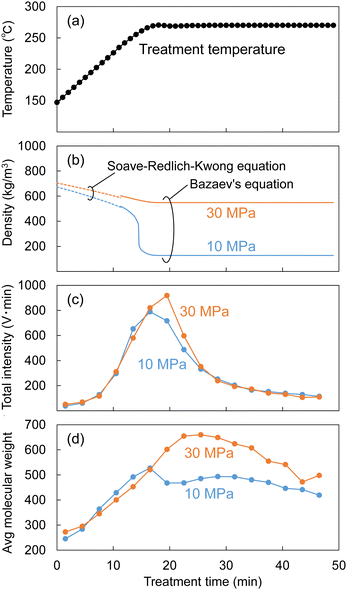
As described in the experimental section, the Japanese cedar wood was treated in methanol/water by raising the temperature to 270 °C at ca. 8 °C min−1, and the temperature was maintained at 270 °C for 30 min. During the treatment, the soluble fraction was collected every 3 min and subjected to GPC analysis to determine changes in the molecular weight distribution of the lignin-derived products over the treatment time. The results are shown in Fig. 9. The figure shows the changes in temperature (a) and the corresponding changes in (b) the density of the methanol/water (90/10, v/v) mixture, (c) the total intensity, and (d) the average molecular weight, as determined by GPC analysis.The density of the methanol/water mixture was calculated using the Bazaev equation,30 but at temperatures below 250 °C, where this equation is not applicable, the density was instead calculated using the Soave–Redlich–Kwong model with a steady-state process simulator (ProII 2023, AVEVA Group plc., Cambridge, UK). The total intensity (IT) was obtained by integrating the intensity (I) of the UV detector over the analysis time (0–70 min) in a GPC chromatogram, and served as an index of the amount of solubilized lignin-derived products. The average molecular weight (Mav) was defined as the average value of the molecular weight (M) weighted by the detection intensity (I) as follows:
 | (1) |
log10![[thin space (1/6-em)]](https://www.rsc.org/images/entities/char_2009.gif) M = −0.0865t + 7.4272 M = −0.0865t + 7.4272 | (2) |
In Fig. 9, while the temperature changed from 150 °C to approximately 250 °C, the methanol/water density changed little, with no significant difference between 10 and 30 MPa (approximately 500–700 kg m−3). The total intensity began to increase at approximately 200 °C, indicating that the lignin had begun to degrade and leach out of the cell walls. At this time, there was no difference in total intensity between 10 and 30 MPa, but when the temperature reached approximately 270 °C, the total intensity at 30 MPa became higher than that at 10 MPa. Similarly, there was no difference in the average molecular weight between 10 and 30 MPa before reaching 270 °C, but the difference became apparent at approximately 270 °C.
These behaviors can be attributed to the fact that the high-molecular-weight lignin-derived oligomers were solubilized more at 30 MPa than at 10 MPa, as shown in Fig. 5, and this seems to correspond well with the change in methanol/water density in Fig. 9. The density of the methanol/water mixture at 270 °C and 10 MPa decreased to 127 kg m−3, which could be considered gas-like, limiting the solubilization of high-molecular-weight lignin-derived oligomers. In contrast, at 30 MPa, the density of methanol/water was kept at 548 kg m−3, which could be considered liquid-like, thus preserving the solubility capacity.
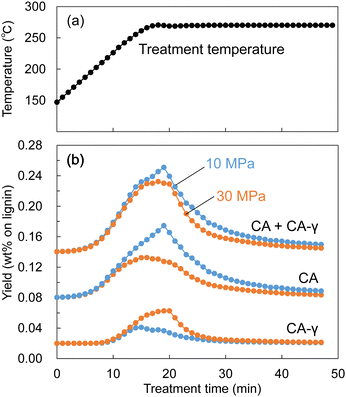
Similarly, during the treatment of Japanese cedar wood, the soluble fraction was collected every minute, and the resulting changes in yields of lignin-derived monomers are shown in Fig. 10. The formation of CA appeared at approximately 200 °C, and the yield of CA at 10 MPa became higher than that at 30 MPa from approximately 250 °C. At the same time, the yield of CA-γ at 30 MPa became higher than that at 10 MPa from approximately 250 °C. The large decrease in the density of methanol/water mostly started at 250 °C at 10 MPa as shown in Fig. 9. In this situation, we think the influence of methanol was weakened, resulting in suppressed methylation of CA. In addition, the low solvent density shortened its residence time, which also suppressed the conversion of CA to CA-γ. However, the total yield of CA and CA-γ was not significantly different between 10 and 30 MPa, indicating that pressure did not significantly affect the formation of CA, a primary product of β-ether cleavage, but only the conversion of CA to CA-γ.
Conclusions
In the present study, Japanese cedar wood was treated with the methanol/water mixture (90/10, v/v) at 270 °C and 10, 20, or 30 MPa using a semi-flow reactor to reveal the effect of process parameters on its degradation. The main findings were as follows.• Cellulose was not degraded significantly at 270 °C, but the degradation and solubilization of hemicelluloses proceeded preferentially at 10 MPa, but delignification was more preferred at 20 and 30 MPa.
• At 20 and 30 MPa, high-molecular-weight lignin-derived oligomers were dissolved more in the soluble fraction than at 10 MPa, resulting in facilitated delignification.
• In the resulting products, the conversion of coniferyl alcohol to its γ-methyl ether and the methyl esterification of methyl glucuronopentosan were more progressed at 20 and 30 MPa than at 10 MPa.
In neat methanol, efficient degradation and solubilization of lignin occurred along with methyl esterification of the resulting products. Conversely, hemicellulose degradation was more prevalent in neat water. A comparison of these results suggests that in the methanol/water mixture, the influence of methanol is more pronounced at 20 MPa and 30 MPa, while that of water dominates at 10 MPa. These results demonstrate that the behavior of the methanol/water mixture can be modulated by adjusting the process parameters. However, the specific mechanisms underlying these effects were not elucidated within the scope of this study.
Author contributions
YY and EM designed the study and evaluated the experimental data; YY performed the experiments and chemical analysis of the products, and drafted the manuscript; EM and HK supervised the study, and reviewed and edited the manuscript. All authors have read and approved the final version of the manuscript.Data availability
The data supporting this article have been included in the ESI.†Conflicts of interest
There are no conflicts to declare.Acknowledgements
We appreciate grants from the JST Mirai Program (JPMJMI20E3), JSPS KAKENHI (22K05765), and the Iwatani Naoji Foundation. We thank Edanz (https://jp.edanz.com/ac) for editing a draft of this manuscript.References
- C. A. Eckert, B. L. Knutson and P. G. Debenedetti, Nature, 1996, 383, 313–318 CrossRef CAS
.
- D. Bröll, C. Kaul, A. Krämer, P. Krammer, T. Richter, M. Jung, H. Vogel and P. Zehner, Angew. Chem., Int. Ed., 1999, 38, 2998–3014 CrossRef
.
- A. Kruse and E. Dinjus, J. Supercrit. Fluids, 2007, 41, 361–379 CrossRef CAS
.
- T. Adschiri, S. Hirose, R. Malaluan and K. Arai, J. Chem. Eng. Japan, 1993, 26, 676–680 CrossRef CAS
.
- N. Akiya and P. E. Savage, Chem. Rev., 2002, 102, 2725–2750 CrossRef CAS PubMed
.
- K. Ehara and S. Saka, Cellulose, 2002, 9, 301–311 CrossRef CAS
.
- Y. Yu, X. Lou and H. Wu, Energy Fuels, 2008, 22, 46–60 CrossRef CAS
.
- M. Takada and S. Saka, J. Wood Sci., 2015, 61, 299–307 CrossRef CAS
.
- N. Phaiboonsilpa, K. Yamauchi, X. Lu and S. Saka, J. Wood Sci., 2010, 56, 331–338 CrossRef CAS
.
- E. Minami and S. Saka, J. Wood Sci., 2003, 49, 73–78 CrossRef CAS
.
- J. Yamazaki, E. Minami and S. Saka, J. Wood Sci., 2006, 52, 527–532 CrossRef CAS
.
- S. Gillet, M. Aguedo, L. Petitjean, A. R. C. Morais, A. M. Da Costa Lopes, R. M. Łukasik and P. T. Anastas, Green Chem., 2017, 19, 4200–4233 RSC
.
- L. Shuai and J. Luterbacher, ChemSusChem, 2016, 9, 133–155 CrossRef CAS PubMed
.
- Y. Ishikawa and S. Saka, Cellulose, 2001, 8, 189–195 CrossRef CAS
.
- K. Barta, T. D. Matson, M. L. Fettig, S. L. Scott, A. V. Iretskii and P. C. Ford, Green Chem., 2010, 12, 1640–1647 RSC
.
- K. Barta and P. C. Ford, Acc. Chem. Res., 2014, 47, 1503–1512 CrossRef CAS PubMed
.
- P. H. Galebach, D. J. McClelland, N. M. Eagan, A. M. Wittrig, J. S. Buchanan, J. A. Dumesic and G. W. Huber, ACS Sustainable Chem. Eng., 2018, 6, 4330–4344 CrossRef CAS
.
- D. J. McClelland, P. H. Galebach, A. H. Motagamwala, A. M. Wittrig, S. D. Karlen, J. S. Buchanan, J. A. Dumesic and G. W. Huber, Green Chem., 2019, 21, 2988–3005 RSC
.
- E. M. Anderson, M. L. Stone, R. Katahira, M. Reed, G. T. Beckham and Y. Román-Leshkov, Joule, 2017, 1, 613–622 CrossRef CAS
.
- I. Kumaniaev, E. Subbotina, J. Sävmarker, M. Larhed, M. Galkin and J. S. Samec, Green Chem., 2017, 19, 5767–5771 RSC
.
- J. H. Jang, D. G. Brandner, R. J. Dreiling, A. J. Ringsby, J. R. Bussard, L. M. Stanley, R. M. Happs, A. S. Kovvali, J. I. Cutler, T. Renders, J. R. Bielenberg, Y. R. Leshkov and G. T. Beckham, Joule, 2022, 6, 1859–1875 CrossRef CAS
.
- E. Minami and S. Saka, J. Wood Sci., 2005, 51, 395–400 CrossRef CAS
.
- S. Cheng, I. DCruz, M. Wang, M. Leitch and C. Xu, Energy Fuels, 2010, 24, 4659–4667 CrossRef CAS
.
- S. Cheng, C. Wilks, Z. Yuan, M. Leitch and C. Xu, Polym. Degrad. Stab., 2012, 97, 839–848 CrossRef CAS
.
- P. T. Patil, U. Armbruster and A. Martin, J. Supercrit. Fluids, 2014, 93, 121–129 CrossRef CAS
.
- C. Zhou, X. Zhu, F. Qian, W. Shen, H. Xu, S. Zhang and J. Chen, Fuel Process. Technol., 2016, 154, 1–6 CrossRef CAS
.
- A. Yerrayya, A. K. Shree Vishnu, S. Shreyas, S. R. Chakravarthy and R. Vinu, Energies, 2020, 13, 1–19 CrossRef
.
- Y. Yilin, E. Minami and H. Kawamoto, J. Wood Sci., 2023, 69, 26 CrossRef CAS
.
- L. E. Wise, Pap. Trade J., 1946, 122, 35–43 CAS
.
- A. R. Bazaev, B. K. Karabekova and A. A. Abdurashidova, Russ. J. Phys. Chem. B, 2013, 7, 955–967 CrossRef CAS
.
-
C. W. Dence, Methods in Lignin Chemistry, Springer Verlag, Berlin, 1992, pp. 33–58 Search PubMed
.
- X. Zhou, W. Li, R. Mabon and L. J. Broadbelt, Energy Technol., 2017, 5, 52–79 CrossRef CAS
.
- J. Wang, E. Minami and H. Kawamoto, ChemistryOpen, 2022, 11, e202200104 CrossRef CAS PubMed
.
- S. Li, K. Lundquist and U. Westermark, Nord. Pulp Pap. Res. J., 2000, 15, 292–299 CAS
.
- T. Kishimoto and Y. Sano, Holzforschung, 2001, 55, 611–616 CAS
.
- T. Kishimoto and Y. Sano, Holzforschung, 2002, 56, 623–631 CAS
.
- J. Tsujino, H. Kawamoto and S. Saka, Wood Sci. Technol., 2003, 37, 299–307 CrossRef CAS
.
- T. Kotake, H. Kawamoto and S. Saka, J. Anal. Appl. Pyrolysis, 2013, 104, 573–584 CrossRef CAS
.
- M. Tanahashi, Bull. Wood Res. Inst. Kyoto Univ., 1990, 77, 49–117 CAS
.
- R. D. Goodwin, J. Phys. Chem. Ref. Data, 1987, 16, 799–892 CrossRef CAS
.
- W. Wagner and A. Pruß, J. Phys. Chem. Ref. Data, 2002, 31, 387–535 CrossRef CAS
.
Footnote |
| † Electronic supplementary information (ESI) available. See DOI: https://doi.org/10.1039/d4ya00261j |
| This journal is © The Royal Society of Chemistry 2024 |

