
Cryogenic fluorescence spectroscopy of oxazine ions isolated in vacuo†
Christina
Kjær
 *a,
Emil
Vogt
b,
Jeppe
Langeland
a,
Nanna Falk
Christensen
b,
Thomas Toft
Lindkvist
a,
Henrik G.
Kjaergaard
b and
Steen Brøndsted
Nielsen
a
*a,
Emil
Vogt
b,
Jeppe
Langeland
a,
Nanna Falk
Christensen
b,
Thomas Toft
Lindkvist
a,
Henrik G.
Kjaergaard
b and
Steen Brøndsted
Nielsen
a
aDepartment of Physics and Astronomy, Aarhus University, DK-8000 Aarhus C, Denmark. E-mail: christina.kjaer@phys.au.dk
bDepartment of Chemistry, University of Copenhagen, DK-2100 Copenhagen Ø, Denmark
First published on 22nd November 2023
Abstract
Recent developments in fluorescence spectroscopy have made it possible to measure both absorption and dispersed fluorescence spectra of isolated molecular ions at liquid-nitrogen temperatures. Absorption is here obtained from fluorescence-excitation experiments and does not rely on ion dissociation. One large advantage of reduced temperature compared to room-temperature spectroscopy is that spectra are narrow, and they provide information on vibronic features that can better be assigned from theoretical simulations. We report on the intrinsic spectroscopic properties of oxazine dyes cooled to about 100 K. They include six cations (crystal violet, darrow red, oxazine-1, oxazine-4, oxazine-170 and nile blue) and one anion (resorufin). Experiments were done with a home-built setup (LUNA2) where ions are stored, mass-selected, cooled, and photoexcited in a cylindrical ion trap. We find that the Stokes shifts are small (14–50 cm−1), which is ascribed to rigid geometries, that is, there are only small geometrical changes between the electronic ground and excited states. However, both the absorption and the emission spectra of darrow-red cations are broader than those of the other ionic dyes, which is likely associated with a less symmetric electronic structure and more non-zero Franck–Condon factors for the vibrational progressions. In the case of resorufin, the smallest ion under study, vibrational features are assigned based on calculated spectra.
Introduction
Cryogenic ion spectroscopy has gained significant attention in recent years as it provides intrinsic information on the photophysics of isolated molecular ions.1–9 At low temperatures, spectra exhibit reduced spectral congestion, which facilitates the assignment of bands and vibrational features as well as geometric structures. Experimental data on cold ions are better benchmarks for theoretical calculations of electronically excited states, which are still nontrivial and computational costly. The reduced flexibility also affords a situation that mimics the one in a viscous solvent where solvent molecules are more or less in fixed positions during the excited-state lifetime.Absorption by ions isolated in vacuo is most commonly identified indirectly from dissociation or electron detachment, known as action spectroscopy.10,11 In these experiments, the yield of a specific fragment ion is sampled as a function of excitation wavelength. A low temperature is beneficial for the attachment of a noble-gas atom, e.g., helium or neon, that only weakly perturbs the electronic structure in most cases and that, importantly, is easily lost after photoexcitation.12 Hence tagging spectroscopy not only guarantees low internal energies of the complex but also avoids the issue of kinetic shifts where more dissociation is obtained at high photon energies than at low ones within the relevant time window determined by the setup.11 In the case of fluorescent species, another approach can, however, also be taken as the yield of emitted photons as a function of excitation wavelength indirectly represents the absorption (a fluorescence-excitation spectrum).10,13,14 This technique also benefits from cryogenic temperatures where fluorescence quantum yields often are higher than at room temperature. Finally, but not least, the combination of absorption and emission spectra provides valuable information on excited-state dynamics and Stokes shifts, the latter defined as the energy difference between the absorption- and fluorescence-band maxima.13,14 In the case of isolated molecular ions, the Stokes shift is a proxy of the geometry change in the excited state.
One important family of ionic dyes that has been studied in gas-phase fluorescence experiments is oxazine dyes.15–17 Oxazines are a class of organic heterocyclic compounds that are valued for their fluorescence characteristics. They are widely used as fluorescent probes in biological imaging and staining applications18–20 and have recently been proposed as nerve biomarkers in guided surgery to avoid nerve-related injuries.21 One large advantage is that their photophysical properties depend on the microenvironment,22e.g., nearby solvent molecules and counter ions or the pH. To fully comprehend and identify such perturbations, information on the intrinsic photophysics of the isolated ionic dye is useful. It is, however, often nontrivial from solution-phase experiments to disentangle different effects. As an example, counter ions will bind to the charge site of the dye in nonpolar solvents (ion-pair formation) and affect the transition energy as discussed earlier in the case of nile blue.17 High dye concentrations can lead to dimer or aggregate formation as seen for cresyl violet23 which is an additional complication. Such issues are obviously avoided in gas-phase experiments where single and isolated ions are studied. The impact of substituents or other changes to the molecular structure is directly revealed without the need to consider how explicit solvent molecules are located differently between different ionic dyes in a solvent.
Room-temperature fluorescence spectra of seven gaseous oxazine cations showed similar features; however, darrow red, exhibited a distinctively broader emission profile than the others.15,16 and a shorter excited-state lifetime.16 Kusinski et al.16 also investigated the effect of deuteration of amine groups on emission profiles, fluorescence lifetimes and brightness. They reported that while gas-phase emission profiles remained largely unchanged upon deuteration, fluorescence lifetimes and brightness increased by 10–23%. Although significant increases, they were considerably lower than those observed in deuterated solution. In recent work, we examined the resorufin anion and reported fluorescence spectra both at room temperature and at 100 K.24,25 As expected, vibronic transitions became better resolved at lower temperatures, and active vibrations were assigned based on a Franck–Condon model. The observed vibronic bands were found to be dominated by in-plane vibrational modes that preserve the mirror-plane symmetry.25
We focus on the intrinsic spectroscopic properties of the oxazine dyes shown in Fig. 1; oxazine-1 (Ox-1+), oxazine-4 (Ox-4+), resorufin (R−), cresyl violet (CV+), oxazine-170 (Ox-170+), nile blue (NB+) and darrow red (DR+). The substituents on the core benzene rings are symmetrically positioned in the first three dyes and asymmetrically in the remaining four. Taking advantage of the home-built LUminescence iNstrument in Aarhus 2 (LUNA2), we have obtained gas-phase dispersed fluorescence spectra and fluorescence-excitation spectra at cryogenic temperatures, the latter limited to R−, Ox-170+ and DR+. Our low-temperature experimental investigations provide higher-quality spectra than previous room-temperature spectra and well-resolved vibrational features. We calculated Franck–Condon spectra of the smallest of the ions, namely R−, to examine the vibrations that couple with the electronic transition.
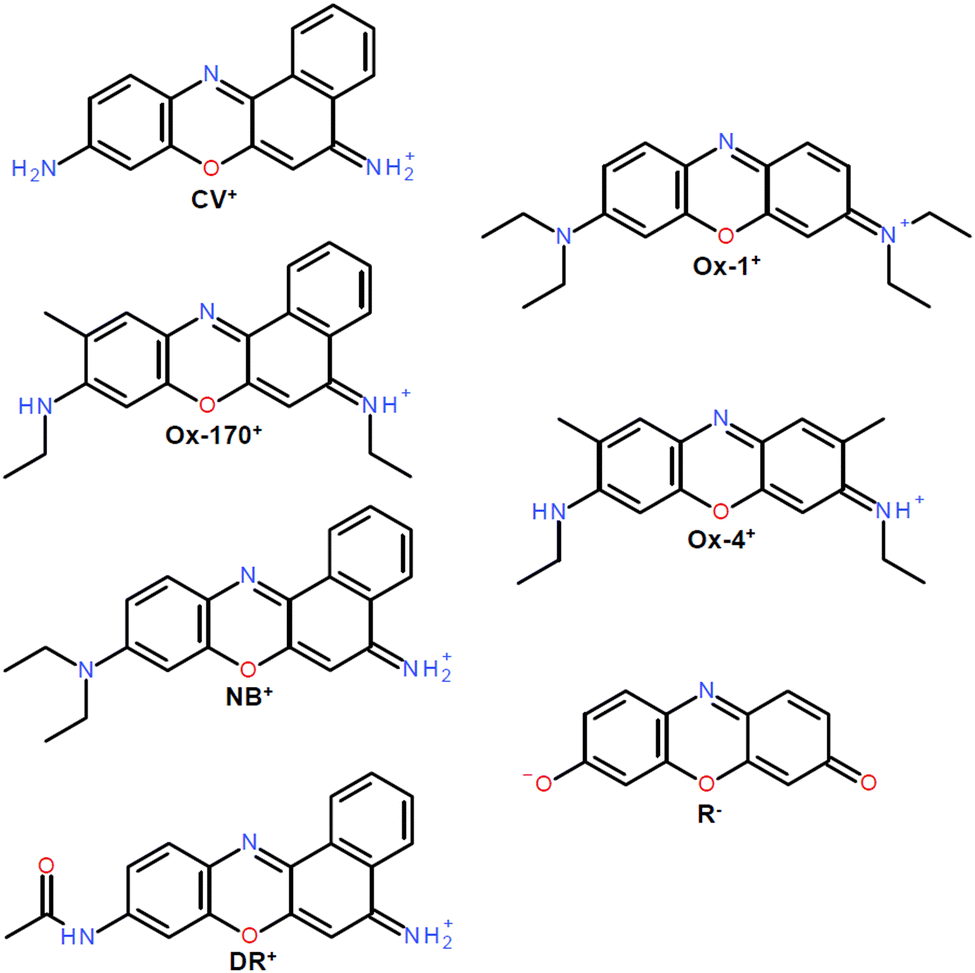 | ||
| Fig. 1 Chemical structures of ionic oxazine dyes. Cations: vresyl violet (CV+), oxazine-170 (Ox-170+), nile blue (NB+), darrow red (DR+), oxazine-1 (Ox-1+) and oxazine-4 (Ox-4+). Anion: resorufin (R−). | ||
Results and discussion
Cryogenic fluorescence-excitation spectra and dispersed-fluorescence spectra were measured using two different detection options at LUNA2. To obtain a fluorescence-excitation spectrum, emitted photons were monitored vs. excitation wavelength with a sensitive photomultiplier tube (PMT). Scattered laser light was blocked with four long-pass filters (total optical density (OD) of 20–24). The fluorescence-excitation spectra will be referred to as absorption spectra in the following, and the two are equal if the dispersed-fluorescence spectrum and the fluorescence-quantum yield are independent of excitation wavelength. Dispersed-fluorescence spectra were measured using a spectrometer with an iCCD camera, and laser photons were blocked with a notch filter (OD 5–6).First, we consider the absorption and fluorescence spectra of R− shown in Fig. 2(a). The former is comprised of measurements using 550 nm long-pass filters (grey) and 600 nm long-pass filters (black). The spectra overlap in the region between 535 and 540 nm and show excellent agreement even though two quite different regions of the fluorescence spectrum are probed. This implies that the assumption of dispersed fluorescence spectra not changing too much with excitation wavelength is a good one in this case. The absorption spectrum displays sharp vibrational progressions and a band maximum at 563.9 ± 0.1 nm. The fluorescence spectrum (blue) exhibits maximum intensity at 565.5 ± 0.5 nm, and the spectrum is significantly broader but still shows appreciable vibrational structure. In our previous work9,14,25,26 on a range of similar fused three-ring systems (pyronin Y, rhodamines, fluorones) and dimethyl-oxyluciferin, the fluorescence spectra were also broader and more congested than the fluorescence-excitation spectra. We showed that it was caused by an increased effective temperature of the ions due to excess energy deposited by the absorbed laser photon. In the case of R−, the excitation wavelength was 531.3 nm, which is 1100 cm−1 more than the energy of the most intense transition. At T = 100 K, this corresponds to an effective temperature increase of about 90 K.25 Excitation wavelengths are chosen based on available notch filters and the size of the Stokes shift to avoid filtering away emitted photons by the notch filter.
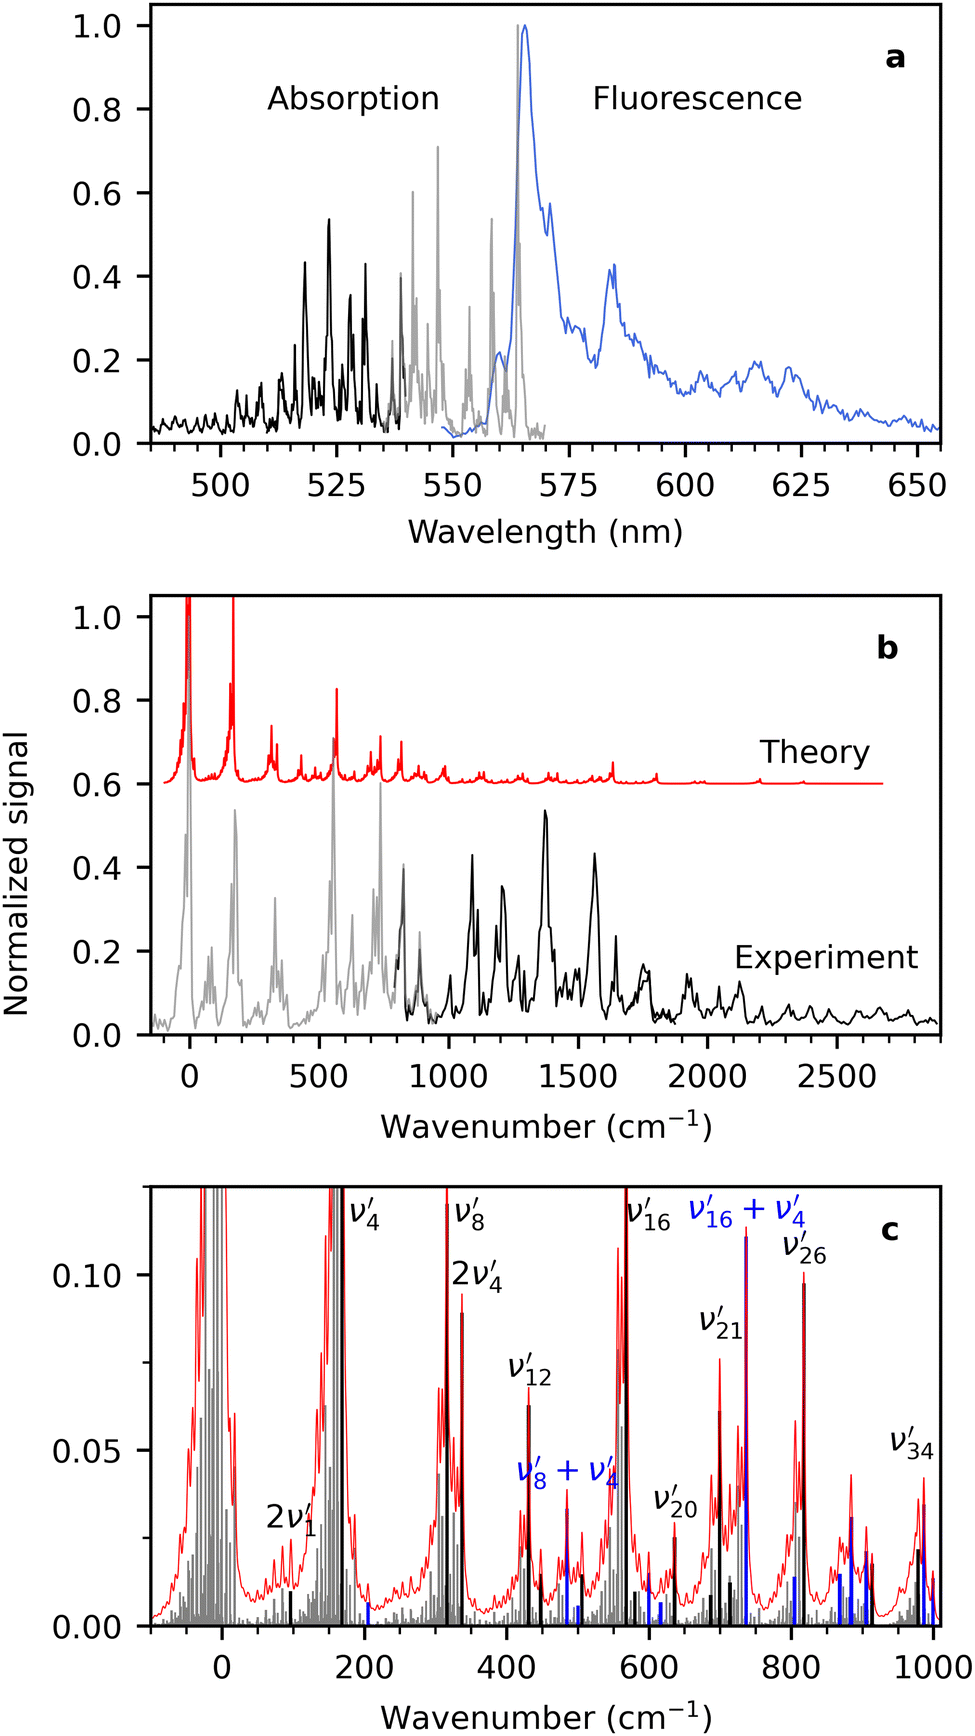 | ||
| Fig. 2 (a) Fluorescence-excitation (absorption) and dispersed-fluorescence spectra of R− measured at 100 K. The former was measured using two different notch filters: the grey spectrum (535–570 nm) was obtained from collecting emitted photons with wavelengths above 600 nm and the black spectrum (485–540 nm) from photons with wavelengths above 550 nm. The dispersed fluorescence spectrum is shown in blue. The excitation wavelength was 531.3 nm, and the laser power was <0.3 mW. (b) Comparison of experimental (black and grey) and simulated (red) absorption spectra at 100 K. The maximum of each spectrum is used as the zero point for the energy axis. The simulated spectrum is shown with an offset to improve readability. (c) All transitions (grey) contributing to the total simulated absorption spectrum (red). The black transitions are significant transitions from the vibrational ground state (0′′) to the final state indicated by the labels. Blue transitions involve combinations of two or more of the black transitions. Assignments of additional transitions are shown in Fig. S2 in the ESI.† | ||
At the cost of saturating the main absorption band, an elevated laser power (<0.1 mW) was used to enhance less intense transitions. A spectrum obtained with lower laser power (<0.01 mW) is shown in the ESI† (Fig. S1). In that spectrum the maximum of the second highest peak (at 546.8 nm) is approximately 30% of the main band maximum. This is in reasonable agreement with the mirror image rule as the maximum of the second band in the fluorescence spectrum is around 40%. The mirror image rule states that the emission spectrum is a mirror image of the S0–S1 absorption spectrum.
Previous work focused on the emission by R−, and how the dispersed fluorescence spectrum changes upon cooling.25 It was found that the spectrum narrows, and the maximum blueshifts from 569 ± 1 nm at room temperature24 to 565.5 ± 0.5 nm at 100 K.25 The effects were attributed to lower vibrational frequencies in S1 compared to S0, and that vibrational excited levels in S1 are populated. As the vibrational frequencies are smaller in S1 than in S0, the average energy of emitted photons from Δν = 0 transitions decreases with increasing temperature.25 Greisch et al.27 also observed the same effects (narrower bands and blueshifted emission) upon cooling rhodamine dyes.
A simulated Franck–Condon absorption spectrum obtained using B3LYP/aug-cc-pVTZ time-dependent density functional theory (TD-DFT) is shown in Fig. 2(b) together with the experimentally obtained spectrum. Both spectra are shifted to have band maximum at the origin for better comparison as the calculations overestimate the absorption-band maximum by ∼2700 cm−1 (0.33 eV). The simulations capture several features, especially in the lower energy regions (0–1000 cm−1). Transitions giving rise to the simulated spectrum are shown in Fig. 2(c), and some of the dominant transitions are assigned. Additional assignments are shown in the ESI† (Fig. S2). Three important Franck–Condon active modes (4, 8, 16) are all in-plane vibrations (Fig. 3) that preserve the mirror-plane symmetry of the aromatic rings. Previously, in the fluorescence spectra of R−, the Δν = +1 transitions from these vibrations were also found to dominate.25 The largest discrepancy is observed for the 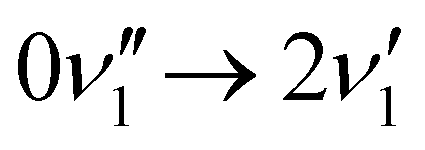 peak, which shows significantly less intensity compared with the experimental spectrum. This indicates that the frequency change of ν1 between S0 and S1 is larger than computationally predicted. It should be mentioned that as ν1 is an out-of-plane mode (Fig. 3), the
 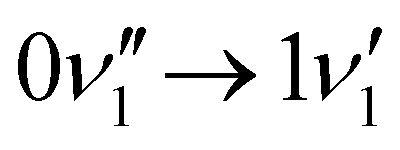 transition is symmetry forbidden. Towards higher energies (from approximately 1000 cm−1 and up) the calculations predict too small intensities, which likely reflects a too small geometry change between S0 and S1 optimized geometries.
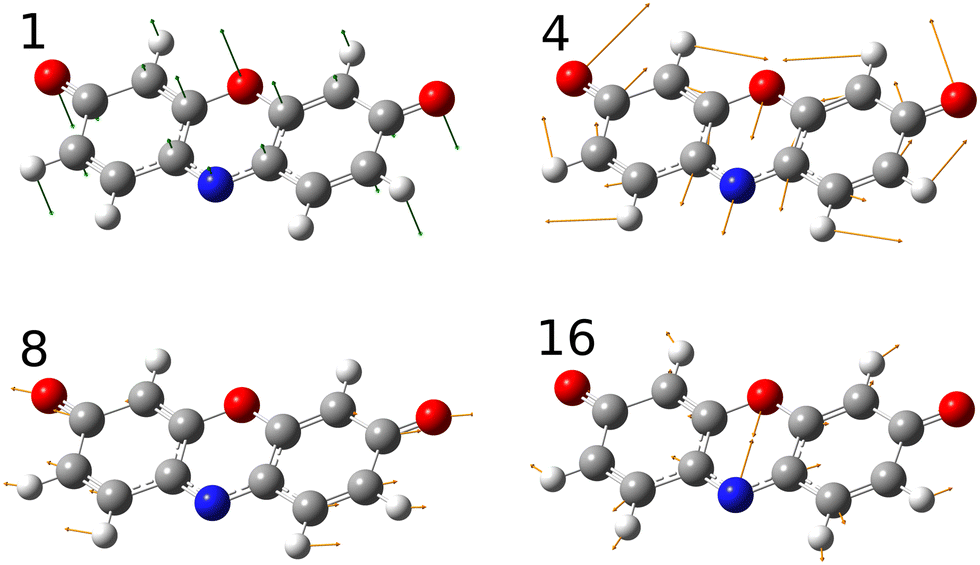 | ||
| Fig. 3 Important vibrational modes that couple with the electronic transition. Mode 1 is an out-of-plane vibration whereas modes 4, 8 and 16 are in-plane vibrations. | ||
A zoom in on the experimentally obtained main absorption band reveals two additional peaks at lower energies with an energy separation of around 15.0 cm−1 (Fig. 4(a)). At T = 100 K, excited states of the lowest frequency vibrational modes are thermally populated. If the frequency of these modes do not change between S0 and S1, the thermal transition with Δν = 0 will coincide with the 0′′ → 0′ transition (main peak). Calculations establish that transitions involving ν1 and ν2 (both out-of-plane modes) are the dominant modes to produce the observed structure in Fig. 4(b). Transitions involving both ν3 and ν5 also contribute to the structure. Based on the simulation, the experimentally observed progression is assigned to three Δν = 0 transitions, that is, the 0′′ → 0′, 1′′ → 1′ and 2′′ → 2′ of the ν1 vibrational mode. The intensity pattern, which is governed by the Boltzmann population, supports this. We believe that the 1′′ → 1′ transition of the ν2 mode ( label) is likely part of the peak observed for the 0′′ → 0′ transition. The energy separation of the three Δν = 0 transitions of the same mode is a direct observable of the difference in vibrational frequencies between S1 and S0. This difference also accounts for the blueshift observed in fluorescence-band maxima upon cooling as already mentioned. If the spectra were recorded at 10 K, the above discussed progressions would not be visible, and one would lose the information of the frequency change between S0 and S1. As predicted from the intensity discrepancy between theory and experiment for the
  peak in Fig. 2, the observed frequency change of ν1 between S0 and S1 is indeed larger than computationally predicted (∼15 cm−1vs. ∼11 cm−1).
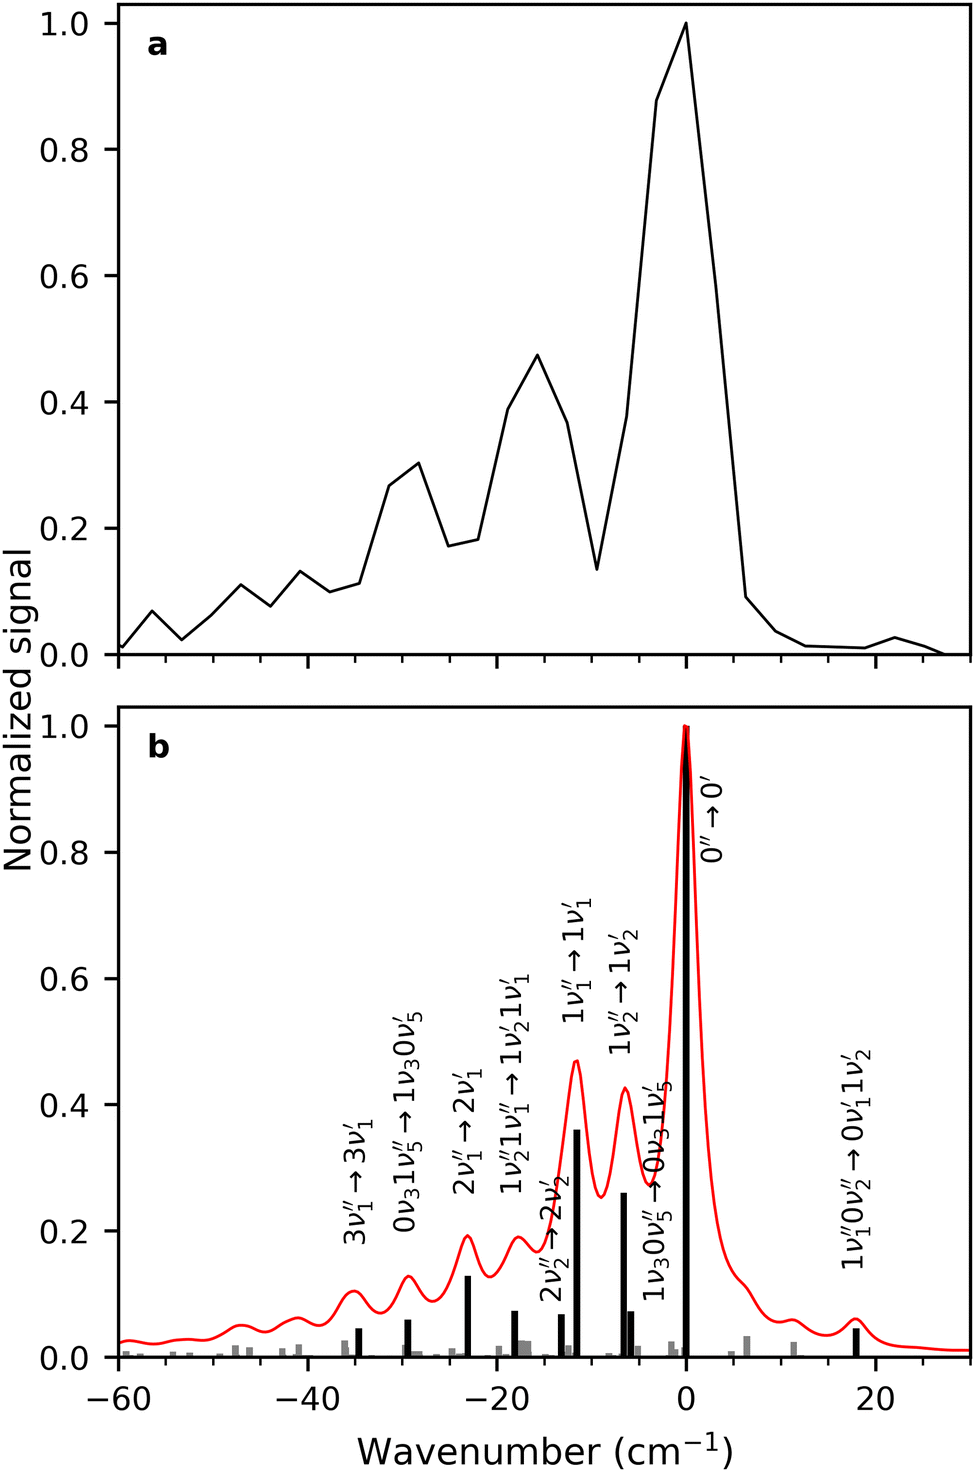 | ||
| Fig. 4 (a) Zoom in on the main absorption band in the fluorescence-excitation spectrum of R−. The energy separations between the peaks are approximately 15 cm−1. (b). Simulated absorption spectrum of R− at a temperature of 100 K (red) from the transitions shown in grey (no labels) and black. The vibrational quantum number is followed by the name of the mode and ′′ refers to S0 and ′ to S1. | ||
In previous room-temperature measurements, we obtained a photodissociation action spectrum of R−.24 Dissociation was a result of three-photon absorption, which implies that the spectral shape does not necessarily reflect the one-photon absorption spectrum. Indeed, the spectrum is very broad with significant absorption in the entire region 470–600 nm. However, the room-temperature band maximum at 563 nm coincides with the present band maximum at 100 K.
Next, we turn our attention to the cations. Absorption spectra of Ox-170+ and DR+ are shown in blue in Fig. 5 together with their respective dispersed-fluorescence spectra. To facilitate comparison, the same energy range (not wavelength range) is used for both. The absorption-band maximum of Ox-170+ is at 583.2 ± 0.1 nm and the fluorescence-band maximum at 584.2 ± 0.3 nm while in the case of DR+, the band maxima are 543.4 ± 0.3 nm and 543.8 ± 0.3 nm, respectively. As seen for R−, the fluorescence spectra are more congested than the absorption spectra. For example, for Ox-170+, the main fluorescence band has a shoulder separated by 274 cm−1 (at around 595 nm), whereas the absorption spectrum shows a resolved band 254 cm−1 from the main band (at 575 nm). The second most intense band in the fluorescence spectrum is located 588 cm−1 from the main band, and the corresponding band in the absorption spectrum consists of three peaks with maximum intensity at an energy distance of 593 cm−1. To resolve vibrational peaks in the absorption spectra, the laser power was kept high at the cost of saturation of the main absorption bands. When using less laser power to obtain the Ox-170+ spectrum, the intensity of the second most prominent band is only 50% of the main band's intensity, similar to what we see in the fluorescence spectrum (see Fig. S3 in the ESI†). Despite the slightly more congested fluorescence spectra and saturation of the main absorption bands, it is evident for both ions that the absorption and fluorescence spectra display many of the same features.
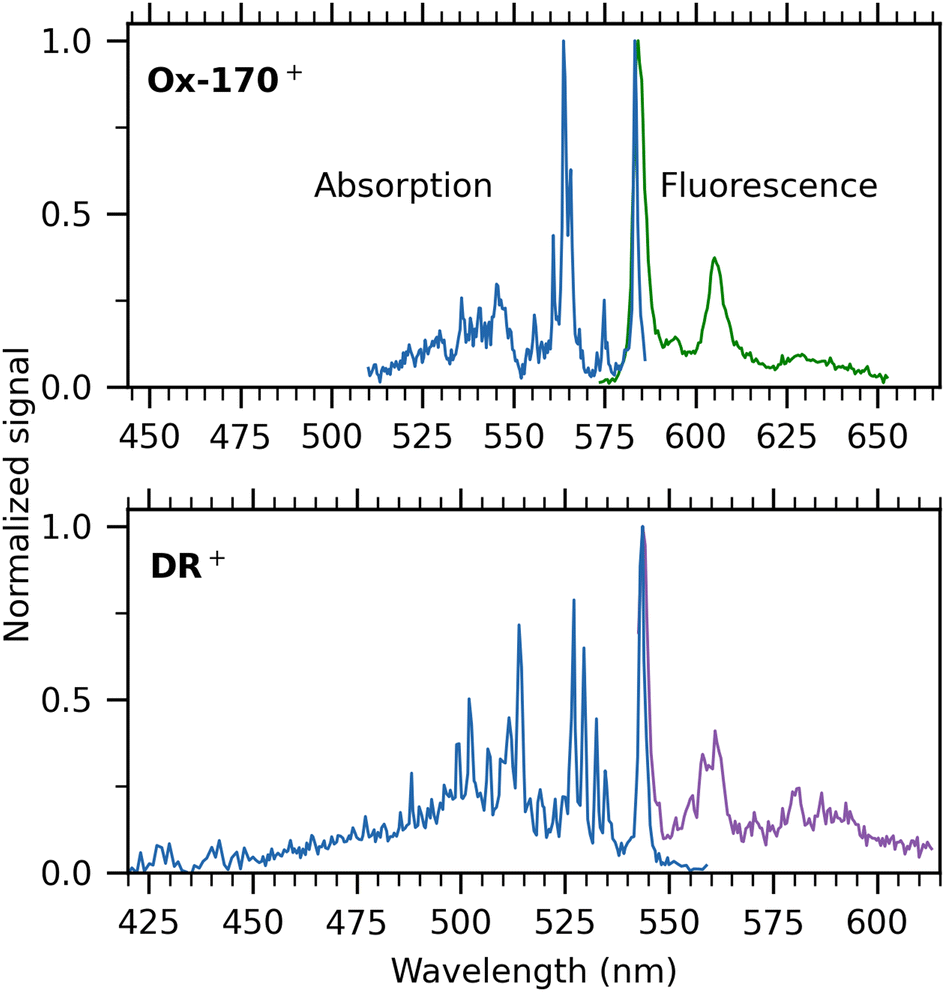 | ||
| Fig. 5 100 K absorption spectra (blue) based on fluorescence-excitation experiments and dispersed-fluorescence spectra of gaseous Ox-170+ (top) and DR+ (bottom). The same energy range has been used for both spectra to enable easy comparison of the widths of the spectra. Excitation wavelengths to measure fluorescence spectra were 561 nm (Ox-170+) and 532 nm (DR+). The main absorption bands are saturated resulting in an incorrect intensity relation between the main band and the rest of the spectrum. The relatively high laser power (<0.1 mW) was used to enable measurement of the vibrational structure. | ||
The Stokes shifts of DR+ and Ox-170+ are very small (<30 cm−1), which indicates a rigid geometry that does not change noteworthily between the electronic ground and excited state. We note that small Stokes shifts are sensitive to excitation energies. For example, the fluorescence spectrum of DR+ has been obtained after excitation with 532 nm light and 514 nm light, which results in a small difference in the fluorescence band maxima (0.7 nm) due to heating. This gives rise to more than a doubling of the Stokes shift from 14 cm−1 to 37 cm−1. The Stokes shifts measured for the oxazines are similar to those for rhodamine cations (17–25 cm−1)26 but smaller than those for fluorone anions and that for the dimethyl-oxyluciferin anion; in the latter case the shift is an order of magnitude larger (360 cm−1)14 Both absorption and fluorescence spectra of rhodamine cations are, however, much less well-resolved than those of oxazines, which is likely associated with differences in the importance of low frequency modes.
DR+ exhibits a broader profile in both absorption and fluorescence compared to Ox-170+, which was also observed in room-temperature fluorescence spectra.15,16 Jockusch and co-workers16 found DR+ to be an outlier in their (TD-)DFT calculations on four oxazines as they had to use another functional (B3LYP) than used for three other oxazines (TPSS) to obtain optimized geometries. Their calculations found indications of increased triplet crossing yields for DR+ compared to other oxazines, which agrees with a lower fluorescence quantum yield in solution relative to the quantum yields of similar oxazines. However, their computations could not account for the broader emission profile.
Only one of the seven oxazines, DR+, contains an amide group, which implies that an important resonance form locates positive charge on the amide nitrogen and negative charge on the amide oxygen. The other nitrogen therefore carries most of the excess positive charge. In other words, the charge distribution is more asymmetric than for the other ions, and the transition is likely to be more charge transfer in character. According to TD-DFT (B3LYP) calculations by Fleming et al.,28 the transition-dipole moments of all the oxazines are consistent with a charge-transfer nature of the excitation, but DR+ exhibits a significantly larger gas-phase ground-state dipole moment (8.35 Debye) compared to the other dyes (2.27–3.72 Debye).
It is non-trivial to predict transition energies for this kind of systems. Indeed, we predict the transition energy (adiabatic) of R− to be too high in energy by 0.33 eV. This is the smallest of the studied oxazines, which emphasizes the problem. The use of TD-DFT to predict charge-transfer states has been widely discussed29–34 and is known to systematically overestimate the lowest electronic singlet excitation energy for similar dyes (cyanines, BODIPYs, rhodamines). This is often referred to as the cyanine problem.35,36 Also, absorption- and fluorescence-band maxima are highly dependent on the choice of DFT functional as recently demonstrated by Kappes and co-workers8 in the case of the rhodamine-B cation. Despite these known issues related to TD-DFT, the vibronic band structure of R− can be simulated well enough to interpret the experimental spectrum due to its relatively rigid structure. In the lower-energy region, the intensity of the vibronic bands is reproduced reasonably well, but the accuracy decreases with increasing energy.
Cryogenic gas-phase fluorescence spectra of all seven oxazines are summarized in Fig. 6. Cold spectra of Ox-4+ and R− were measured previously with another spectrometer and grating25,37 and are in accordance with the spectra presented here (see Fig. S4, ESI† for comparison of spectra obtained with the two spectrometers). Generally, the emission profiles are very similar: all spectra show a main band with FWHM in the range between 100 and 200 cm−1 and a second band with an intensity of approximately 20–50% compared to the main band. The energy separations between the two bands are in the range 550–610 cm−1. They either exhibit a shoulder on the main band (Ox-1+, R−, Ox-4+ and DR−) or a resolved peak (NB+, Ox-170+) at around 275 cm−1 from the main fluorescence-band maximum.
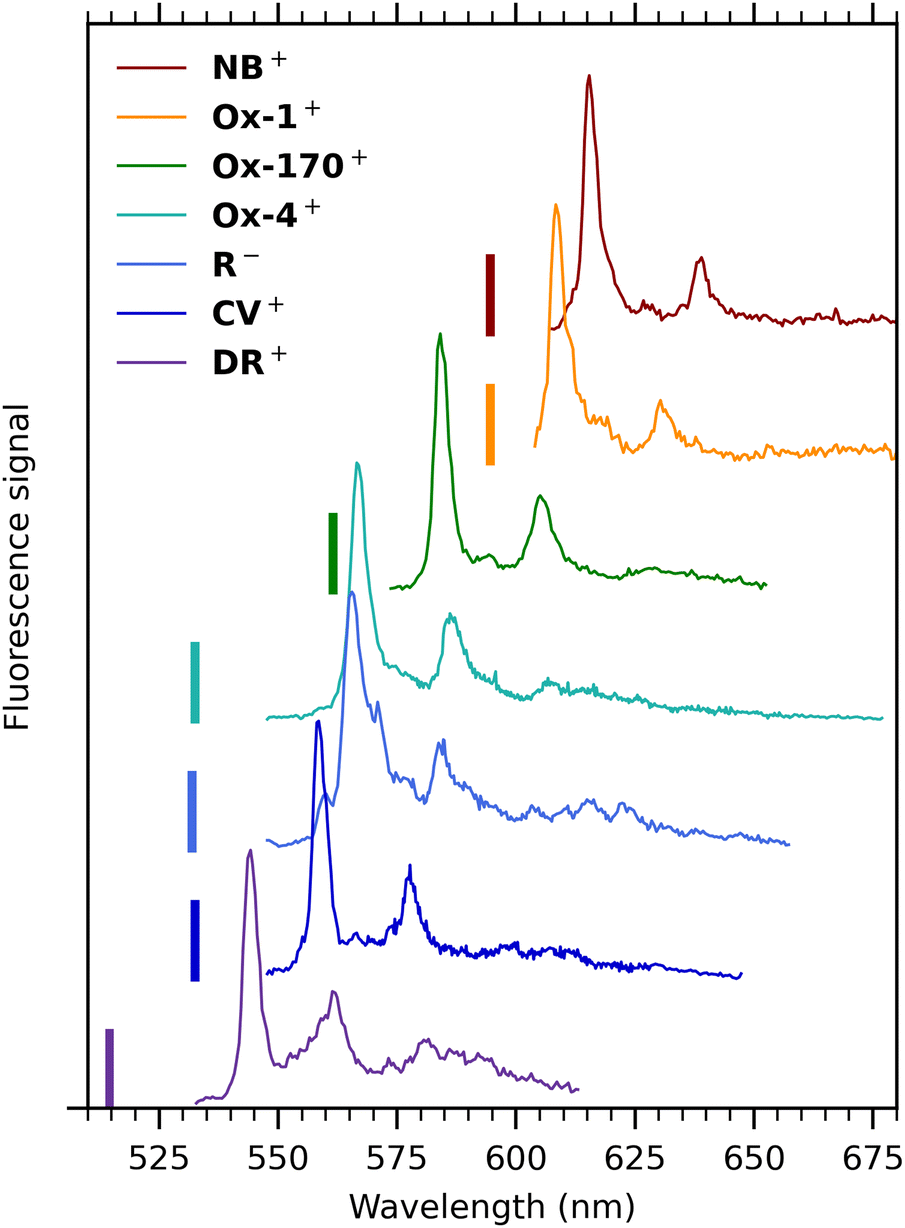 | ||
| Fig. 6 Dispersed-fluorescence spectra of seven oxazine ions isolated in vacuo measured at cryogenic temperature (100 K). Excitation wavelengths are indicated by vertical bars, and they were 514 (DR+), 531.3 nm (R−), 532 nm (CV+, Ox-4+), 561 nm (Ox-170+) and 594 nm (Ox-1+, NB+). The spectrum of DR+ is obtained with a lower excitation wavelength than the spectrum in Fig. 4(b) to avoid cutting off part of the main band by the notch filter. | ||
Computational work by Jockusch and co-workers16 assigned the most intense band to the 0′ → 0′′ transition. They also concluded that the second most intense band results from the sum of many vibronic modes rather than a simple vibronic progression. The spectrum of DR+ seems similar to the others at first glance but has a broader profile and an additional broad band further to the red.
The general resemblance between the fluorescence spectra in Fig. 6 indicates that the fluorescence profile is not significantly influenced by the specific substituents and their positions. But fluorescence-band maxima are not surprisingly affected and vary between 544 nm (DR+) and 615 nm (NB+). The highest value observed for DR+ is in accordance with the reduced electron delocalization due to the partially positive charge on the amide nitrogen, an effect that here seems more important than redshifts typically experienced for charge-transfer transitions. Band maxima are listed in Table 1.
| NB+ | Ox-1+ | Ox-170+ | Ox-4+ | CV+ | DR+ | R− | |
|---|---|---|---|---|---|---|---|
| Absorption λmax | 583.2 ± 1 | 543.4 ± 3 | 563.9 ± 1 | ||||
| Fluorescence λmax | 615.4 ± 3 | 608.5 ± 4 | 584.2 ± 3 | 566.8 ± 4 | 558.6 ± 5 | 543.8 ± 3 | 565.5 ± 5 |
| Stokes shift | 29 | 14 | 50 |
We also did calculations of vertical S0 → S1 excitation energies at the B3LYP/aug-cc-pVTZ level of theory (Table S2, ESI†) for all ions under study. The values are blueshifted 0.4–0.5 eV from the fluorescence-band maxima (Fig. 6), which is significant considering the minor Stokes shifts (<6 meV). Maybe more importantly, the trend is not the same as the experimental one; NB+ < Ox-1+ < Ox-170+ < DR+ < CV+ < Ox-4+ < R− (theory) vs.NB+ < Ox-1+ < Ox-170+ < Ox-4+ < R− < CV+ < DR+ (experiment). Calculated vertical excitation energies with M06-2X and WB97XD for DR+, CV+, and NB+ are shifted an additional 0.2 eV to the blue and are thus even further from the experimental values.
Compared to previous room-temperature measurements,15,16,24 the cold-ion spectra are generally narrower, and the maxima are blueshifted by 4–7 nm, corresponding to 125–215 cm−1. As mentioned earlier, this temperature effect was examined in detail in case of R− and is caused by population of vibrationally excited levels in S1, and that frequencies are generally lower in S1 than in S0.25 Room-temperature fluorescence spectra obtained with LUNA38 are shown together with cold-ion spectra in the ESI† (Fig. S5 and S6).
Experimental and computational details
Samples of oxazines were purchased from Sigma-Aldrich (cresyl violet, nile blue, oxazine 170, darrow red and resorufin), NordicBioSite (oxazine 1) and TCI chemicals (oxazine 4). The samples were dissolved in methanol and electrosprayed.The instrument (LUNA2) for measuring fluorescence from mass-selected ions isolated in vacuo has been described in detail previously.14,37 Ions are accumulated in an octopole ion trap and guided to a cylindrical Paul trap every 50 ms (20 Hz). The end-cap electrodes of the trap are in direct thermal contact with a copper container filled with liquid nitrogen. The ions cool in collisions with helium buffer gas at an estimated pressure of 0.01–0.1 mbar inside the trap for at least 35 ms before laser irradiation. A 20 Hz, frequency-tripled, Q-switched Nd:YAG laser (EKSPLA) pumps an optical parametric oscillator to produce visible light in the range 420–709 nm. The laser beam is guided through a small hole in the cylindrical electrode of the trap and overlapped with the ion cloud. The trap is emptied after 500 cycles of laser irradiation, but mass selection is done before every laser shot. However, it is worth to mention that we are blind to photo-isomerization. Hence if photo-isomers are produced, they will contribute to both absorption and fluorescence spectra if they absorb at the excitation wavelength and are fluorescent. In case of dispersed-fluorescence spectra, the fluorescence is measured using a Kymera 328i spectrometer with an intensified CCD (iCCD) camera. The signal is intensified for 100 ns after laser irradiation. The laser light is filtered using a notch filter (Thorlabs). In case of fluorescence-excitation spectra, the fluorescence is monitored using a photomultiplier tube (PMT), and laser light is filtered away using four long-pass filters (Thorlabs). The signal is corrected for changes in laser power by measuring the laser power at every laser shot using a photodiode. The laser power is kept below 0.1 mW in case of fluorescence-excitation measurements and 0.1–0.5 mW in case of dispersed fluorescence.
All presented calculations were performed with the Gaussian16 program package.39 Electronic S0 and S1 optimizations and frequency calculations of R− were performed with B3LYP/aug-cc-pVTZ,40,41 with the S1 calculations based on time-dependent density functional theory. The absorption spectrum was calculated at T = 100 K with the Franck–Condon–Herzberg–Teller (FCHT) method described in ref. 42 and 43. This methodology includes Duschinsky mixing of the normal coordinates in S0 and S1.44 The number of thermally populated states was limited to states with a Boltzmann weight of more than 0.1%, relative to that of the vibrational ground state in S0 (keywords; Temperature=(Value=100.0,MinPop=0.001) & MaxStatesI=300). For R− a temperature of 100 K is used; this corresponds to a total of 117 populated states and a population that is converged to better than 95%. In comparison, to calculate a spectrum at 300 K with a converge population to better than 95% requires 2.7 × 10⁸ states – clearly unfeasible with conventional state-to-state calculations. The assigned transitions were limited to transitions with at least 0.1% intensity of the strongest transition, 0′′ → 0′ (keyword, Print=(Spectra=All, Matrix=JK,AssignThresh=0.001)).
We have previously used a home-built Franck–Condon model to calculate both cold and warm emission spectra of R−.22 Using an effective sampling of the thermal population the model could account for the high number of transitions at elevated temperatures but did not include Duschinsky mixing. The spectra presented in our earlier publication are similar to the ones calculated here; however, the latter are more accurate due to the inclusion of Duschinsky mixing.22
Excited-state optimizations of the cations were attempted with B3LYP, M06-2X and wB97XD, in conjunction with the aug-cc-pVTZ basis set, but without successful converge for all cations with the same DFT method.
Conclusions
In summary, we have reported on the intrinsic photophysical properties of oxazine dyes at cryogenic temperatures. Based on fluorescence-excitation measurements we have provided vibrationally resolved electronic absorption spectra of three oxazines and partially resolved dispersed-fluorescence spectra of seven oxazines. The emission spectra are more congested as the ions are heated by the excess energy of the absorbed laser photon. Stokes shifts are small (less than or about 50 cm−1) which indicates minor differences between geometries in S0 and S1.Based on a calculated Franck–Condon spectrum of R−, we have assigned important vibrations that couple with the electronic excitation. These vibrational modes include in-plane and out-of-plane vibrations and coincide with the modes relevant for the S1 → S0 transition identified in previous work.
One of the oxazine cations, DR+, stands out from the others with broader absorption and emission profiles. This peculiarity, likely arising from a more asymmetric charge distribution compared to its counterparts, remains unaccounted for in computational models. The spectra provided in this work are valuable benchmarks for theoretical endeavours, addressing the challenge of predicting excitation energies of oxazines and other structurally similar dyes.
Conflicts of interest
There are no conflicts to declare.Acknowledgements
The authors thank The NOVO Nordisk Foundation (grant numbers NNF20OC0064958 and NNF22OC0080193) for financial support and the High Performance Computer Centre at the University of Copenhagen for support.References
- O. V. Boyarkin, Int. Rev. Phys. Chem., 2018, 37, 559–606 Search PubMed.
- W. Zagorec-Marks, M. M. Foreman, J. R. R. Verlet and J. M. Weber, J. Phys. Chem. Lett., 2019, 10, 7817–7822 Search PubMed.
- S. Warnke, A. Ben Faleh, R. P. Pellegrinelli, N. Yalovenko and T. R. Rizzo, Faraday Discuss., 2019, 217, 114–125 RSC.
- F. S. Menges, E. H. Perez, S. C. Edington, C. H. Duong, N. Yang and M. A. Johnson, J. Am. Soc. Mass Spectrom., 2019, 30, 1551–1557 CrossRef CAS PubMed.
- P. Nieto, D. Müller, A. Sheldrick, A. Günther, M. Miyazaki and O. Dopfer, Phys. Chem. Chem. Phys., 2018, 20, 22148–22158 RSC.
- G. Féraud, C. Dedonder-Lardeux, C. Jouvet and E. Marceca, J. Phys. Chem. A, 2016, 120, 3897–3905 CrossRef PubMed.
- K. Hirata, K. Kasai, G. Grégoire, S. Ishiuchi and M. Fujii, J. Chem. Phys., 2021, 155, 151101 CrossRef CAS PubMed.
- S. Debnath, A. Schäfer, K. A. Haupa, D. Strelnikov, J. Roithová, J. Jašík, S. Lebedkin and M. M. Kappes, Mol. Phys., 2023 DOI:10.1080/00268976.2023.2223072.
- E. K. Ashworth, J. Langeland, M. H. Stockett, T. T. Lindkvist, C. Kjær, J. N. Bull and S. Brøndsted Nielsen, J. Phys. Chem. A, 2022, 126, 9553–9563 CrossRef CAS PubMed.
- S. M. J. Wellman and R. A. Jockusch, J. Phys. Chem. A, 2015, 119, 6333–6338 CrossRef CAS PubMed.
- J. A. Wyer, in Photophysics of Ionic Biochromophores, ed. S. Brøndsted Nielsen and J. A. Wyer, Springer, Berlin, Heidelberg, 2013, pp. 21–44 Search PubMed.
- E. K. Campbell, M. Holz, D. Gerlich and J. P. Maier, Nature, 2015, 523, 322–323 CrossRef CAS PubMed.
- Q. Bian, M. W. Forbes, F. O. Talbot and R. A. Jockusch, Phys. Chem. Chem. Phys., 2010, 12, 2590–2598 RSC.
- J. Langeland, N. F. Christensen, E. Vogt, C. Kjær, T. T. Lindkvist, S. Brøndsted Nielsen and H. G. Kjaergaard, J. Phys. Chem. Lett., 2023, 14, 5949–5954 CrossRef CAS PubMed.
- C. Kjær and S. Brøndsted Nielsen, Phys. Chem. Chem. Phys., 2019, 21, 4600–4605 RSC.
- M. Kusinski, J. Nagesh, M. Gladkikh, A. F. Izmaylov and R. A. Jockusch, Phys. Chem. Chem. Phys., 2019, 21, 5759–5770 RSC.
- M. H. Stockett, J. Houmøller and S. Brøndsted Nielsen, J. Chem. Phys., 2016, 145, 104303 CrossRef CAS PubMed.
- G. Clark and Biological Stain Commission, in Staining procedures, ed. G. Clark, Published for the Biological Stain Commission by Williams & Wilkins, c1981., Baltimore, 4th edn, 1981 Search PubMed.
- H. Ju, Y. Ye and Y. Zhu, Electrochim. Acta, 2005, 50, 1361–1367 CrossRef CAS.
- S. F. Lee, Q. Vérolet and A. Fürstenberg, Angew. Chem., Int. Ed., 2013, 52, 8948–8951 CrossRef CAS PubMed.
- S. Pampín-Suárez, J. L. Arce-Diego, O. Tapia, F. M. Pérez-Campo, J. C. Rodríguez-Rey and F. Fanjul-Vélez, Biomed. Opt. Express, 2022, 13, 197 CrossRef PubMed.
- J. Jose and K. Burgess, Tetrahedron, 2006, 62, 11021–11037 CrossRef CAS.
- S. J. Isak and E. M. Eyring, J. Phys. Chem., 1992, 96, 1738–1742 CrossRef CAS.
- C. Kjær, S. Brøndsted Nielsen and M. H. Stockett, Phys. Chem. Chem. Phys., 2017, 19, 24440–24444 RSC.
- E. Vogt, J. Langeland, C. Kjær, T. T. Lindkvist, H. G. Kjaergaard and S. Brøndsted Nielsen, J. Phys. Chem. Lett., 2021, 12, 11346–11352 CrossRef CAS PubMed.
- C. Kjær, A. Vu-Phung, T. T. Lindkvist, J. Langeland and S. Brøndsted Nielsen, Chem. – Eur. J., 2023, 29, e202302166 CrossRef PubMed.
- J.-F. Greisch, M. E. Harding, M. Kordel, W. Klopper, M. M. Kappes and D. Schooss, Phys. Chem. Chem. Phys., 2013, 15, 8162–8170 RSC.
- S. Fleming, A. Mills and T. Tuttle, Beilstein J. Org. Chem., 2011, 7, 432–441 CrossRef CAS PubMed.
- D. J. Tozer and N. C. Handy, J. Chem. Phys., 1998, 109, 10180–10189 CrossRef CAS.
- L. Goerigk and S. Grimme, J. Chem. Phys., 2010, 132, 184103 CrossRef.
- L. Goerigk, J. Moellmann and S. Grimme, Phys. Chem. Chem. Phys., 2009, 11, 4611–4620 RSC.
- D. Jacquemin, E. A. Perpète, I. Ciofini, C. Adamo, R. Valero, Y. Zhao and D. G. Truhlar, J. Chem. Theory Comput., 2010, 6, 2071–2085 CrossRef CAS PubMed.
- D. Jacquemin, V. Wathelet, E. A. Perpète and C. Adamo, J. Chem. Theory Comput., 2009, 5, 2420–2435 CrossRef CAS PubMed.
- M. R. Silva-Junior, M. Schreiber, S. P. A. Sauer and W. Thiel, J. Chem. Phys., 2008, 129, 104103 CrossRef PubMed.
- P. Zhou, Int. J. Quantum Chem., 2018, 118, e25780 CrossRef.
- B. Moore II, R. L. Schrader, K. Kowalski and J. Autschbach, ChemistryOpen, 2017, 6, 385–392 CrossRef PubMed.
- C. Kjær, J. Langeland, T. T. Lindkvist, E. R. Sørensen, M. H. Stockett, H. G. Kjaergaard and S. Brøndsted Nielsen, Rev. Sci. Instrum., 2021, 92, 033105 CrossRef PubMed.
- M. H. Stockett, J. Houmøller, K. Støchkel, A. Svendsen and S. Brøndsted Nielsen, Rev. Sci. Instrum., 2016, 87, 53103 CrossRef PubMed.
- M. J. Frisch, G. W. Trucks, H. B. Schlegel, G. E. Scuseria, M. A. Robb, J. R. Cheeseman, G. Scalmani, V. Barone, G. A. Petersson, H. Nakatsuji, X. Li, M. Caricato, A. V. Marenich, J. Bloino, B. G. Janesko, R. Gomperts, B. Mennucci, H. P. Hratchian, J. V. Ortiz, A. F. Izmaylov, J. L. Sonnenberg, D. Williams-Young, F. Ding, F. Lipparini, F. Egidi, J. Goings, B. Peng, A. Petrone, T. Henderson, D. Ranasinghe, V. G. Zakrzewski, J. Gao, N. Rega, G. Zheng, W. Liang, M. Hada, M. Ehara, K. Toyota, R. Fukuda, J. Hasegawa, M. Ishida, T. Nakajima, Y. Honda, O. Kitao, H. Nakai, T. Vreven, K. Throssell, J. J. A. Montgomery, J. E. Peralta, F. Ogliaro, M. J. Bearpark, J. J. Heyd, E. N. Brothers, K. N. Kudin, V. N. Staroverov, T. A. Keith, R. Kobayashi, J. Normand, K. Raghavachari, A. P. Rendell, J. C. Burant, S. S. Iyengar, J. Tomasi, M. Cossi, J. M. Millam, M. Klene, C. Adamo, R. Cammi, J. W. Ochterski, R. L. Martin, K. Morokuma, O. Farkas, J. B. Foresman and D. J. Fox, Wallingford, CT, 2016.
- A. Becke, J. Chem. Phys., 1993, 98, 5648–5652 CrossRef CAS.
- R. J. Kendall, R. A. Dunning Jr and T. H. Harrison, J. Chem. Phys., 1992, 96, 6796–6806 CrossRef CAS.
- F. Santoro, A. Lami, R. Improta, J. Bloino and V. Barone, J. Chem. Phys., 2008, 128, 224311 CrossRef PubMed.
- G. Pöschl and E. Teller, Z. Phys. Chem., 1933, 21, 410–446 Search PubMed.
- F. Duschinsky, Acta Physicochim. URSS, 1937, 7, 551–566 Search PubMed.
Footnote |
| † Electronic supplementary information (ESI) available: Fluorescence-excitation spectrum of R− and Ox-170+ at low laser power. Comparison of fluorescence spectra obtained at 100 K and at room temperature of all cations in the study. Comparison of fluorescence spectra obtained using different spectrometers. Calculated frequencies of R− in S0 and S1 and calculated vertical excitation energies for all seven ions. See DOI: https://doi.org/10.1039/d3cp04615j |
| This journal is © the Owner Societies 2023 |