 Open Access Article
Colloidal quantum dot chains: self-assembly mechanism and ratiometric fluorescent sensing†
Qin
Sun
abc,
Liang
Yang
abc,
Lei
Su
abc,
Weikang
Liu
a,
Yifan
Wang
a,
Shaoming
Yu
b,
Changlong
Jiang
 *abc and
Zhongping
Zhang
acd
aCAS Center for Excellence in Nanoscience, Institute of Intelligent Machines, Chinese Academy of Sciences, Hefei, Anhui 230031, China. E-mail: cljiang@iim.ac.cn
bDepartment of Chemistry, University of Science and Technology of China, Hefei, Anhui 230036, China
cState Key Laboratory of Transducer Technology, Chinese Academy of Sciences, Hefei, Anhui 230031, China
dSchool of Chemistry and Chemical Engineering, Anhui University, Hefei, Anhui 230601, China
First published on 23rd November 2017
Abstract
Precise control of the size, shape, and composition of nanocrystals will be required to fully explore and utilize unique properties of nanomaterials with a broad range. In this manuscript we have designed colloidal QD chains, using carboxyl-modified red fluorescent cadmium telluride (CdTe), which were self-assembled by the mediation of trithiocyanuric acid (TTCA). Furthermore, a ratiometric fluorescent sensor with dual-emissions was constructed by mixing the QD chains with blue fluorescent carbon dots (CDs) for the visual ultrasensitive detection of As(III) in environmental water. In the process of As3+ detection, it could react with the third sulfydryl, which resulted in the agglomeration of QD chains and quenching of the red emission of the QDs, while the blue fluorescent CDs were insensitive to the analyte. So the variation of fluorescence intensity ratios produces an obvious change of the fluorescence color from fushia to blue, which can be conveniently observed by the naked eye under a UV lamp without any complicated instrumentation. The LOD of this ratiometric fluorescent probe could reach as low as 1 ppb, which is much lower than the maximum level of 10 ppb As3+ in drinking water stipulated by WHO. Following the sensing mechanism, a paper-based sensor has been prepared by printing the ratiometric probe on filter paper, which provides a convenient and simple approach for the visual detection of As3+. Therefore, the very simple and effective strategy reported here could be extended to the visual detection of a wide range of analytes in the environment by the construction of highly efficient ratiometric nanoprobes.
Introduction
Inspired by recent impressive development in colloidal synthesis and assembly mechanism, the past few decades have witnessed the emergence of a general synthetic strategy for sculpting inorganic solid units into functional nanomaterials with unprecedented physical and chemical properties compared with their bulk counterparts.1–3 Precise control of size, shape, and composition of nanocrystals will be required to fully explore and utilize optical,4,5 electronic,6 magnetic,7 and catalytic properties8 of nanomaterials with a broad range. In the case of semiconductor quantum dots (QDs), the relation between the geometry and the electronic structure is encoded in quantum confinement: the nanocrystal surface serves as a boundary to confine the electron and hole wave functions.9–11 The control over size and shape of quantum-confined QDs might obtain function nanomaterials with desired optical and other properties.Self-assembly of nanocrystal (NC) building blocks into mesoscopic superstructures with well-defined symmetry and geometry has proved to be essential for creating new materials with rationally designed structures and novel properties.12 Despite the tremendous progress in colloidal assembly, it still remains a fundamental challenge to assemble isotropic spherical NCs into one-dimensional (1D) ordered superstructures. The assembly challenges related with 1D NC ordered superstructures are mainly because of the lack of directional interactions arising from the isotropic nature of spherical NCs. As a result, external assistance is usually needed in order to achieve linear organization of NCs.13 Over the past few years, much effort has been devoted to explore the anisotropic assembly of NCs, aiming to develop a general approach that enables the 1D organization of colloidal NCs over long distances.1,14 It has been reported that the intrinsic magnetic-dipole moment is capable of inducing the linear assembly of NCs in the presence of a magnetic field, yet this strategy is only applicable to certain types of magnetic NCs.15,16 The linear arrangement of NCs can also be realized with the aid of templates such as lithographically patterned surfaces and rolled sheets.17–19 However, these methods usually suffer from either low yields or short-range NC ordering. On this point, great efforts have been made to precise engineer the structure of nanocrystals, so as to generate targeted structures with unique functions. Gaining deeper insight into structure–property relationships and finding an effective method for precisely controlling architectures are two of the central issues in both materials and chemical science. The goal is not only to expand material applications but also to shed light on the development direction of material synthesis and design.
Most of reported fluorescent probes respond to targeting analytes through quenching the fluorescent intensity, which are not suitable for practical use, because the intensity of the single emission sensor changes while the fluorescence remains the same. Besides, the change of the single fluorescence intensity is not highly reproducible due to the interference of instrumental efficiency and environmental conditions.20,21 Two individual fluorescence emission wavelengths used for ratiometric fluorescent sensing could reduce the above limitations by means of self-calibration. Because one emission peak as reference is constant and another can be severely quenched as a signal report unit, the colour change of dual-emission fluorescent sensors is obvious and easily recognized by the naked eye under a UV lamp. Meanwhile the background interferences could be effectively eliminated and the sensitivity of the sensor could be improved. To this end, one emitter of the dual-fluorescence sensor should be sensitive to the analyte, while the other should not respond.
Arsenic is one of the most highly toxic elements in water which has numerous threats to global health.22 The major arsenic species found in environment are inorganic arsenite (As3+) and arsenate (As5+) salts, organic forms of arsenic,23–25 but exposure to different oxidation state of arsenic is quite varied. It is well-know that the inorganic arsenic is more toxic than organic arsenic, and arsenite is more toxic than arsenate.26 The carcinogenic effect of As(III) has already been confirmed according to the experiment, where it has been found that normal stem cells were exposed to 5 μM arsenite in vitro could result in a cancer stem cell phenotype by 18 week.27 In consideration that arsenic exposure have a strong impact on humans, the U.S. EPA and the WHO to lower the maximum contaminant level (MCL) for As(III) in drinking water from 50 to 10 ppb in 2001.28 Nowadays, this lower MCL has stimulated many research to develop new methods for monitoring arsenic. There have been several methods used to detect trace levels of arsenic. For example, high performance liquid chromatography (HPLC),29 atomic fluorescence spectrometry (AFS),30 inductively coupled plasma-mass spectrometry (ICP-MS),31etc. These methods all have extremely low detection limits, but as we all know that it's all expensive methods, and we cannot monitor real time and realize on-site detection.
In this manuscript, we have designed the colloidal QD chains, which were self-assembled by the mediation of trithiocyanuric acid (TTCA). The TTCA molecules can replace the mercaptopropionic acid (MPA) molecules from the surfaces of MPA-QDs, and the steric effect prevent the QDs from reacting with the third sulfydryl, so that it could form colloidal QD chains. Furthermore, a ratiometric fluorescent sensor with dual-emissions was designed by mixing the QD chains with blue fluorescent carbon dots (CDs) for the visual ultrasensitive detection for the more poisonous As(III) in the environmental water. In the process of As3+ detection, it could react with the remained sulfydryl, which resulted into the agglomeration of QD chains and quenching red emission of the QDs while the blue fluorescent CDs are insensitive to the analyte. So the variation of fluorescence intensity ratios produce an obvious change of the fluorescence color from fushia to blue, which can be conveniently observed by the naked eye under a UV lamp without any complicated instrumentation. The LOD of this ratiometric fluorescent probe could reach as low as 1 ppb, which is much lower than the maximum level of 10 ppb As3+ in drinking water stipulated by WHO, and it is a breakthrough of As(III) detection by fluorescent method. Following the sensing mechanism, a paper-based sensor has been prepared by printing the ratiometric probe on a filter paper, which provides a convenient and simple approach for the visual detection of As3+. Therefore, the very simple and effective strategy reported here could be extended to the visual detection of a wide range of analytes in the environment by the construction of highly efficient ratiometric nanoprobes.
Experimental
Chemicals and materials
All chemicals used were analytical grade. Cadmium chloride hydrate (CdCl2·2.5H2O), tellurium powder, sodium borohydride (NaBH4), sodium hydroxide (NaOH), sulfuric acid (H2SO4), citric acid and ethylenediamine were obtained from Sinopharm Chemical Reagent Company, Ltd. (Shanghai, China). 3-Mercaptopropionic acid (MPA), arsenic standards (As3+, As5+, organic As) and trithiocyanuric acid (TTCA) were bought from Aladdin (Shanghai, China). Ultrapure water (18.2 MΩ cm) was prepared by a Millipore water purification system.Instruments
Fluorescent spectra were recorded with a Cary Eclipse fluorescence spectrophotometer. The structure and morphology were examined using a JEM-2100F transmission electron microscope. Infrared (IR) spectra were performed on a Thermo Fisher Nicolet iS10 FT-IR spectrometer. The UV-visible absorption spectra were obtained with a Shimadzu UV-2550 spectrometer. Fluorescent photos were taken under AGL-9406 portable UV lamp (365 nm) by a Canon 600D digital camera.Synthesis of MPA modified CdTe QDs (MPA-QDs)
The red-emission CdTe QDs were synthesized according to the reported method with some modification in the aqueous phase.32 Firstly, 0.0638 g (0.5 mmol) of tellurium powder and 0.2 g of NaBH4 were added to 4 mL of deoxygenated water under a nitrogen atmosphere in an ice bath, the black mixture changed into white by stirred under a nitrogen atmosphere for 10 h to get the NaHTe solution. Meanwhile, 0.2284 g (1 mmol) of CdCl2·2.5H2O and 210 μL (2.5 mmol) of MPA were dissolved in 100 mL of ultrapure water and adjust the pH value of the mixture to 9 with 1.0 M NaOH, and the mixture was stirred under nitrogen for at least 30 min to remove the oxygen. Then, 20 mL of 0.5 M H2SO4 was injected into the as-prepared NaHTe solution and the freshly prepared H2Te was transferred into the above solution under a nitrogen atmosphere, the CdTe precursor (final molar ratio, Cd2+/Te2−/MPA = 1![[thin space (1/6-em)]](https://www.rsc.org/images/entities/char_2009.gif) :
:![[thin space (1/6-em)]](https://www.rsc.org/images/entities/char_2009.gif) 0.5
0.5![[thin space (1/6-em)]](https://www.rsc.org/images/entities/char_2009.gif) :
:![[thin space (1/6-em)]](https://www.rsc.org/images/entities/char_2009.gif) 2.5) was immediately formed with a colour change from colorless into red. The mixture was refluxed for 48 h at room temperature and then the red-emission MPA-QDs were obtained. Finally, the QDs were precipitated with acetone and purified by centrifugation. The purified MPA-QDs were dispersed in ultrapure water for further use.
2.5) was immediately formed with a colour change from colorless into red. The mixture was refluxed for 48 h at room temperature and then the red-emission MPA-QDs were obtained. Finally, the QDs were precipitated with acetone and purified by centrifugation. The purified MPA-QDs were dispersed in ultrapure water for further use.
Synthesis of TTCA-QDs
TTCA-QDs was prepared by further modified MPA-QDs with TTCA. Typically, 10 mL of MPA-QDs was added to 20 mL deionized water and 250 μL 0.01 M of TTCA was then gradually added into the above mixture and stirred for 12 h in the dark. Finally, the obtained TTCA-QDs were purified by dialysis for 10 h and then stored in the dark.Synthesis of carbon dots (CDs)
According to the previously reported method in literature.33 Typically, 1.05 g of citric acid and 0.34 mL of ethylenediamine were first dissolved in 10 mL ultrapure water. Then, the solution was transferred to a polytetrafluoroethylene autoclave (30 mL) and heated at 200 °C for 5 h. After reaction, the reactor was cooled to room temperature naturally and the CDs were further purified by dialysis for 24 h.Detection of As3+ with the ratiometric probe
Typically, 100 μL the as-prepared TTCA-QDs and 20 μL CDs were mixed in 2 mL DI water to form the dual-emission ratiometric fluorescent probe, and was added into a quartz cuvette for following detection. Then, 100 ppb As3+ was dropped into the quartz cuvette in batches. And the fluorescence spectra of the ratiometric probe under a single wavelength excitation at 350 nm were recorded by a fluorescence spectrophotometer. All the sensitivity and selectivity measurements were conducted in triplicate. The color changes were observed under a 365 nm UV lamp.Selectivity and interference experiments
To investigate the interference of other metallic ions (Co2+, K+, Ba2+, Ni2+, Ca2+, Li+, Mn2+, Na+, Mg2+, Zn2+, Cd2+, Al3+, Pb2+, Ag+, Fe2+, Fe3+, Cu2+, Hg2+, As5+ and organic As) on the detection of As3+, the fluorescent responses of the ratiometric probe to these metal ions were performed following the same procedure to that of As3+ mentioned above. For the interference study, 13.4 μM of Co2+, K+, Ba2+, Ni2+, Ca2+, Li+, Mn2+, Na+, Mg2+, Zn2+, Cd2+, Al3+, Pb2+, Ag+, Fe2+, Fe3+, Cu2+, Hg2+, As5+ and organic As were mixed with the ratiometric probe respectively. In the cases of coexisting metal ions, then 1.34 μM As3+ was further added into the probe solution and the fluorescence spectra were collected again.Preparation of test papers
A common cartridge of a commercial inkjet printer was washed with ultrapure water thoroughly until the ink powder was cleared away, followed by drying in an oven at 50 °C for 6 h. The mixture solution of TTCA-QDs and CDs (100/20 μL in 2 mL ultrapure water) as “ink” was injected into the vacant cartridge. The filter paper without any background fluorescence was sticked on a piece of A4 paper. The rectangle pattern of 11 × 3 cm2 was printed on the filter paper by the printer connected with a computer, and the printing was repeated for 30 times. After air-drying for 5 minutes, the pattern was cut into 3 × 1 cm2 pieces for the visual detection of As(III).Results and discussion
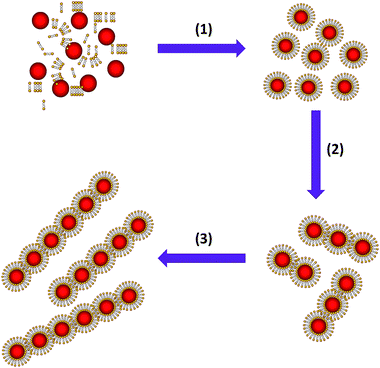
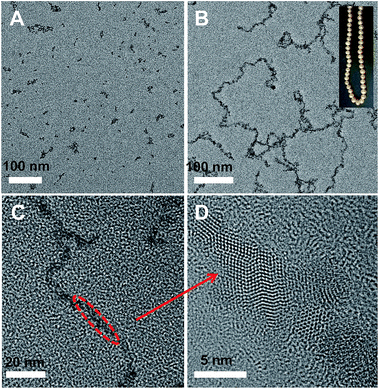
The CdTe QDs used in our research were first synthesized by the functionalization of QDs with mercaptopropionic acid (MPA) according to the reported method with some modification in the aqueous phase, resulting into MPA-QDs with red emission at 630 nm wavelength. Then a weak acid, trithiocyanuric acid (TTCA), was chosen as the structural mediator for the formation of the colloidal QD chains in solution. TTCA exhibits a perfectly regular structure that is applied extensively in synthetic chemistry, and the two-dimensional hydrogen-bonding networks and rich donor atoms of TTCA make it a strong candidate for the synthesis of supramolecular structured materials. As illustrated in Scheme 1, when mixed the MPA-QDs with TTCA aqueous solution with stirring for 12 h in the dark, the TTCA molecules can replace the MPA molecules from the surfaces of MPA-QDs (1), and because of the TTCA molecules is much smaller than MPA-QDs, the steric effect might prevent the QDs from reacting with the third sulfydryl so it could form colloidal.QD chains (2 and 3). The TEM characterizations of the samples further demonstrated the formation mechanism of the colloidal QD chains with TTCA molecules, as shown in Fig. 1. There are no such chain-like structures noticed in the samples without TTCA solution added into the mixtures (Fig. 1A). Long chains were obtained in the final samples while mixed the MPA-QDs with TTCA solution, and the chains contain several tens of QDs which were formed by end-to-end connection just like the neck-chain shown insert in Fig. 1B. The high resolution TEM further confirmed the detailed structures of the colloidal QD chains (Fig. 1C), and the TEM image in Fig. 1D demonstrated that the obtained QD has good crystal essential and the QD chains have some crystal defects along the connect areas of the end-to-end. The replacement of TTCA molecules with MPA from the surfaces of the QDs can also be proved by FTIR spectrum (see Fig. S1†), the peak at 2520 cm−1 in the left panel belongs to the –SH groups of TTCA molecules, so the similar peak at 2515 cm−1 wavelength in the right is from the third –SH of TTCA. The normalized absorption spectra (Fig. S2†) and the normalized fluorescence spectra (Fig. S3†) of the TTCA-QDs further demonstrated the replacement of TTCA with MPA from the QD surfaces, insert digital photos in Fig. S2† imply the colour changes from red to light yellow and the weak red shift in Fig. S3,† which was caused by the replacement of functional groups on the surfaces on the QDs.
It should be noticed that the size of the nanocrystals also play an important role for the final formation of the QD chains in current system. If used smaller QDs in this system (green-emission QDs with the diameter of about 2 nm), the resulting samples are not QD chains but only aggregates of QDs (Fig. S4†). On the other hand, if larger size nanoparticles (Au NPs with the size of about 12 nm) were adopted to perform the experiments, there are no QD chains and aggregates of QDs in the obtained samples. The smaller QDs have the trend to aggregate in solution because of noncovalent interactions (hydrogen bonding, π-stacking, van der Waals force, etc.). Among the neighbouring QDs, and the steric effect cannot have effective influence on the lager nanoparticles. Furthermore, the amounts of TTCA used in the process also has influence on the final formation of QD chains. As shown in Fig. S5,† when added little amount of TTCA into the system, the obtained samples only contain several random QDs (see Fig. S5A†). Some short chain-like structures were noticed in the TEM images if increased the amount of TTCA (Fig. S5B and C†) gradually. However, there are no QD chains in the final products but only aggregated QDs if higher amounts were adapted to functionalize the QDs (Fig. S5E and F†). Little amount of TTCA is not enough to connect the QDs to form long chains, and suitable amount can be utilized to form QD chains in solution. However, too much amount of TTCA added into the system would induce more noncovalent interactions among the neighboring QDs and cause the aggregates in the final samples. Fig. S5G† indicates there is weak red shift during the QDs assembled.
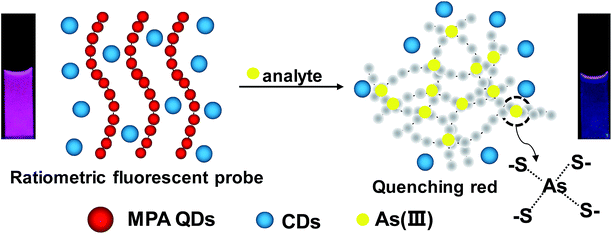
Furthermore, the formation of colloidal QD chains should have some unique optical properties originated from the chain-like structures. To extend the potential applications of the QD chains in optical sensing, a ratiometric fluorescent sensor with dual-emissions was designed by mixing the QD chains with blue fluorescent carbon dots (CDs) for the visual ultrasensitive detection of As(III) in the environmental water, as shown in Scheme 2. The remained sulfydryl on the surface of the TTCA-QDs could act as reaction site of arsenic, upon the addition of As3+ in the system, the formed As–S bonds induce the aggregation of TTCA-QDs to quench the red fluorescence of QDs fastly, resulting into the colour change from fushia to blue (inserted photos) and visual/ratiometric detection of arsenic in environmental water.
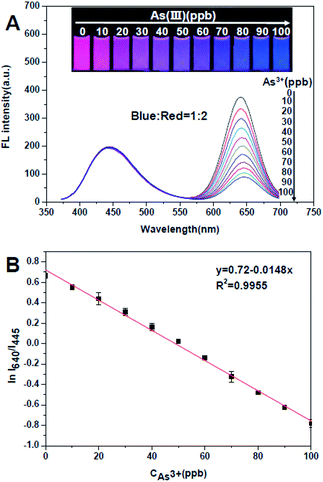
This dual-emission ratiometric fluorescence probe possesses two emission peaks at 445 and 640 nm under a single wavelength excitation of 350 nm with a fluorescence colour fushia (see Fig. S6†). With adding dosage of As3+, the red emission will be quenched, while the blue fluorescent CDs are insensitive to the analyte (see Fig. S7†). The influence of temperature and pH was investigated before the work, the stability of probes and the sensitivity to As3+ must be in considered in detection, so pH = 6.5 and T = 25 °C was chosen for detection (Fig. S8†). Furthermore, for obtaining the widest colour variation with the mixture of blue and red, we have investigated five different ratio of blue/red, as shown in Fig. S9 and S10† is the chromaticity data of the optimum choice for CDs and TTCA-QD chains ratio. Thus, blue CDs and red QD chains are mixed and the ratio of emission intensity of blue to red is adjusted to 1![[thin space (1/6-em)]](https://www.rsc.org/images/entities/char_2009.gif) :
:![[thin space (1/6-em)]](https://www.rsc.org/images/entities/char_2009.gif) 2, which could display a very wide/consecutive luminescence “from fushia to blue”, Fig. S11† is the agglomeration of QD chains after adding dosage of As3+ due to bond with –SH. Fig. 2 shows the variation of fluorescence intensity ratios produce an obvious change of the fluorescence color from fushia to blue, which can be conveniently observed by the naked eye under a UV lamp without any complicated instrumentation. And the limit of detection could be obtained by the definition, the ratio of 3 times the standard deviation of background and the slope of the liner function (3σ/S), was calculated to be as low as 1 ppb, compared to 5 ppb of MPA-QDs to As3+ (Fig. S12†), obviously the QD chains improved the sensitivity to As3+ about 5 times than QDs, it is a breakthrough of ion detection by the fluorescent method (Table S1†). The stability of the ratiometric probe is also systematically investigated by fluorescence spectra in aqueous solution under UV lamp, as in Fig. S13† the fluorescence intensity ratios (I640/I445) of the probe remain unchanged over 3 h, demonstrating its excellent photostability. Fig. S14† shows the dynamics of fluorescent responses of TTCA QD chains/CDs to 50 and 100 ppb As3+. The reaction between –SH and As3+ could be completed in 1 minute, the reaction velocity is much more outstanding than the method by instrument (Fig. 3).
2, which could display a very wide/consecutive luminescence “from fushia to blue”, Fig. S11† is the agglomeration of QD chains after adding dosage of As3+ due to bond with –SH. Fig. 2 shows the variation of fluorescence intensity ratios produce an obvious change of the fluorescence color from fushia to blue, which can be conveniently observed by the naked eye under a UV lamp without any complicated instrumentation. And the limit of detection could be obtained by the definition, the ratio of 3 times the standard deviation of background and the slope of the liner function (3σ/S), was calculated to be as low as 1 ppb, compared to 5 ppb of MPA-QDs to As3+ (Fig. S12†), obviously the QD chains improved the sensitivity to As3+ about 5 times than QDs, it is a breakthrough of ion detection by the fluorescent method (Table S1†). The stability of the ratiometric probe is also systematically investigated by fluorescence spectra in aqueous solution under UV lamp, as in Fig. S13† the fluorescence intensity ratios (I640/I445) of the probe remain unchanged over 3 h, demonstrating its excellent photostability. Fig. S14† shows the dynamics of fluorescent responses of TTCA QD chains/CDs to 50 and 100 ppb As3+. The reaction between –SH and As3+ could be completed in 1 minute, the reaction velocity is much more outstanding than the method by instrument (Fig. 3).
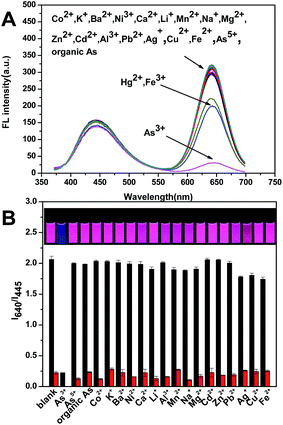
In addition, the selectivity is also very important to a probe. To investigate the interference of other metallic ions of the As3+ detection, the spectral selectivity were evaluated by measuring the fluorescence intensity of the ratiometric probe and the luminance colour. In Fig. 4, it can be seen that when 13.4 μM Co2+, K+, Ba2+, Ni2+, Ca2+, Li+, Mn2+, Na+, Mg2+, Zn2+, Cd2+, Al3+, Pb2+, Ag+, Cu2+, Fe2+, As5+ and organic As was added into the mixture, respectively; the ratio I640/I445 almost unchanged, and the color kept fushia under the illustration of UV lamp, suggesting an excellent selectivity to As3+. Although the Fe3+ and Hg2+ have a little effect on the detection, we can add S2O32− to eliminate the Fe3+ and I−, RhB to masking the Hg2+ completely34 (Fig. S15†). Then add 1.34 μM As3+ to the above system separately to further investigate the interference to As3+ detection, it is obviously shown that most of the metallic ions have no interference to the detection of As3+.
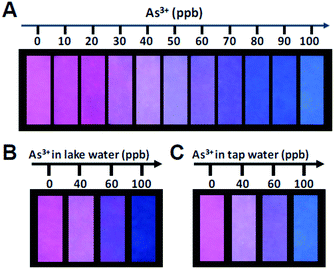
Furthermore, paper sensors have attracted much research interests with wider applications in explosive analysis,32 biological detection35 and environmental monitoring.36 In particular, the unique advantages of paper sensors include visible results, quick response, portability and low cost, making them more suitable for practical use. In order to realize real time and on-site monitor with above ratiometric probe, we apply the probes on the filter paper to get a test paper for the visual fluorescent detection of As3+ conveniently. The fluorescent test papers were prepared using TTCA-QDs/CDs probe as fluorescent ink and was printed on a piece of filter paper through an inkjet printer connected with a computer, to confirm its visual quantification with the wide and consecutive colour variations. When the As3+ was evenly added on a piece of 3 × 1 cm2 test paper, the remarkable colour changes from fushia to blue at different concentration of As3+ were seen under UV lamp clearly in Fig. 4A, which was similar to visual results of pH test paper. Meanwhile, the effectiveness and reliability of test paper were checked in the application for the detection of As3+ in the lake water and tap water. We used Fig. 4A as the standard color card, spiked As3+ of 40, 60, 100 ppb into it respectively and found the displayed colors at 40, 60, 100 ppb were almost identical to the standard (Fig. 4B and C). The results confirm that the as prepared TTCA-QDs/CDs test papers can be actually applicable for the detection of As3+ in the water sample. Moreover we have added different amounts of As3+ into the tap water and the lake water to test the practicability of this ratiometric fluorescent probe (Table S2†), it shows the recoveries in the range of 99.4–103% and 97.2–103.4% of the tap water and the lake water respectively. It suggests that this mixing probe could work efficiently in natural water sample.
Conclusions
In summary, a novel colloidal QD chains have been designed with the mediation of trithiocyanuric acid (TTCA) to fully explore the unique optical properties of CdTe quantum dots (CdTe QDs). Furthermore, a ratiometric fluorescent sensor with dual-emissions was constructed by mixing the QD chains with blue fluorescent carbon dots (CDs) for the visual ultrasensitive detection of As3+ in the environmental water. With adding dosage of As3+, the red emission QD chains could be quenched because of the bond between –SH and the remained sulfydryl, while the blue fluorescent CDs are insensitive to the analyte. So the ratiometric fluorescent probe could display a wide-colour-varying for visualized detection without any complicated instrumentation. The LOD of this ratiometric fluorescent probe could reach as low as 1 ppb, which is much lower than the maximum level of 10 ppb As3+ in drinking water stipulated by WHO. Following the sensing mechanism, a paper-based sensor has been prepared by printing the ratiometric probe on a filter paper, which provides a convenient and simple approach for the visual detection of As3+. Therefore, the very simple and effective strategy reported here could be extended to the visual detection of a wide range of analytes in the environment by the construction of highly efficient ratiometric nanoprobes.Conflicts of interest
There are no conflicts to declare.Acknowledgements
This work is supported by the National Basic Research Program of China (2015CB932002), China-Singapore Joint Project (2015DFG92510), Science and National Natural Science Foundation of China (No. 21507134, 21371174, 21671052), and the Natural Science Foundation of Anhui Province (1408085QB29, 1508085QB29).References
- Y. Feng, Y. Wang, J. He, X. Song, Y. Y. Tay, H. H. Hng, X. Y. Ling and H. Chen, J. Am. Chem. Soc., 2015, 137, 7624–7627 CrossRef CAS.
- X. Peng, Nano Res., 2010, 2, 425–447 CrossRef.
- X. Wang, J. Zhuang, Q. Peng and Y. Li, Nature, 2005, 437, 121–124 CrossRef CAS.
- R. Jin, Nanoscale, 2015, 7, 1549–1565 RSC.
- P. D. Yang, H. Q. Yan, S. Mao, R. Russo, J. Johnson, R. Saykally, N. Morris, J. Pham, R. R. He and H. J. Choi, Adv. Funct. Mater., 2002, 12, 323–331 CrossRef CAS.
- M. Qian, A. C. Reber, A. Ugrinov, N. K. Chaki, S. Mandal, H. M. Saavedra, S. N. Khanna, A. Sen and P. S. Weiss, ACS Nano, 2010, 4, 235–240 CrossRef CAS.
- W. H. Chong, L. K. Chin, R. L. Tan, H. Wang, A. Q. Liu and H. Chen, Angew. Chem., Int. Ed., 2013, 52, 8570–8573 CrossRef CAS.
- N. G. Bastús, F. Merkoçi, J. Piella and V. Puntes, Chem. Mater., 2014, 26, 2836–2846 CrossRef.
- R. E. Bailey and S. M. Nie, J. Am. Chem. Soc., 2003, 125, 7100–7106 CrossRef CAS.
- F. Caruso, Adv. Mater., 2001, 13, 11–22 CrossRef CAS.
- Y. N. Xia, B. Gates, Y. D. Yin and Y. Lu, Adv. Mater., 2000, 12, 693–713 CrossRef CAS.
- Y. Xia, Y. Xiong, B. Lim and S. E. Skrabalak, Angew. Chem., Int. Ed., 2009, 48, 60–103 CrossRef CAS.
- H. Wang, X. H. Song, C. C. Liu, J. T. He, W. H. Chong and H. Y. Chen, ACS Nano, 2014, 8, 8063–8073 CrossRef CAS.
- Y. Zhu, J. He, C. Shang, X. Miao, J. Huang, Z. Liu, H. Chen and Y. Han, J. Am. Chem. Soc., 2014, 136, 12746–12752 CrossRef CAS.
- M. B. Bannwarth, S. Utech, S. Ebert, D. A. Weitz, D. Crespy and K. Landfester, ACS Nano, 2015, 9, 2720–2728 CrossRef CAS.
- M. Jiang and X. Peng, Nano Lett., 2017, 17, 3570–3575 CrossRef CAS.
- F. Caruso, R. A. Caruso and H. Mohwald, Science, 1998, 282, 1111–1114 CrossRef CAS.
- S. H. Jung, J. Jeon, H. Kim, J. Jaworski and J. H. Jung, J. Am. Chem. Soc., 2014, 136, 6446–6452 CrossRef CAS.
- X. Zhang, L. Lv, L. Ji, G. Guo, L. Liu, D. Han, B. Wang, Y. Tu, J. Hu, D. Yang and A. Dong, J. Am. Chem. Soc., 2016, 138, 3290–3293 CrossRef CAS.
- X. Chen, S. Yu, L. Yang, J. Wang and C. Jiang, Nanoscale, 2016, 8, 13669–13677 RSC.
- J. R. Kalluri, T. Arbneshi, S. A. Khan, A. Neely, P. Candice, B. Varisli, M. Washington, S. McAfee, B. Robinson, S. Banerjee, A. K. Singh, D. Senapati and P. C. Ray, Angew. Chem., Int. Ed., 2009, 48, 9668–9671 CrossRef CAS.
- D. K. Nordstrom, Science, 2002, 296, 2143–2145 CrossRef CAS.
- A. A. Ensafi, A. C. Ring and I. Fritsch, Electroanalysis, 2010, 22, 1175–1185 CrossRef CAS.
- M. M. Moriarty, I. Koch, R. A. Gordon and K. J. Reimer, Environ. Sci. Technol., 2009, 43, 4818–4823 CrossRef CAS.
- W. R. Cullen and K. J. Reimer, Chem. Rev., 1989, 89, 713–764 CrossRef CAS.
- B. K. Jena and C. R. Raj, Anal. Chem., 2008, 80, 4836–4844 CrossRef CAS.
- E. J. Tokar, S. A. Diwan and M. P. Waalkes, Environ. Health Perspect., 2010, 118, 108–115 CrossRef CAS.
- V. C. Ezeh and T. C. Harrop, Inorg. Chem., 2012, 51, 1213–1215 CrossRef CAS.
- K. H. Al-Assaf, J. F. Tyson and P. C. Uden, J. Anal. At. Spectrom., 2009, 24, 376–384 RSC.
- N. Zhang, N. Fu, Z. Fang, Y. Feng and L. Ke, Food Chem., 2011, 124, 1185–1188 CrossRef CAS.
- K. Jitmanee, M. Oshima and S. Motomizu, Talanta, 2005, 66, 529–533 CrossRef CAS.
- K. Zhang, H. Zhou, Q. Mei, S. Wang, G. Guan, R. Liu, J. Zhang and Z. Zhang, J. Am. Chem. Soc., 2011, 133, 8424–8427 CrossRef CAS.
- S. Zhu, Q. Meng, L. Wang, J. Zhang, Y. Song, H. Jin, K. Zhang, H. Sun, H. Wang and B. Yang, Angew. Chem., Int. Ed., 2013, 52, 3953–3957 CrossRef CAS.
- J. Yao, K. Zhang, H. Zhu, F. Ma, M. Sun, H. Yu, J. Sun and S. Wang, Anal. Chem., 2013, 85, 6461–6468 CrossRef CAS.
- X. Huang, Y. Zhou, C. Liu, R. Zhang, L. Zhang, S. Du, B. Liu, M. Y. Han and Z. Zhang, Biosens. Bioelectron., 2016, 86, 530–535 CrossRef CAS.
- Y. Wang, C. Zhang, X. Chen, B. Yang, L. Yang, C. Jiang and Z. Zhang, Nanoscale, 2016, 8, 5977–5984 RSC.
Footnote |
| † Electronic supplementary information (ESI) available. See DOI: 10.1039/c7ra10259c |
| This journal is © The Royal Society of Chemistry 2017 |

