 Open Access Article
Mesoporous acidic polymeric ionic liquids as novel solid acids for catalytic hydrolysis of ketoxime reactions†
Shanshan Zhaoa,
Zhengxiang Maa,
Peng Chenga,
Yanji Wang ab,
Xinqiang Zhao
 ab,
Qiusheng Yangab,
Junqi Zhanga and
Dongsheng Zhang
 *ab
*ab
aHebei Provincial Key Lab of Green Chemical Technology and High Efficient Energy Saving, Hebei University of Technology, Tianjin 300130, China. E-mail: zds1301@hebut.edu.cn; Fax: +86-22-60204294; Tel: +86-22-60204294
bHebei Industrial Technology Research Institute of Green Chemical Industry, Huanghua 061100, Hebei, China
First published on 21st November 2022
Abstract
In this study, a series of mesoporous acidic polymeric ionic liquids were successfully synthesized and characterized to explore their structures and properties. Examination of catalytic performance using cyclohexanone oxime's maximum conversion were investigated, and the Box–Behnken design was used to achieve the highest hydrolysis conversion. Excellent catalytic activity, structural stability, and an easy recovery feature were all displayed by the Poly(VBS-DVB)HSO4 catalyst. Additionally, a possible reaction pathway involving hydrogen protons was proposed for the present hydrolysis. Moreover, a series of ketoximes were also examined including acetone oxime, butanone oxime, cyclopentanone oxime and acetophenone oxime over Poly(VBS-DVB)HSO4 catalyst. The conversion of ketoxime was not less than 80.44%, and the results also demonstrated excellent catalytic performance. Synthesis of mesoporous acidic polymeric ionic catalysts with good properties would be very important for their applications.
1. Introduction
Hydroxylamine and its salts are important chemical intermediates, which are mainly in the form of hydroxylamine sulfate, hydroxylamine hydrochloride, hydroxylamine nitrate and hydroxylamine phosphate.1 These kinds of hydroxylamine are widely used in the production of ε-caprolactam, medicine, pesticides, rubber, dyes, military, and so on.2–4 Traditional ways for the production of hydroxylamine salt mainly include the Rashing method,5 the hydroxylamine–phosphate–oxime (HPO) process,6 the catalytic hydrogenation of nitric oxide7 and acid hydrolysis of nitroalkanes, etc.8 However, all these methods suffer from some problems including complicated operation processes, harsh reaction conditions and environmental pollution. Therefore, it is necessary to explore a mild and environment-friendly production route for hydroxylamine.Additionally, hydroxylamine can also be produced by hydrolysis reaction using ketoxime as raw material, especially cyclohexanone oxime hydrolysis.9 However, the industrial production of cyclohexanone oxime has been carried out with hydroxylamine salts as raw material for a long time. Therefore, the hydrolysis of cyclohexanone oxime to make hydroxylamine was once considered uneconomical. With the introduction of titanium silicon molecular sieve (TS-1) catalyst, the one-step synthesis of cyclohexanone oxime from cyclohexanone, NH3, and H2O2 had recently become more developed and industrialized.10 So that cyclohexanone oxime can be produced without using hydroxylamine,9,11 thereby breaking the situation of traditional hydroxylamine synthesis of cyclohexanone oxime.12 Therefore, it is reasonable and feasible to explore the hydrolysis of cyclohexanone oxime to hydroxylamine.
Usually, cyclohexanone oxime conversion is nearly 100% with inorganic acid as a catalyst.8 Although the catalytic effect is satisfactory, there is still the problem of difficult catalyst recovery. Therefore, it is of great significance to develop a nonhomogeneous catalyst with high catalytic activity for the hydrolysis reaction. Ionic liquids (ILs), being a new type of solvent and catalyst with the advantages of designability, low volatility, good thermal stability as well as adjustable controlled acidity and alkalinity,13,14 are widely used in organic synthesis, catalysis, gas separation and other fields.15,16 Unfortunately, it has several drawbacks in terms of separation and recycling.17,18 In recent years, the reactivation and reuse of ILs have attracted extensive attention.19 Immobilization of ionic liquids has become a trend.20 Many researchers have used chemical methods to immobilize ionic liquids on various catalyst carriers, such as silica gel,21 activated carbon,22 molecular sieve,23 etc. ILs loaded on porous materials is an effective catalyst with good reusability. However, ionic liquids are generally only present on the surface of the carrier as they are covalently linked to the carrier's active group. This results in a low loading of ionic liquids and fewer active sites.24,25 In our previous studies, we also found a similar situation, which led to the low conversion of cyclohexanone oxime hydrolysis to hydroxylamine.26 Therefore, we need to continue to find a solid acid to change the status of this reaction.
Recently, polymeric ionic liquids (PILs), a new type of polymeric material, are beginning to appear in public view. It combines the advantages of ILs and polymers, usually in solid form, with ionic liquid units in each polymer backbone. Functional PILs containing different functional groups and active sites are obtained through the modulated design of ILs monomers and ion exchange.27,28 PILs with different functionalities shows good application prospects in polyelectrolyte,29–31 adsorption and separation,32,33 catalyst,34–36 etc. PILs have received additional attention, particularly in the area of catalysis. Qiu et al. prepared polymeric self-curing ionic liquids as efficient catalysts for biodiesel production by a one-step process.37 Dyson et al. described a polymeric ionic liquid (PIL) derived from trimethyl(p-vinyl benzyl)ammonium chloride ([VBTAm] Cl) efficiently catalyzes the N-carbonylation and N-methylation reactions of amines.38 Sahiner et al. designed a polymeric ionic liquid catalyst of poly(4-vinyl pyridine) to replace the metal catalyst, which was successfully used for the hydrolysis of NaBH4 and methanolysis to hydrogen.39 Inspired by the above, in this work, we have introduced crosslinkers to synthesize a series of mesoporous acidic polymeric ionic liquids with exposed active sites and used in the hydrolysis of cyclohexanone oxime reaction. In addition, response surface methodology (RSM) was used to optimize the hydrolysis reaction parameters and the reusability performance of the PILs was examined.
2. Experimental
2.1. Materials
All reagents are analytical reagents and can be purchased directly without further purification. Divinylbenzene (DVB), N,N′-methylene bisacrylamide (MBA), 1-vinyl imidazole (vim), 1,3-propane sulfonate lactone, 1,4-butane sulfonate lactone, n-butyl bromide, azobisisobutyronitrile (AIBN), cyclohexanone oxime, cyclohexanone, butanone oxime, vutanone, acetone oxime, acetone, acetophenone oxime, acetophenone, chlorobenzene, trifluoromethanesulfonic acid and trifluoroacetic acid were purchased from Shanghai MACKLIN Company. Acetonitrile, ethyl acetate, ethanol, dichloromethane, dichloroethane, sulfuric acid, nitric acid, hydrochloric acid, phosphoric acid and potassium permanganate standard solutions were provided by Tianjin Chen Fu Reagent Factory.2.2. Catalyst preparation
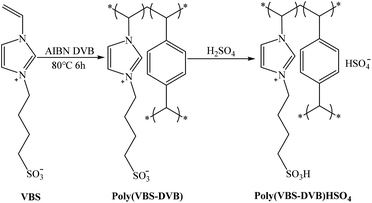
The method for the synthesis of acidic polymeric ionic liquids was based on the literature,40 with modifications, and the specific synthesis steps were as follows.2.3. Catalyst characterization
Fourier transform infrared (FT-IR) was recorded on a Nicolet NEXUS 470 (Thermoelectric Corporation, USA) to analyze the structure. The surface morphology of the samples was studied on a scanning electron microscope (Nova nano SEM 450, FEI, USA). Nitrogen adsorption–desorption isotherms were examined using a temperature-programmed chemisorption instrument (Auto Chem II 2920, Mac Instruments, USA). The surface area of the samples was measured by the Brunauer–Emmett–Teller (BET) method and the pore size distribution curves were calculated by the Barrett–Joyner–Halenda (BJH) method. The X-ray photoelectron spectroscopy (XPS) was studied with Mg Kα radiation on ESCALAB 250 spectrophotometer (Thermo Fisher Scientific Co., Ltd). Thermogravimetric analysis (TG) was performed under an N2 atmosphere using the HCT-3 instrument (Beijing Hengjiu Scientific Instruments Factory). The CHNS elemental analysis was performed with a Flash EA Model 1112 (Thermoelectric Co, USA) instrument. Contact angle (CA) measurement using Data physics OCA 20 (Data physics, Germany) equipment. Nanoparticle size (DLS) was measured using a Zetasizer Nano ZS90 (Malvern manufacturer) device at 25 °C.2.4. Catalytic testing
The cyclohexanone oxime hydrolysis reaction was carried out in a 100 mL eggplant-shaped bottle equipped with a reflux condenser. Usually, cyclohexanone oxime (0.5 g), catalyst (2 g) and water (55 mL) were added sequentially and stirred for 1 h at 60 °C. After that, the PILs catalyst was separated by centrifugation, and the separated PILs was washed with ethanol and dried under vacuum for further use.The obtained organic phase was extracted with dichloroethane. The concentrations of organic components were analyzed by a 7890B gas chromatography. During the analysis process, chlorobenzene was selected as an internal standard. Fig. S1† shows a typical gas chromatogram. From this, it can be found that besides the organic product cyclohexanone, no other byproduct was observed. Cyclohexanone oxime conversion (XCyo-o) was calculated by the following. The hydroxylamine in the aqueous phase was analyzed by oxidation–reduction titration with potassium permanganate. The yield (YNH2OH) and the selectivity of hydroxylamine (SNH2OH) were calculated as follows.
 | (1) |
 | (2) |
 | (3) |
2.5. Experimental design
 | (4) |
3. Results and discussion
3.1. Characterizations of catalyst
The chemical composition and chemical valence states of the synthesized Poly(VBS-DVB)HSO4 were further evaluated by XPS. The XPS spectra (Fig. 1a) confirmed that the Poly(VBS-DVB)HSO4 contains C, N, O and S elements, indicating that 1-vinyl imidazole and sulfonic acid groups were successfully introduced into the mesoporous acidic PILs.43 To further determine the state of C, N and S elements, high-resolution XPS spectra were analyzed in detail. Fig. 1b showed two peaks at binding energies of 286.6 and 284.8 eV, corresponding to the valence states of C in the C–S and C–C bonds, respectively. This was characteristic of the sulfonic acid group on mesoporous acid-functionalized PILs. Fig. 1c showed that the peak positions of N 1s were 402 and 400.3 eV, which corresponded to the valence distribution of the N element in the N–C bond. This resulted from the quaternization of the imidazole ring and the 1,4-butane sulfonate lactone. As shown in Fig. 1d, S 2p had peaks at 169.5 and 168.2 eV, respectively, corresponding to the S in S–O. These XPS analyses further proved the successful synthesis of Poly(VBS-DVB)HSO4.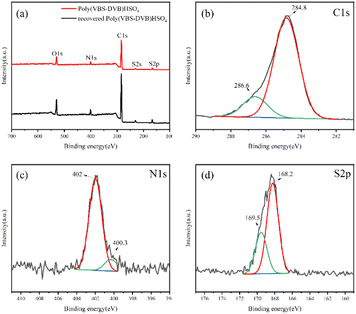 | ||
| Fig. 1 XPS measurements of (a) wide-scan survey; (b) C 1s of Poly(VBS-DVB)HSO4; (c) N 1s of Poly(VBS-DVB)HSO4; (d) S 2p of Poly(VBS-DVB)HSO4. | ||
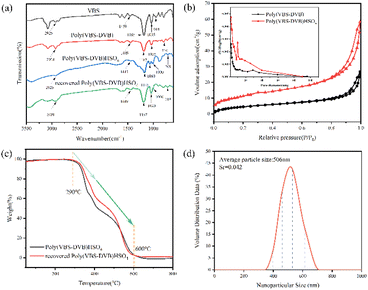
Fig. 2a illustrated the FT-IR spectra of VBS, Poly(VBS-DVB), Poly(VBS-DVB)HSO4 and recovered Poly(VBS-DVB)HSO4. The peaks at 2925 cm−1 and 1459 cm−1 were assigned to the stretching vibration of C–H and imidazole ring C–N. The peaks at 1185 cm−1 and 1035 cm−1 were usually attributed to the asymmetric and symmetric stretching vibrations of sulfonic groups. The characteristic peak at 944 cm−1 was caused by the bending vibration of terminal group ![[double bond, length as m-dash]](https://www.rsc.org/images/entities/char_e001.gif) CH2 in the HCR
CH2 in the HCR![[double bond, length as m-dash]](https://www.rsc.org/images/entities/char_e001.gif) CH2 structure. The disappearance of the characteristic peak of terminal group HCR
CH2 structure. The disappearance of the characteristic peak of terminal group HCR![[double bond, length as m-dash]](https://www.rsc.org/images/entities/char_e001.gif) CH2 proved the successful polymerization of PILs. In addition, the characteristic peak at 719 cm−1 was caused by the C–H out-of-plane bending vibration of the benzene ring, which proved the successful introduction of the cross-linker DVB in PILs.44 And the peak at 1000 cm−1 assigned to the stretching vibration of the –HSO4 group proved the success of anion exchange. It could be seen from the figure that the addition of H2SO4 might affect the absorption frequency of some functional groups. The peak values of the C–N bond (1449 cm−1) of imidazole ring and the C–H bond (719 cm−1) of benzene ring both decreased slightly. The –HSO4 functional group (1000 cm−1) of recovered Poly(VBS-DVB)HSO4 showed signs of slight overlap with the characteristic peak of the sulfonic acid functional group. The recovered Poly(VBS-DVB)HSO4 also had a slight effect on the absorption frequency of functional groups. However, the effect was weaker than Poly(VBS-DVB)HSO4, which might be due to a small amount of sulfuric acid leaching. The FT-IR results showed that the sulfonic acid group and –HSO4 group were well bound to Poly(VBS-DVB)HSO4.
CH2 proved the successful polymerization of PILs. In addition, the characteristic peak at 719 cm−1 was caused by the C–H out-of-plane bending vibration of the benzene ring, which proved the successful introduction of the cross-linker DVB in PILs.44 And the peak at 1000 cm−1 assigned to the stretching vibration of the –HSO4 group proved the success of anion exchange. It could be seen from the figure that the addition of H2SO4 might affect the absorption frequency of some functional groups. The peak values of the C–N bond (1449 cm−1) of imidazole ring and the C–H bond (719 cm−1) of benzene ring both decreased slightly. The –HSO4 functional group (1000 cm−1) of recovered Poly(VBS-DVB)HSO4 showed signs of slight overlap with the characteristic peak of the sulfonic acid functional group. The recovered Poly(VBS-DVB)HSO4 also had a slight effect on the absorption frequency of functional groups. However, the effect was weaker than Poly(VBS-DVB)HSO4, which might be due to a small amount of sulfuric acid leaching. The FT-IR results showed that the sulfonic acid group and –HSO4 group were well bound to Poly(VBS-DVB)HSO4.
The nitrogen adsorption and desorption isotherms of the samples were shown in Fig. 2b. It was obvious that both Poly(VMS-DVB) and Poly(VMS-DVB)HSO4 showed type IV isotherms with a clear H1-type lag loop.45 As could be seen from the figure, there was a clear capillary coalescence between p/p0 = 0.8 and 1.0 with a sudden increase in adsorption and a hysteresis loop. The pore size distribution calculated by the Barrett–Joyner–Halenda (BJH) method showed that the pore channel distribution was mainly concentrated in the range of 2–40 nm, which was in the range of mesopore pore size. There were very few large pores. The specific surface areas of Poly(VBS-DVB) and Poly(VBS-DVB)HSO4 were 17.9982 m2 g−1 and 42.1907 m2 g−1, and the pore volumes were 0.027 cm3 g−1 and 0.065 cm3 g−1, respectively. The specific data were shown in the Table S3.†
To investigate the thermal stability of the samples obtained, TG analysis was carried out as shown in Fig. 2c. The TGA curve dropped sharply from 290 °C to 600 °C with a weight loss of about 98%, which was due to the decomposition of the acidic functional groups and the polymer backbone.45 Overall, Poly(VBS-DVB)HSO4 have thermal stability at about 290 °C, and it is feasible to use them as catalysts.
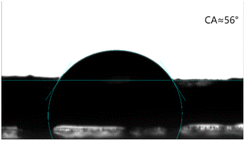
Dynamic light scattering (DLS) is an important technical index to measure whether a substance belongs to nanomaterials or not.46 The particle size of Poly(VBS-DVB)HSO4 was characterized by Zetasizer Nano ZS90 (Fig. 2d). The average particle size of Poly(VBS-DVB)HSO4 was 506 nm, and the relative standard deviation was Sr = 0.042. Fig. 3 showed the contact angle between Poly(VBS-DVB)HSO4 and water, which was about 56°, with CA < 90° indicating that water wetted its solid surface more easily. The results indicated that in the hydrolysis reaction, the wettability of Poly(VBS-DVB)HSO4 on the water was conducive to the better dispersion of the catalytic center.44
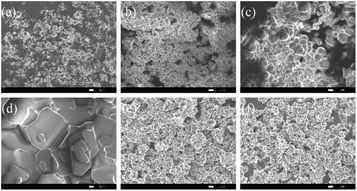
Fig. 4 was SEM images of representative samples. Fig. 4a–c were Poly(VBS-DVB) synthesized at the initiator dosage of 1 wt%, 3 wt% and 10 wt%, respectively. When the initiator dosage was too small, the pore distribution was uneven. While the initiator dosage was too large, the excessive polymerization occurred. Similar to the experimental results, when the initiator dosage was 3%, the pore size distribution was uniform, which was more conducive to the acid reaction. Fig. 4e and f were morphologically close to the images, indicating that Poly(VBS-DVB)HSO4 inherited the morphology of Poly(VBS-DVB)HSO4 precursor very well. The morphology of recovered Poly(VBS-DVB)HSO4 did not change significantly, indicating that the structure of PILs was stable.
3.2. Experimental results and RSM analysis
Analysis of variance (ANOVA) is an important step in response surface methodology to reveal the significance of each influence factor in the model fit, the reliability of the regression analysis and the accuracy of the regression equation, usually expressed in terms of p-value and F-value. Usually, the p-value of the model with cyclohexanone oxime conversion as the response target was <0.01, indicating that the relationship between the three influencing factors and the target value in the regression model was significant, and the model fit was high, with a certain degree of representativeness and high accuracy. From Table S5,† the p-value of Lack of Fit is >0.05, which indicated that the Lack of Fit is not significant. The test results were not greatly influenced by other factors, the test error was small, and the main influence point of the Lack of Fit was the number of central tests. In this experiment, five central tests were used to make the error randomly distributed in the test and improve the accuracy of a single test. The goodness of fit of the model can also be verified by multiple correlation coefficients. In this experiment, the multiple correlation coefficient R2 = 0.9817, indicating that the influence of error was not obvious, and the regression equation was well fitted. The adjusted coefficient of determination adjR2 = 0.9582, which meant that the model could explain 95.8% of the response value changes, and 4.2% of the total variation could not be explained by the model. The coefficient of variation of this model was CV = 4.13%, indicating good repeatability of the experiment. To sum up, the regression equation and the fitting model had high accuracy and authenticity and could be used as a reliable basis for subsequent analysis.
According to the p-values of the influence factors in Table S5,† the regression coefficients of catalyst amount and water consumption were less than 0.01, which meant that the influence is extremely significant, and the regression coefficient of reaction temperature was less than 0.05, which meant that the influence is significant. The F-values of the influencing factors (X1, X2, X3) were 6.99, 126.2 and 38.92, respectively, indicating that the amount of catalyst had the greatest effect on the conversion of cyclohexanone oxime, followed by water consumption and reaction temperature. Among them, the partial regression coefficient of the interaction term X2X3 was very small, indicating that the interaction term of the interaction of the influencing factors catalyst dosage and water consumption had little effect on the conversion of cyclohexanone oxime. However, the significant coefficients of reaction temperature (X12), catalyst amount (X22) and water consumption (X32) were less than 0.01, indicating that these three influencing factors had extremely significant effects on the conversion of cyclohexanone oxime. The quadratic response surface equation fitted by the Box–Behnken design method is:
| Y = 73.66 + 2.34X1 + 9.92X2 + 5.51X3 + 2.41X1X2 − 0.98X1X3 + 0.03X2X3 − 8.1X21 − 11.51X22 − 8.23X23 | (5) |
In the fitting formula (eqn (5)), Y is the conversion of cyclohexanone oxime, X1 is the reaction temperature, X2 is the amount of catalyst, and X3 is the water consumption. From the formula, the first-order coefficients of reaction temperature, catalyst amount and water consumption were all positive, indicating that the positive increase of any two factors could make the target value increase positively.
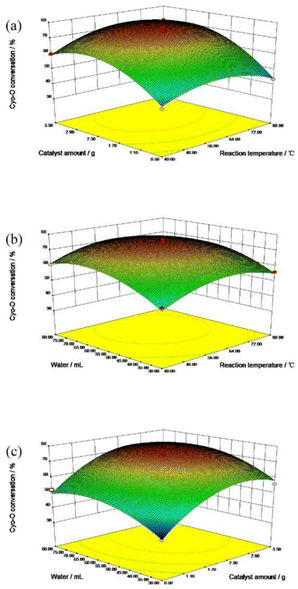
As for the influence of catalyst amount, the cyclohexanone oxime conversion was increased gradually with the addition of catalyst amount. The more active centers the catalyst provided, the higher the reactants converted naturally. However, when the catalyst amount exceeded 2 g, the conversion of cyclohexanone oxime remained almost unchanged, indicating that the active center required for the reactants reached saturation.
Fig. 5b described the interaction between reaction temperature and water consumption. The conversion of cyclohexanone oxime elevated with the addition of reaction temperature and water consumption. An appropriate amount of water could accelerate the collision between the reactants and the catalyst molecules, thus promoting the reaction to proceed in the positive direction. However, excessive water would dilute the active center of the catalyst, thereby reducing the reaction conversion.
Fig. 5c demonstrated the interaction effect of catalyst dosage and water consumption. Within a certain range, increasing the amount of catalyst and water consumption promoted the reaction forward. Excessive water and catalyst were not conducive to the further conversion of cyclohexanone oxime.
To obtain the optimum conditions of cyclohexanone oxime conversion, the regression (eqn (5)) was solved. According to (eqn (5)), the optimal conditions were estimated as follows. When the reaction temperature was 65.38 °C, the amount of catalyst was 2.67 g, and the water consumption was 61.23 mL, the conversion of cyclohexanone oxime could reach 76.92%. To verify the validity of the model prediction, the experiment was carried out under the above conditions. The cyclohexanone oxime conversion was obtained at 77.23%. The experimental relative error was small, and the experimental value was not significantly different from the predicted value, indicating that the statistical model effectively predicted the conversion of cyclohexanone oxime.
3.3. Reusability of catalyst
As known to all, reusability is an important indicator of the catalyst's performance. It could be seen from Table S1† Poly(VBS-DVB)HSO4 worked best was easy to recover, but its quality was slightly lost in the process of washing and transferring. To investigate the reusability of Poly(VBS-DVB)HSO4, the reacted catalyst was separated by centrifugation after the first operation. The separated catalyst was washed repeatedly with ethanol and aqueous solution for more than three times to remove surface impurities. Next, the catalyst was filled into a column and rinsed with a certain concentration of H2SO4 solution (2.5 mol L−1) for 5 min, and rinsed with CH2Cl2 to the pH value was about 7. The regenerated catalyst was vacuum dried at 80 °C for 6 h before the next turn, and Poly(VBS-DVB)HSO4 remained well active after six cycles (Fig. 6). Elemental analysis found that the results of reactivated catalysts (C 31.55 wt%, H 4.89 wt%, N 1.26 wt%, S 10.03 wt%) and fresh catalysts were almost the same, which was consistent with the results of cyclic tests. It indicated that the acidic center on the surface of Poly(VBS-DVB)HSO4 was relatively stable. The recovered Poly(VBS-DVB)HSO4 was analyzed by FT-IR, XPS, and SEM, which was similar to that of the fresh one. The FT-IR (Fig. 2a) and XPS (Fig. 1) of the recovered and fresh Poly(VBS-DVB)HSO4 had no significant changes. For SEM results, both the recovered catalyst and the fresh catalyst (Fig. 4) maintained a spherical structure and no significant changes in the internal structure. It was demonstrated that Poly(VBS-DVB)HSO4 was a catalyst with a stable structure and excellent catalytic performance.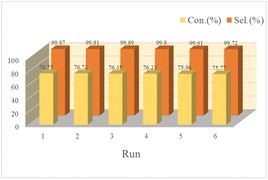 | ||
| Fig. 6 Catalytic reusability of Poly(VBS-DVB)HSO4 for hydrolysis of cyclohexanone oxime under optimal conditions. | ||
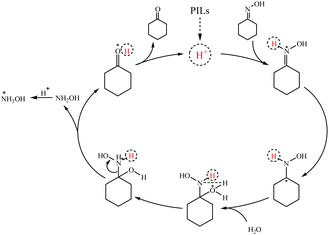
Based on previous studies on the hydrolysis of oxime.47,48 The possible mechanism of PILs catalyzed hydrolysis was also proposed as shown in Scheme 2. The reaction started with H+ attacking the Brønsted acid site on the nitrogen atom of cyclohexanone oxime, followed by water attacking the α-carbon atom,49 thus breaking the C![[double bond, length as m-dash]](https://www.rsc.org/images/entities/char_e001.gif) N bond. And then, hydrogen protons were transferred from water to nitrogen atoms.50 In addition, the transition state further split into cyclohexanone(Fig. S1†),51 H+ and hydroxylamine52 through C–N single bond breakage. The hydroxylamine was protonated to hydroxylamine salts (qualitative by potassium permanganate redox titration).
N bond. And then, hydrogen protons were transferred from water to nitrogen atoms.50 In addition, the transition state further split into cyclohexanone(Fig. S1†),51 H+ and hydroxylamine52 through C–N single bond breakage. The hydroxylamine was protonated to hydroxylamine salts (qualitative by potassium permanganate redox titration).
3.4. Catalytic activity of Poly(VBS-DVB)HSO4 for the hydrolysis of different ketoximes
Based on the above results, a series of ketoximes were also examined including acetone oxime, butanone oxime, cyclopentanone oxime and acetophenone oxime. Table S6† gives the results. The experimental results revealed that Poly(VBS-DVB)HSO4 exhibited excellent catalytic performance in all the hydrolysis reactions. The conversion of ketoxime was not less than 80.44%.4. Conclusions
To sum up, in this paper, mesoporous acidic PILs were synthesized by free radical copolymerization of DVB and ILs. These materials were used as catalysts for hydrolysis of cyclohexanone oxime. The preparation conditions for the maximum conversion of cyclohexanone oxime were explored, and the maximum hydrolysis conversion was obtained by the Box–Behnken design. The optimized reaction conditions determined by RSM were catalyst amount 2.6 g, water consumption 61 mL, conducted at 65 °C for 1 h, at which the reaction conversion reached 77.23%. The Poly(VBS-DVB)HSO4 catalyst exhibited excellent catalytic activity, good structural stability and easy recovery property. Additionally, a possible reaction pathway involving hydrogen protons was proposed for the present hydrolysis. Moreover, a series of ketoximes were also examined including acetone oxime, butanone oxime, cyclopentanone oxime and acetophenone oxime over Poly(VBS-DVB)HSO4 catalyst. The results also showed excellent catalytic performance. And the conversion of ketoxime was not less than 80.44%. It provides a bright future for similar ketone oxime hydrolysis reactions.Author contributions
Shanshan Zhao: methodology, formal analysis, data curation, writing – original draft, writing – review & editing. Zhengxiang Ma: formal analysis, methodology, supervision. Peng Cheng: formal analysis, supervision. Yanji Wang: resources, formal analysis. Xinqiang Zhao: resources, supervision. Qiusheng Yang: resources, supervision. Junqi Zhang: supervision. Dongsheng Zhang: conceptualization, validation, methodology, writing – review & editing, project administration, funding acquisition.Conflicts of interest
There are no conflicts to declare.Acknowledgements
This work is supported by the National Natural Science Foundation of China (21878069, 21646015, U20A20152) and the Natural Science Foundation of Hebei Province (B2016202335).Notes and references
- J. Zheng, Z. Li, D. Zhang, Q. Yang, X. Zhao, B. Zhang and Y. Wang, J. Mol. Liq., 2022, 348, 118407 CrossRef CAS.
- H. Ichihashi and H. Sato, Appl. Catal., A, 2001, 221, 359–366 CrossRef CAS.
- D. Han, J. Wan, Y. Ma, Y. Wang, M. Huang, Y. Chen, D. Li, Z. Guan and Y. Li, Chem. Eng. J., 2014, 256, 316–323 CrossRef CAS.
- M. Takhi, C. Murugan, M. Munikumar, K. M. Bhaskarreddy, G. Singh, K. Sreenivas, M. Sitaramkumar, N. Selvakumar, J. Das, S. Trehan and J. Iqbal, Bioorg. Med. Chem. Lett., 2006, 16, 2391–2395 CrossRef CAS.
- F. Raschig, US Pat., US1010177, 1911.
- A. van Rooij, Ambix, 2007, 54, 192–210 CrossRef CAS.
- J. Kurt and W. Karl, US Pat., US27119778, 1955.
- Y. Xu, Z. Li, L. Gao, D. Zhang, X. Zhao, S. Wang and Y. Wang, Ind. Eng. Chem. Res., 2015, 54, 1068–1073 CrossRef.
- F. Zhao, K. You, C. Peng, S. Tan, R. Li, P. Liu, J. Wu and H. Luo, Chem. Eng. J., 2015, 272, 102–107 CrossRef.
- C. Dong, K. Wang, J. Zhang and G. Luo, Chem. Eng. Sci., 2015, 126, 633–640 CrossRef.
- L. David, R. Arturo and S. Aurora, Ind. Eng. Chem. Res., 2016, 55, 6586–6594 CrossRef.
- C. Q. Chu, H. T. Zhao, Y. Y. Qi and F. Xin, J. Mol. Model., 2013, 19, 2217–2224 CrossRef CAS.
- M. Deetlefs, M. Fanselow and K. R. Seddon, RSC Adv., 2016, 6, 4280–4288 RSC.
- P. N. Reddy, P. Padmaja, B. V Subba Reddy and G. Rambabu, RSC Adv., 2015, 5, 51035–51054 RSC.
- K. Vijayakrishna, D. Mecerreyes, Y. Gnanou and D. Taton, Macromolecules, 2009, 42, 5167–5174 CrossRef CAS.
- V. V Phatake, T. A. Gokhale and B. M. Bhanage, J. Mol. Liq., 2021, 345, 117008 CrossRef.
- J. G. Huddleston, A. E. Visser, W. M. Reichert, H. D. Willauer, G. A. Broker and R. D. Rogers, Green Chem., 2001, 3, 156–164 RSC.
- Q. Zhang, S. Zhang and Y. Deng, Green Chem., 2011, 13, 2619–2637 RSC.
- N. A. Noorhisham, D. Amri, A. H. Mohamed, N. Yahaya, N. M. Ahmad, S. Mohamad, S. Kamaruzaman and H. Osman, J. Mol. Liq., 2021, 326, 115340 CrossRef.
- G. Kaur, H. Kumar and M. Singla, J. Mol. Liq., 2022, 351, 118556 CrossRef.
- H. Xu, J. Zhang, D. Zhang, Y. Guo and F. Wu, Fuel, 2021, 288, 119655 CrossRef.
- D. S. Karousos, O. C. Vangeli, C. P. Athanasekou, A. A. Sapalidis, E. P. Kouvelos, G. E. Romanos and N. K. Kanellopoulos, Chem. Eng. J., 2016, 306, 146–154 CrossRef CAS.
- J. Cheng, Y. Li, L. Hu, J. Liu, J. Zhou and K. Cen, Fuel Process. Technol., 2018, 172, 216–224 CrossRef CAS.
- L. Zhang, H. Yang and H. Zhang, Microporous Mesoporous Mater., 2022, 342, 112118 CrossRef CAS.
- K. Sun, Y. Shi, W. Xu, N. Potter, Z. Li and J. Zhu, Chem. Eng. J., 2017, 313, 336–344 CrossRef CAS.
- S. Wang, J. Liu, P. Cheng, Z. Li, D. Zhang, Q. Yang, X. Zhao and Y. Wang, Z. Anorg. Allg. Chem., 2021, 647, 742–750 CrossRef CAS.
- Q. Wang, M. Ge, X. Guo, Z. Li, A. Huang, F. Yang and R. Guo, Appl. Catal., A, 2021, 626, 118350 CrossRef CAS.
- G. Durga, P. Kalra, V. K. Verma, K. Wangdi and A. Mishra, J. Mol. Liq., 2021, 335, 116540 CrossRef.
- G. Wang, S. Zhuo, L. Wang, S. Fang and Y. Lin, Sol. Energy, 2012, 86, 1546–1551 CrossRef.
- B. Lin, L. Qiu, J. Lu and F. Yan, Chem. Mater., 2010, 22, 6718–6725 CrossRef.
- M. Li, L. Wang, B. Yang, T. Du and Y. Zhang, Electrochim. Acta, 2014, 123, 296–302 CrossRef.
- A. Blasig, J. Tang, X. Hu, Y. Shen and M. Radosz, Fluid Phase Equilib., 2007, 256, 75–80 CrossRef CAS.
- P. G. Mineo, L. Livoti, M. Giannetto, A. Gulino, S. Lo Schiavo and P. Cardiano, J. Mater. Chem., 2009, 19, 8861–8870 RSC.
- Y. Xiong, Y. Wang, H. Wang and R. Wang, Polym. Chem., 2011, 2, 2306–2315 RSC.
- P. Zhao, Y. Leng and J. Wang, Chem. Eng. J., 2012, 204, 72–78 CrossRef.
- E. H. Jeon, M. D. Nguyen, C. Il Chung, Y. J. Kim, H. S. Kim, M. Cheong and J. S. Lee, Appl. Catal., A, 2007, 332, 65–69 CrossRef CAS.
- X. Lin, M. Li, Z. Chen, M. Li, Y. Huang and T. Qiu, J. Cleaner Prod., 2021, 292, 125967 CrossRef CAS.
- A. Gopakumar, L. Lombardo, Z. Fei, S. Shyshkanov, D. Vasilyev, A. Chidambaram, K. Stylianou, A. Züttel and P. J. Dyson, J. CO2 Util., 2020, 41, 101240 CrossRef CAS.
- N. Sahiner, A. O. Yasar and N. Aktas, Int. J. Hydrogen Energy, 2016, 41, 20562–20572 CrossRef.
- J. Li, Y. Zhou, D. Mao, G. Chen, X. Wang, X. Yang, M. Wang, L. Peng and J. Wang, Chem. Eng. J., 2014, 254, 54–62 CrossRef.
- S. M. Ghoreishian, K. Badii, M. Norouzi and K. Malek, Appl. Surf. Sci., 2016, 365, 252–262 CrossRef.
- D. R. Pinheiro, R. de F. Neves and S. P. A. Paz, Microporous Mesoporous Mater., 2021, 323, 111250 CrossRef.
- H. Gao, Y. Zhou, X. Sheng, S. Zhao, C. Zhang, J. Fang and B. Wang, Appl. Catal., A, 2018, 552, 138–146 CrossRef CAS.
- F. Liu, L. Wang, Q. Sun, L. Zhu, X. Meng and F.-S. Xiao, J. Am. Chem. Soc., 2012, 134, 16948–16950 CrossRef CAS PubMed.
- Y. Feng, L. Li, X. Wang, J. Yang and T. Qiu, Energy Convers. Manage., 2017, 153, 649–658 CrossRef CAS.
- M. D. Green, D. Salas-de la Cruz, Y. Ye, J. M. Layman, Y. A. Elabd, K. I. Winey and T. E. Long, Macromol. Chem. Phys., 2011, 212, 2522–2528 CrossRef CAS.
- B. J. Gregory, R. B. Moodie and K. Kinetics, J. Chem. Soc. B, 1970, 1687–1692 RSC.
- R. A. M. O'Ferrall, D. M. O'Brien and D. G. Murphy, Can. J. Chem., 2000, 78, 1594–1612 CrossRef.
- F. Zhao, K. You, R. Li, S. Tan, P. Liu, J. Wu, Q. Ai and H. Luo, Ind. Eng. Chem. Res., 2015, 54, 819–823 CrossRef CAS.
- K. Hyodo, K. Togashi, N. Oishi, G. Hasegawa and K. Uchida, Green Chem., 2016, 18, 5788–5793 RSC.
- H. Egberink and C. Van Heerden, Anal. Chim. Acta, 1980, 118, 359–368 CrossRef.
- M. F. Haley and K. Yates, J. Org. Chem., 1987, 52, 1817–1824 CrossRef.
Footnote |
| † Electronic supplementary information (ESI) available. See DOI: https://doi.org/10.1039/d2ra06422g |
| This journal is © The Royal Society of Chemistry 2022 |

