 Open Access Article
A novel rose-with-thorn ternary MoS2@carbon@polyaniline nanocomposite as a rechargeable magnesium battery cathode displaying stable capacity and low-temperature performance†
Jinyun
Liu‡
 *a,
Yan
Zhong‡
a,
Xuelian
Li
a,
Tongxin
Ying
a,
Tianli
Han
*a and
Jinjin
Li
 *b
*b
aKey Laboratory of Functional Molecular Solids, Ministry of Education, Anhui Provincial Engineering Laboratory for New-Energy Vehicle Battery Energy-Storage Materials, College of Chemistry and Materials Science, Anhui Normal University, Wuhu, Anhui 241002, P. R. China. E-mail: jyliu@ahnu.edu.cn; hantianli@ahnu.edu.cn
bNational Key Laboratory of Science and Technology on Micro/Nano Fabrication, Department of Micro/Nano-electronics, Shanghai Jiao Tong University, Shanghai 200240, P. R. China. E-mail: lijinjin@sjtu.edu.cn
First published on 20th August 2021
Abstract
Developing high-performance cathode materials for magnesium (Mg) batteries is of great significance. Here, a novel rose-with-thorn ternary MoS2@C@polyaniline (PANI) nanocomposite composed of carbon and PANI nanoneedles co-coated on rose-like MoS2 is developed. The conductive PANI needles on the surface of MoS2 improve the conductivity, and the inner MoS2 is wrapped by a carbon layer which is beneficial for the aniline coating. The MoS2@C@PANI-based Mg battery cathode displays a good capacity of 114 mA h g−1 after 100 cycles, and a recoverable rate-performance after repeated measurements. In addition, a stable capacity of 105 mA h g−1 when cycled at a low temperature of −5 °C is also achieved, indicating good potential for applications.
Introduction
Recently, magnesium (Mg) batteries have attracted much attention due to their outstanding advantages including no dendrite growth and stable performance.1–3 However, current Mg batteries still have some shortcomings, including slow ion transport, easy collapse of the structure, difficulty in deintercalation and insertion of Mg ions and the insufficient performance of Mg batteries in some special application conditions, such as different temperatures.4,5 In order to address these problems, a large number of studies have been conducted.6,7 In view of the low crystallinity of the cathode materials, even small changes in the preparation process will cause huge differences in the performance. Studies have been conducted to accelerate the extraction of Mg ions to promote the performance of batteries. For example, Zuo et al. used a spinel Mg(Mg0.5V1.5)O4 cathode to accelerate the Mg2+ ion extraction kinetics.8 The capacity was 102 mA h g−1 over 100 cycles. Du et al. used a simple template-directed selenization reaction to construct thin-film-assembled hollow CuSe nanocubes at room temperature.9 Copper selenide Cu2−xSe was synthesized by a solution method, and the copper ions in the sublattice based on Se-could be reversibly replaced by Mg2+ ions.10 Because of the same face-centered cubic Se2− sublattice, Cu2−xSe and MgSe unit cell sizes are similar and the energy barrier is low, which improves the cycling stability. Based on the above research, it is found that multiple nanocomposites would improve the performance of the cathode, thereby improving the cycle capacity and stability.In recent years, biomimetic technology has been introduced into the research of rechargeable batteries, which improves the capacity and cycle life. For example, Shen et al. developed a composite material with a cucumber-like structure,11 which was characterized by flexibility and self-support. It buffered the volumetric change and improved the conductivity. Tao et al. used kapok fibers to synthesize fish-scale carbon nanosheets for lithium-sulfur batteries,12 which have an excellent capacity retention rate of up to 95.4% after 90 cycles at 0.4 A g−1. Zuo et al. synthesized a flower-like structure of V2O5@polyaniline (PANI), by insertion of aniline into the V2O5 interlayer,13 resulting in the composite having a larger gap between layers, thereby improving the battery performance. Inspired by the ultra-strong capillarity of wood's aligned hierarchical microchannels, Miao et al. developed a nanofibrous organic cathode for sodium ion batteries, which displayed rapid ionic/electronic transport properties and ultrafast reaction kinetics.14 In addition, an agaric-like anode of porous carbon decorated with MoO2 nanoparticles was reported, which had a good rate capability, high capacity and long cycling lifespan for lithium and sodium storage.15 From these findings, we can see that the biomimetic structure has great potential for developing high-performance Mg batteries. However, the design and performance enhancement mechanism of biomimetic structures still remain as challenges.
Here, inspired by the special structure of rose, we developed a novel ternary nanocomposite with a rose-with-thorn structure. The carbon-coated rose-like molybdenum disulfide (MoS2) is then coated with thorn-shaped PANI, forming a MoS2@C@PANI nanocomposite, as illustrated in Fig. 1. The preparation process is presented in the ESI.† The conductive PANI nanoneedles in situ grown on the surface can improve the conductivity; the inner MoS2 is wrapped by a carbon layer, which is beneficial for the polymer coating. The results show that the cathode has a high Mg-storage performance and a good stability at low temperatures.
Results and discussion
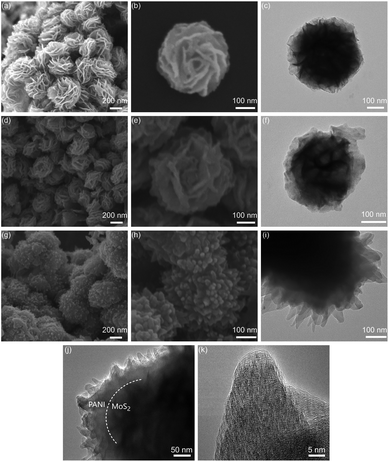
Fig. 2a and b show the scanning electron microscopy (SEM) images of flower-shaped MoS2 with a size of about 400–500 nm. The transmission electron microscopy (TEM) image in Fig. 2cshows the flower structure, and the petals are layered. The coated carbon layer makes the surface of MoS2 rough, as shown in Fig. 2d and e. The TEM image in Fig. 2fshows the coating of the carbon layer. The carbon layer enables nanoneedle-like PANI to be efficiently coated. The SEM image of MoS2@C@PANI is shown in Fig. 2g and h and the TEM image is shown in Fig. 2i. High-resolution TEM (HRTEM) images are displayed in Fig. 2j and k. The thickness of the PANI layer is about 40–50 nm; however the crystalline lattice of the inner MoS2 is not clear because of the PANI coating. The SEM and elemental mapping images displayed in Fig. 3 verify the uniform distribution of Mo, S, N and C.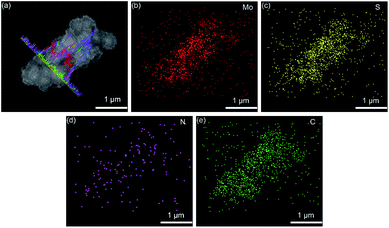 | ||
| Fig. 3 (a) SEM and (b–e) elemental mapping images of MoS2@C@PANI. Line-scan profiles are inserted in (a). | ||
Fig. 4a shows the X-ray diffraction (XRD) patterns. The diffraction peaks are assigned to MoS2 (JCPDS card no. #75-1539). The disappearance of the peak at about 15° was caused by the carbon coating, and the broad peak at 17.5° is ascribed to carbon. In addition, the peak at about 58° is not clear for the composite; instead, a new peak appears, which is indexed to the crystal plane (008) of MoS2. The energy dispersive X-ray spectroscopy (EDS) spectrum (Fig. 4b) confirms the elements, which are consistent with the mapping images.16 Thermogravimetric analysis (TGA) curves are shown in Fig. 4c. The weight loss of the MoS2@C@PANI composite between 300 and 380 °C is attributed to the weight loss after oxidation of MoS2. The loss from 380 to 450 °C is ascribed to C and PANI, which is about 33% calculated from 55 − 22%. So, from the TGA curve of the composite, the percentage of MoS2 is calculated to be 1 − 33 − 10% (moisture) ≈57%.
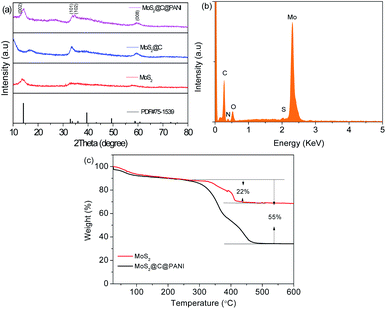 | ||
| Fig. 4 (a) XRD patterns of MoS2, MoS2@C, and MoS2@C@PANI. (b) EDS spectrum of MoS2@C@PANI. (c) TGA curve of bare MoS2 and MoS2@C@PANI. | ||
Fig. 5a shows the Fourier transform infrared spectroscopy (FTIR) spectra. The peak at 1569 cm−1 is from C–C.17 The 1116 and 799 cm−1 peaks are indexed to C–H bending.18 The Raman spectra in Fig. 5bshow prominent Raman-active peaks. The peaks of sulfide are observed at 403 and 376 cm−1. The peaks at 1365 and 1587 cm−1 are assigned to the D-band and G-band of carbon, respectively. In MoS2@C@PANI, the peaks at 1587, 1485, 1324, 1162 and 780 cm−1 are from C–C.19 The peaks at 1384 and 1162 cm−1 are ascribed to C–N and C–H, respectively, which verify PANI.20Fig. 6 shows the X-ray photoelectron spectroscopy (XPS) spectra. The survey spectrum in Fig. 6a verifies the composition. The Mo 3d spectrum is shown in Fig. 6b. There are two peaks at 228.8 and 231.7 eV which are attributed to Mo 3d3/2 and Mo 3d5/2, respectively.21 A minor peak at 225.5 eV shows the presence of S 2s.22 In Fig. 6c, the peaks are indexed to S 2p3/2 and S 2p1/2.23 In Fig. 6d, the N 1s spectrum is deconvoluted into three peaks at 397.5, 398.5, and 400.5 eV.24 The peaks at 284.0, 285.1, and 288.0 eV are assigned to C–C, C–OH, and C![[double bond, length as m-dash]](https://www.rsc.org/images/entities/char_e001.gif) O,25 respectively, as shown in Fig. 6e.
O,25 respectively, as shown in Fig. 6e.
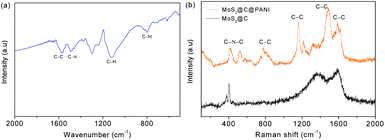 | ||
| Fig. 5 (a) FTIR spectrum of MoS2@C@PANI. (b) Raman spectra of bare MoS2 and the MoS2@C@PANI composite. | ||
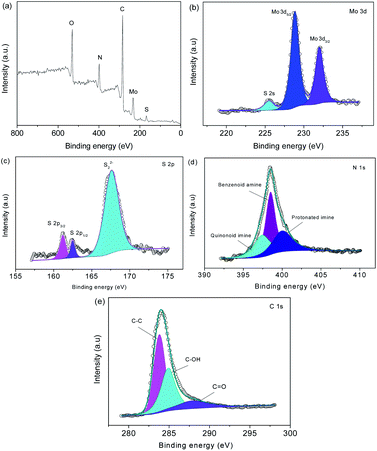 | ||
| Fig. 6 (a) XPS survey spectrum, and (b) Mo 3d, (c) S 2p, (d) N 1s, and (e) C 2p spectra of MoS2@C@PANI. | ||
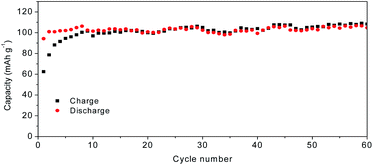
Fig. 7a shows the charge–discharge curves of MoS2@C@PANI cycled at 100 mA g−1. As shown in Fig. 7b, when cycled at 100 mA g−1, the capacity is 114 mA h g−1 after 100 cycles. Moreover, the coulombic efficiency exceeds 99%. Compared to pure MoS2, it shows a better cycling performance. It is noted that the PANI coating in the composite system also contributes to the capacity,26 which improves the overall performance. When compared to some other cathodes, the developed MoS2@C@PANI is also competitive, as shown in Table S1 (ESI†). Fig. 7c shows the CV profile of the MoS2@C@PANI cathode. The anodic peaks around 0.6 to 1.2 and 1.9 V are ascribed to Mg2+ deintercalation, and the cathodic peaks at about 0.5, 1.25 and 1.75 V indicate the corresponding intercalation of Mg2+.27 The rate-performance at 0.1, 0.3, 0.5, and 1 A g−1 is displayed in Fig. 7d. It was repeatedly measured three times. The discharge capacity recovered to 143 mA h g−1 once the rate returned to 0.1 A g−1. The battery after the high current density impact can maintain the capacity without obvious decrease. Fig. 8 shows the capacity at a low temperature of −5 °C. The initial Mg-storage capacity is relatively low, but it is stable. After cycling 60 times at 0.1 A g−1, the capacity is 105 mA h g−1. Furthermore, cycling at −10 °C (Fig. S1, ESI†) shows a capacity of about 98 mA h g−1, indicating potential for use under cold conditions. The decreased capacity is ascribed to the reduced activity of electrode materials and the reaction kinetics of ions and electrolyte.28–30
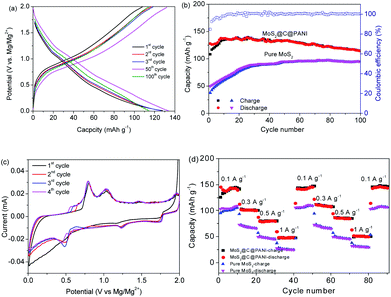 | ||
| Fig. 7 (a) Charge–discharge curves of MoS2@C@PANI at 0.1 A g−1. (b) Capacities and coulombic efficiency. (c) CV curves cycled at 0.1 mA s−1. (d) Rate-performance. | ||
Fig. 9a shows a series of CV curves which show that the peak position remains stable. Fig. 9b is obtained by fitting a qualitatively deduced charge storage equation I(v) = avb,26 where I stands for the maximum current.31 The b of peak 1 and peak 2 is 0.58 and 0.76, respectively, indicating that charging and discharging are mainly controlled by the capacitance. On the basis of i = k1v + k2v1/2, where k1v/i and k2v1/2/i are the capacitive and diffusion-controlled processes,32 respectively, the contribution ratios are calculated (Fig. 9c). When the scan rates increase, the capacitive process increases. Fig. 10a and b show the SEM images of post-cycled MoS2@C@PANI. This indicates that the composite remains robust after cycling 100 times. Fig. 10c shows the TEM image after 100 cycles, which further confirms that the structure remains stable after the charge–discharge cycles. The stability would be useful for constructing some dual-ion batteries. For example, a series of Ni/Zn–CoS2@C and ternary metal oxide-based Mg–Li ion batteries displayed good stability.33,34
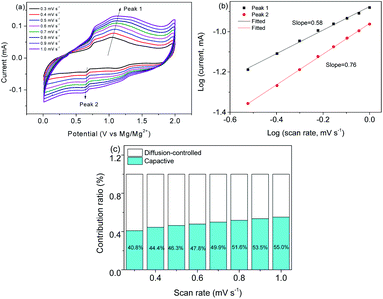 | ||
| Fig. 9 (a) CV curves at different rates. (b) Log(v) to log(i) linear analysis. (c) Contribution ratios at different scan rates. | ||
Conclusions
In summary, we present a novel rose-with-thorn ternary MoS2@C@PANI nanocomposite by coating carbon and PANI nanoneedles on rose-like MoS2. The conductive PANI would enhance the conductivity of the system; MoS2 is coated and protected by the coating, which enhances the electrochemical properties. The MoS2@C@PANI-based Mg battery cathode shows a stable capacity of 114 mA h g−1 when cycled 100 times. Moreover, the cathode shows a recoverable rate-performance. At −5 °C, a capacity of 105 mA h g−1 is maintained, which indicates potential for use under cold conditions. It is expected that the biomimetic design and good performance presented here could be used for developing many other energy-storage materials and systems.Conflicts of interest
There are no conflicts to declare.Acknowledgements
This work was supported by the Science and Technology Major Project of Anhui Province (18030901093), Key Research and Development Program of Wuhu (2019YF07), Natural Science Research Project for Universities in Anhui Province (KJ2018ZD034, KJ2019A0502), Foundation of Anhui Laboratory of Molecule-Based Materials (FZJ21012), and the National Natural Science Foundation of China (21776121).Notes and references
- J. Yang, J. Wang, X. Dong, L. Zhu, D. Hou, W. Zeng and J. Wang, Appl. Surf. Sci., 2021, 544, 148775 CrossRef CAS.
- F. Bella, S. D. Luca, L. Fagiolari, D. Versaci, J. Amici, C. Francia and S. Bodoardo, Nanomaterials, 2021, 11, 810 CrossRef CAS PubMed.
- M. Rashad, H. Z. Zhang, M. Asif, K. Feng, X. F. Li and H. M. Zhang, ACS Appl. Mater. Interfaces, 2018, 10, 4757 CrossRef CAS PubMed.
- N. Narumoto, N. Okamoto and T. Saito, J. Mater. Sci., 2021, 32, 9990–9997 CAS.
- R. Shah, V. Mittal, E. Matsil and A. Rosenkranz, Adv. Mech. Eng., 2021, 13, 16878140211003398 CAS.
- W. Zhang, Y. Li, T. Lv, W. Liu, Y. Luo, R. Guo, H. Pei, C. Lai and J. Xie, J. Electrochem. Soc., 2021, 168, 030505 CrossRef CAS.
- X. Lin, J. Liu, H. Zhang, Y. Zhong, M. Zhu, T. Zhou, X. Qiao, H. Zhang, T. Han and J. Li, Adv. Sci., 2021, 8, 2002298 CrossRef CAS PubMed.
- C. Zuo, W. Tang, B. Lan, F. Xiong, H. Tang, S. Dong, W. Zhang, C. Tang, J. Li, Y. Ruan, S. Xi, Q. An and P. Luo, Chem. Eng. J., 2021, 405, 127005 CrossRef CAS.
- C. Du, W. Younas, Z. Wang, X. Yang, E. Meng, L. Wang, J. Huang, X. Ma, Y. Zhu and C. Cao, J. Mater. Chem. A, 2021, 9, 3648–3656 RSC.
- X. Xue, R. Chen, X. Song, A. Tao, W. Yan, W. Kong and Z. Jin, Adv. Funct. Mater., 2021, 31, 2009394 CrossRef CAS.
- K. Shen, Z. Zhang, S. Wang, Q. Ru, L. Zhao, L. Sun, X. Hou and F. Chen, Energy Fuels, 2020, 34, 8987–8992 CrossRef CAS.
- X. Tao, J. Zhang, Y. Xia, H. Huang, J. Du, H. Xiao, W. Zhang and Y. Gan, J. Mater. Chem. A, 2014, 2, 2290–2296 RSC.
- C. Zuo, Y. Xiao, X. Pan, F. Xiong, W. Zhang, J. Long, S. Dong, Q. An and P. Luo, ChemSusChem, 2021, 14, 2093–2099 CrossRef CAS PubMed.
- G. Y. Zhou, L. L. Mo, C. Y. Zhou, Y. Wu, F. L. Lai, Y. Lv, J. M. Ma, Y. E. Miao and T. X. Liu, Chem. Eng. J., 2021, 420, 127597 CrossRef CAS.
- C. X. Hou, W. Y. Yang, X. B. Xie, X. Q. Sun, J. Wang, N. Naik, D. Pan, X. M. Mai, Z. H. Guo, F. Dang and W. Du, J. Colloid Interf. Sci., 2021, 596, 396 CrossRef CAS PubMed.
- H. Sopha, A. T. Tesfaye, R. Zazpe, J. Michalicka, F. Dvorak, L. Hromadko, M. Krbal, J. Prikryl, T. Djenizian and J. M. Macak, FlatChem, 2019, 17, 100130 CrossRef CAS.
- V. Panwar and S. L. Jain, Mater. Sci. Eng. C, 2019, 99, 191–201 CrossRef CAS PubMed.
- S. Wang, F. Liu, C. Gao, T. Wan, L. Wang, L. Wang and L. Wang, Chem. Eng. J., 2019, 370, 322–329 CrossRef CAS.
- K. Zhang, Y. Xu, Y. Lu, Y. Zhu, Y. Qian, D. Wang, J. Zhou, N. Lin and Y. Qian, J. Mater. Chem. A, 2016, 4, 6404–6410 RSC.
- M. Ali, R. C. Guzman, O. Cojocari, S. Nellen, G. Santamaría, L. E. Garcia-Munoz, D. Segovia-Vargas, B. Globisch and G. Carpintero, J. Infrared, Millimeter, Terahertz Waves, 2019, 40, 688–695 CrossRef.
- C. Lv, S. Li, Y. Che, H. Chen, Y. Shu, J. He and J. Song, Sep. Purif. Technol., 2021, 258, 118048 CrossRef CAS.
- Y. Tian, M. Zhou, Y. Pan, X. Du and Q. Wang, Chem. Eng. J., 2021, 403, 126361 CrossRef CAS.
- Z. Wang, J. Zhang, T. Wen, X. Liu, Y. Wang, H. Yang, J. Sun, J. Feng, S. Dong and J. Sun, Sci. Total Environ., 2020, 699, 134341 CrossRef CAS PubMed.
- J. C. Wu, S. S. Chen, T. C. Yu, K. C. W. Wu and C. H. Hou, Sep. Purif. Technol., 2021, 254, 117561 CrossRef CAS.
- Z. Huang, L. Shi, Y. Muhammad and L. Li, J. Colloid Interface Sci., 2021, 586, 423–432 CrossRef CAS PubMed.
- C. L. Zuo, Y. Xiao, X. J. Pan, F. Y. Xiong, W. W. Zhang, J. C. Long, S. J. Dong, Q. Y. An and P. Luo, ChemSusChem, 2021, 14, 2093 CrossRef CAS PubMed.
- L. Cui, L. Zhou, Y. M. Kang and Q. An, ChemSusChem, 2020, 13, 1071–1092 CrossRef CAS PubMed.
- M. Asif, S. Kilian and M. Rashad, Energy Storage Materials, 2021, 42, 129 CrossRef.
- M. Rashad, H. Z. Zhang, X. F. Li and H. M. Zhang, J. Mater. Chem. A, 2019, 7, 9968 RSC.
- M. Rashad and M. Asif, J. Energy Chem., 2021, 56, 383 CrossRef.
- X. Pu, T. Song, L. Tang, Y. Tao, T. Cao, Q. Xu, H. Liu, Y. Wang and Y. Xia, J. Power Sources, 2019, 437, 226917 CrossRef CAS.
- A. Sihag, Z. L. Xie, H. V. Thang, C. L. Kuo, F. G. Tseng, M. S. Dyer and H. Y. T. Chen, J. Phys. Chem. C, 2019, 123, 25618–25627 CrossRef CAS.
- M. Asif, M. Rashad and Z. Ali, Nanoscale, 2020, 12, 14267 RSC.
- M. Asif, M. Rashad, Z. Ali and I. Ahmed, Nanoscale, 2020, 12, 924 RSC.
Footnotes |
| † Electronic supplementary information (ESI) available: Supplementary figures and table. See DOI: 10.1039/d1na00445j |
| ‡ These authors contributed equally to this work. |
| This journal is © The Royal Society of Chemistry 2021 |


