 Open Access Article
Valorisation of used lithium-ion batteries into nanostructured catalysts for green hydrogen from boranes†
Caspar
de Bruin-Dickason
a,
Serhiy
Budnyk
b,
Jędrzej
Piątek
a,
István-Zoltán
Jenei
a,
Tetyana M.
Budnyak
 a and
Adam
Slabon
*a
aDepartment of Materials and Environmental Chemistry, Stockholm University, 10691 Stockholm, Sweden. E-mail: adam.slabon@mmk.su.se
bDepartment of Advanced Chemical Analysis, AC2T Research GmbH, Wiener Neustadt, Austria
First published on 7th September 2020
Abstract
Cobalt-based Li-ion batteries are produced globally on a massive scale, but most are discarded to landfill at the end of their useful lifetime. In this work, an efficient cobalt catalyst for the hydrolysis of sodium borohydride to dihydrogen was prepared from lithium ion battery waste, providing a second life for valuable minerals. This material is composed of a mixed metal cobalt–aluminium oxide supported on graphene, as elucidated by a combined FTIR, Raman, SEM, scanning transmission electron microscopy with electron energy loss spectroscopy (STEM-EELS) and energy-dispersive X-ray spectroscopy (EDS) study. The obtained metal oxide material, which exhibits an average oxidation state for Co of 2.45, is a languid catalyst at room temperature, but rapid hydrogen production of up to 49 L(H2) min−1 g−1(Co) was observed in catalytic runs heated to 70 °C. This carbon-supported cobalt catalyst is competitive with designed cobalt nanostructured catalysts prepared from pure precursors. This work is illustrative of the opportunities which arise when e-waste is utilised as a mineral resource within the scope of a circular economy.
Introduction
Energy storage technology plays a central role in enabling the movement towards decarbonising our world economy. In the pursuit of a green energy system, there is a steady increase in demand for lithium ion batteries (LIBs) to electrify the transportation sector and provide storage solutions for intermittently sourced renewable electricity.1 Despite the massive scale of production of LIBs, only a small portion is ever recycled. In the USA, only 5% of spent LIBs are recycled and the remainder goes to landfill where they are hazardous to the environment. Mineral recovery is infrequent as the economics of current recycling processes are challenging.2 There are ongoing efforts from both industry players and academia toward developing green, efficient processes to efficiently recover valuable elements such as Co, Li and Cu from battery waste.3–9 Recently, biomaterials such as lignin have received high interest for the sustainable recovery of relevant metals from active electrode materials.5Cobalt-containing oxides present in lithium ion battery cathodes are prominent in numerous other applications. Cobalt oxides are catalysts for processes such as electrochemical water splitting,10–13 or electrocatalytic water purification.14 Complementary to technology aiming to recover materials are approaches that enable the development of new products directly from waste.15 Relatively few studies have been conducted seeking to find new applications for battery waste. So far, it has been demonstrated that LiCOx from battery waste can be combined with graphene to prepare a highly efficacious lubricant additive,16 that supercapacitor electrodes can be prepared from scrapped LIB cathode materials,17,18 and that MnO2 from Li–MnO2 batteries is a potent catalyst for peroxymonosulfate degradation.19
To explore the possibility of preparing materials relevant to energy transformation directly from e-waste, we have prepared cobalt catalysts for NaBH4 hydrolysis using Co recovered from Li-ion battery cathodes. Hydrolysis of NaBH4 solutions to release hydrogen is accomplished according to Scheme 1, yielding 4 equivalents of H2 per NaBH4 molecule, thereby releasing up to 10.8 wt% H2. While the hydrolysis of NaBH4 is thermodynamically favourable, it is kinetically stable in alkaline solution. In other words, NaBH4 is sufficiently stable in the given timeframe for potential application as a hydrogen source for fuel cells. Hydrolysis (correspondingly, hydrogen evolution) of alkaline borohydride solutions can be readily controlled by the addition and subsequent removal of a solid catalyst.20
Cobalt oxides,21 borides,22 borates23 and Co–P materials (i.e., phosphates, phosphides and mixed phase materials)24 and mixed transition metal borides such as Co–M–B (M = W or Mo)25,26 are potent candidates for heterogeneous earth-abundant metal catalysed hydrogen production from inorganic boranes. These catalysts can be single-phase or alternatively a complex core–shell structure.24 Using a variegated cobalt precursor sourced from battery waste is expected to give rise to new structural diversity and potentially, catalytic properties contrasting those of systems prepared from pure precursors. These cobalt-based catalysts have proven to have similar efficacy at a much lower manufacturing cost point when compared to the precious metal catalysts initially investigated for this purpose. In this work, we have extended this principle by applying simple technology to recover cobalt from a potentially hazardous waste material. Direct treatment of the aqueous cobalt leachate with a sodium borohydride yields a useful catalyst for green hydrogen production. The catalytic and structural properties of this material are discussed herein.
Experimental
General comments
Graphene nanoplatelet aggregates (surface area = 500 m2 g−1) were purchased from Alfa Aesar and used as received. Other chemicals were obtained from various commercial sources and used as received. HTC-BG32100 batteries were obtained from the internal battery recycling service at MMK, Stockholm University. ATR-IR spectra were collected using a Varian 610-IR FTIR spectrometer. Raman spectra were collected using a LabRAM HR 800 Raman microscope equipped with an Nd-YAG laser (532 nm). SEM micrographs were taken using a JEOL JSM-7000F scanning electron microscope, and samples were supported on carbon (sample 1) or copper (1C) tape. STEM (scanning transmission electron microscope) images, EDS (energy-dispersive X-ray spectroscopy) and EELS (electron energy loss spectroscopy) spectra were collected from samples mounted on a holey carbon grid using a Thermo Fisher Scientific™ Themis Z microscope equipped with a SuperX EDX detector operated at 300 kV in the scanning TEM mode, and a Gatan imaging filter (Quantum ER) for EELS. Thermal analysis was performed on a PerkinElmer TGA 7 under a dynamic atmosphere of synthetic air under a heating rate of 10 K min−1. Powder X-ray diffraction (PXRD) data was collected using a X-Pert PANalytical diffractometer equipped with a fixed divergence 1/2° slit, a Cu W/Si mirror and a 10![[thin space (1/6-em)]](https://www.rsc.org/images/entities/char_2009.gif) mm mask as incident optics and a parallel plate collimator and a proportional detector as diffracted beam optics. Spectrophotometric analysis of cobalt(II) as 4-(2′-pyridylazo)resorcinol complexes were conducted using a photocolorimeter (WPA, S800) for point measurements at 500 nm in quartz cuvettes as described elsewhere.27 The elemental content of 1C was determined by ICP-OES (iCAP 7400 ICP-OES Duo, Thermo Fisher, Waltham, MA, USA) after microwave supported digestion treatment with nitric acid.
mm mask as incident optics and a parallel plate collimator and a proportional detector as diffracted beam optics. Spectrophotometric analysis of cobalt(II) as 4-(2′-pyridylazo)resorcinol complexes were conducted using a photocolorimeter (WPA, S800) for point measurements at 500 nm in quartz cuvettes as described elsewhere.27 The elemental content of 1C was determined by ICP-OES (iCAP 7400 ICP-OES Duo, Thermo Fisher, Waltham, MA, USA) after microwave supported digestion treatment with nitric acid.
Battery workup and preparation of recovery solution
A HTC-BG32100 mobile phone battery was discharged by immersion in 1 M NaCl solution for 30 minutes. The battery casing was then removed manually and cathode powder and some associated plastic was collected (4.5 g) (Fig. S1, ESI†). This material was added portion-wise to 200 mL of H2O, resulting in gas evolution. Given the construction of Li-based batteries and potential presence of lithium metal agglomeration, related reactive lithium species, and/or volatile electrolytes this step should be preferentially performed with care under the fumehood. The resultant slurry was stirred magnetically for 30 m, after which the bubbling had ceased. 100 mL of 4 M HCl solution was added in 10 × 10 mL portions, accompanied by gas flow. The mixture was then heated to 80 °C. After 1 h, this mixture was filtered hot, to give a bright red solution. The cobalt recovery solution was made up to 300 mL with distilled water and stored for further experiments (Fig. S2, ESI†). Colourimetric assay; 11.4 g L−1 Co.Preparation of 1
10 mL of the cobalt recovery solution above (ca. 1.9 mmol Co) was treated with 1 M Na2CO3 solution until pH 6 was achieved. An ethanolic NaBH4 solution (700 mg, 18.7 mmol in 20 mL 70% EtOH/H2O) was added portionwise over 10 minutes, resulting in vigorous gas evolution. Although NaBH4 is reasonably stable in ethanol or water, the reduction step should be performed with care since the reaction is exothermic and leads to bubbles evolving from the solution. The slurry was stirred for a further 5 minutes, then allowed to stand for 15. Much of the solution was decanted off, and the remainder mixed with 20 mL of 50–50 EtOH/H2O. The mixture was then centrifuged and the golden-brown powder collected by filtration, and dried overnight at 60 °C to give 1 (92 mg, 41% (Co atom basis)). SEM-EDS [Co] = 52 wt%.Preparation of 1C
10 mL of the cobalt recovery solution above (ca. 3.2 mmol Co) was treated with 1 M Na2CO3 solution until pH 6 was achieved. After this, graphene nanoplatelet aggregates (50 mg) were introduced and the resultant slurry was stirred rapidly. An ethanolic NaBH4 solution (700 mg, 18.7 mmol in 20 mL 70% EtOH/H2O) was added portionwise over 10 minutes, resulting in vigorous gas evolution (caution – exothermic reaction, see above). The slurry was stirred for a further 5 minutes, then filtered. The black filtrate was washed with water (2 × 25 mL) and EtOH (2 × 25 mL). The filtrate was dried overnight at 60 °C to give 1C (456 mg, 97% (Co atom basis)). ICP [Co] = 24.5 wt%.Hydrogen evolution experiments
A 50 mL round bottom flask (RBF) was heated to the appropriate temperature in an oil bath. Once the temperature had stabilised, the RBF was loaded with 1 mg of the desired catalyst, and treated with either 1.45 mL or 10 mL of a freshly prepared aqueous solution of 0.5 M NaBH4 with 0.25 M NaOH. A gas adaptor was attached to the flask, and H2 was collected to an upturned measuring cylinder filled with water as described elsewhere. The experiments were filmed and then volume change with time was used to calculate the rates of catalysis in terms of V(H2)/time/mass of catalyst.Results and discussion
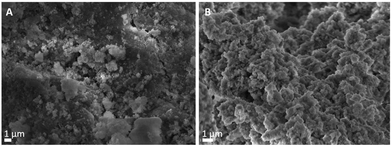
A working solution of cobalt ions were obtained by digesting manually separated battery cathode materials from discarded HTC smartphone batteries in 5 M HCl. The resultant solution contained ca. 11 g L−1 Co, as determined by colourimetric methods. To obtain catalyst candidates for borohydride hydrolysis, we targeted cobalt oxide nanoparticles either unsupported or supported on graphene nanoplatelets. Previous studies have demonstrated synergy between carbon scaffolds and cobalt nanoparticles as catalysts for these reactions,28 and have demonstrated that the reduction of cobalt salts with super-stoichiometric borohydride leads to small particle sizes and corresponding high catalytic activity.29 To prepare catalyst candidates, the battery extract solution was neutralised with Na2CO3, and the resultant solution was treated with an excess of sodium borohydride either with or without the addition of graphene platelets (with a surface area of 500 m2 g−1). Borate oxidation and ligand exchange in the absence of graphene yielded a small amount of an orange powder (1) consisting of metal oxide particles in a 46% yield on a Co atom basis. The addition of graphene substantially improved reaction yields; near quantitative precipitation of a black powder (1C) consisting of metal oxide particles supported on graphene plates was obtained (Scheme 2).Given the variegated composition of the battery extract, it was essential to thoroughly characterise 1 and 1C to understand their chemical and morphological character. 1 and 1C were characterised variously by SEM, STEM, PXRD, ICP-MS as well as FTIR and Raman spectroscopy. SEM micrographs (Fig. 1) reveal that 1 is composed of nanostructured particle μm clusters of a granular material, whereas 1C is an array of stacked graphene platelets with a lateral size of 100–200 μm, decorated with dispersed metal oxide particles. Based on the SEM images, it appears that metal oxide particles in 1C and 1 are of quite a different morphology, with smaller, powdery clusters present in 1C. ICP-MS analysis of a digested sample of 1C showed that the bulk composition includes by weight: 24.5% Co, 7.8% B and 3.26% Al. Li, Mg, Mn, Fe, and Ni were also detected but were each present at <0.01 wt%. B is super-stoichiometric to cobalt, the two are present in a 1.7![[thin space (1/6-em)]](https://www.rsc.org/images/entities/char_2009.gif) :
:![[thin space (1/6-em)]](https://www.rsc.org/images/entities/char_2009.gif) 1 ratio. This is indicative of the presence of extensive borate phases, as are frequently observed in cobalt materials prepared by borohydride reduction of cobalt salts.23
1 ratio. This is indicative of the presence of extensive borate phases, as are frequently observed in cobalt materials prepared by borohydride reduction of cobalt salts.23
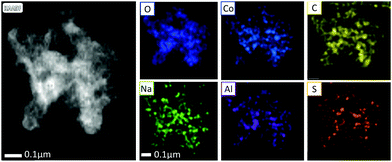
To further elucidate the composition of 1C, STEM EELS and EDS analysis were performed (Fig. 2). EDS indicated that the primary constituents of 1C were cobalt, oxygen and carbon, with some aluminium and sodium also present. EELS is more accurate for the quantification of low Z elements on the surface of samples. EELS analysis indicated the presence of Co, Li and F. Relative elemental proportions of C, O, F, Na, Al, S and Co are presented in Table 1. A comparison of L2 and L3 edges of Co (Fig. S4, ESI†) using a method developed by Tan et al.,30i.e., energy loss near edge structure (ELNES) fitting, indicated that the average oxidation state of Co is 2.45, indicating a mixture of Co2+ and Co3+ in 1C.
| Element | Atomic fraction (%) |
|---|---|
| C | 32 |
| O | 49 |
| F | 10 |
| Na | 2.7 |
| Al | 2.7 |
| S | 0.2 |
| Co | 4.5 |
Li is difficult to quantify by EELS in the presence of Co. The latter has an M edge at 60 eV, very close to the K edge of Li at 55 eV. As less than 0.1 wt% Li was detected by ICP-MS, EELS quantification of this element was not attempted. The relatively high portion of C detected arises from the necessity of choosing a site with only a very thin metal particle suspended on graphene. On an atom basis, the surface of 1C contains Co![[thin space (1/6-em)]](https://www.rsc.org/images/entities/char_2009.gif) :
:![[thin space (1/6-em)]](https://www.rsc.org/images/entities/char_2009.gif) F in a 1
F in a 1![[thin space (1/6-em)]](https://www.rsc.org/images/entities/char_2009.gif) :
:![[thin space (1/6-em)]](https://www.rsc.org/images/entities/char_2009.gif) 2 ratio, probably present in the form of Al–F or Co–F moieties. The origin of surface fluoride likely related to the reduction of residual PF6− electrolyte, or from polyvinylidene fluoride – a common binding agent in Li-ion battery cathodes.
2 ratio, probably present in the form of Al–F or Co–F moieties. The origin of surface fluoride likely related to the reduction of residual PF6− electrolyte, or from polyvinylidene fluoride – a common binding agent in Li-ion battery cathodes.
Cobalt borates are topical catalysts for borohydride reduction,10,23 so the presence of periodically related Lewis acidic Al sites in 1C may lead to enhanced catalytic activity. A dark field STEM micrograph of 1C is presented in Fig. 2, alongside elemental mapping from STEM-EDS. From the elemental maps, it is evident that Al, Co and O are distributed across the graphene substrate in small clusters, consistent with the small metal–oxide particles observed under SEM (Fig. 1). Notably, the presence of Mn or Ni were detected by either EELS or EDS, confirming that Co is the dominant transition metal component on the surface of the sample. Based on EELS, EDS and ICP-MS analysis, 1C can be described as mixed metal cobalt aluminium borate nanoparticles with fluoride decoration on the surface, supported on graphene.
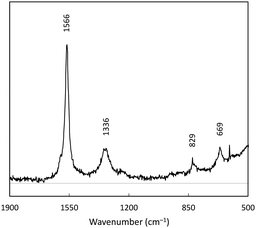
Spectroscopic analysis was performed to better understand the chemical makeup of 1C. The Raman spectrum of 1C was collected between 1800–400 cm−1, and featured four main bands (Fig. 3). D and G bands of graphene are evident at 1566 and 1336 cm−1; these correspond to aromatic in plane and out of plane vibration modes respectively.31 The prominence of the G band (out of plane) is indicative of lattice defects, indicating some amorphous character to the carbon after treatment with the battery leachate and borohydride. Additional bands at 829 and 699 cm−1 are tentatively assigned to various Co–O modes.
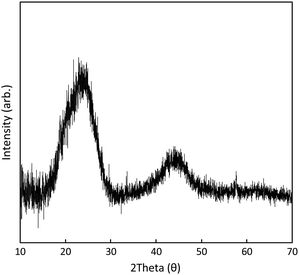
The PXRD pattern of 1C (Fig. 4) features broad peaks centred at θ = 23.7° (002) and 43.8° (101), characteristic of graphitic plates with disordered stacking.32 The position of the 002 peak corresponds to a interlayer d-spacing of 3.8 Å, signifying a lattice extension relative to pristine graphite (graphite features a d-spacing of ca. 3.3 Å). This is typical for graphene aggregates or reduced graphene oxide materials.33 No XRD reflection peaks were able to be unambiguously assignable to metal oxide phases. This originates from the lack of long-range order due to the low temperature of the catalyst synthesis. Consequently, no reflection peaks of potential metal oxide phases can be observed in the XRD patterns.
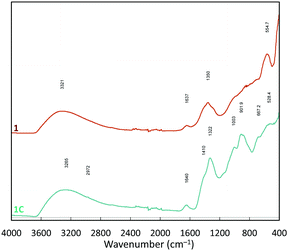
The FTIR-ATR (Fourier transform infrared – attenuated total reflectance) spectra of 1 and 1C are quite similar (Fig. 5). Both contain diagnostic bands arising from surface adsorbed water are evident at 3494 and 1640 cm−1, and doublets in regions associated with tetrahedral (1420–1320 cm−1) and trigonal borates (1000–905 cm−1),23 indicating the presence of a Con(B3O6) species. The signal for trigonal borates is weaker in 1C than in 1. Shouldering at 850 cm−1 may be associated with alumina species.34
Borohydride hydrolysis
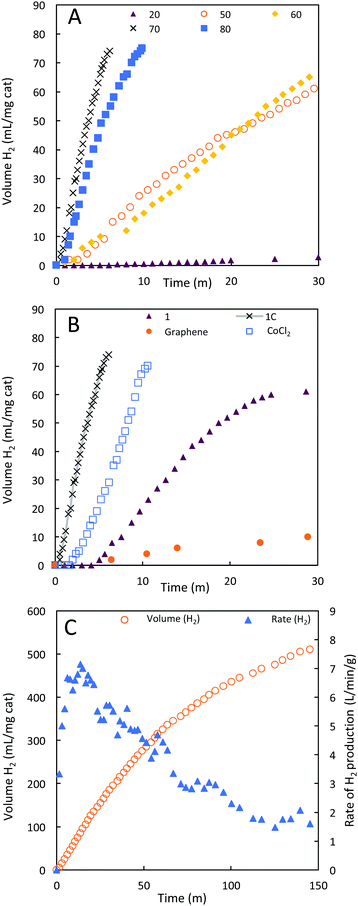
1C was evaluated as a catalyst for the hydrolysis of sodium borohydride in alkaline solutions (vide supra). We examined the performance of 1C across a range of temperatures. High temperatures (60–100 °C) are realistic conditions for fuel cell vehicles being empowered by hydrogen technology.35 The optimal rate of hydrolysis of borohydride to hydrogen with 1C was noted at 70 °C. At this temperature, 12 L(H2) min−1 gcat−1 (Fig. 6A and Table 2) of hydrogen gas was produced at a rate 130-fold higher than the rate observed at 20 °C (0.09 L(H2) min−1 gcat−1). Adjusting for the relatively small proportion of cobalt present in 1C, the rate of hydrogen evolution can be expressed as 49.3 L(H2) min−1 gCo−1, highlighting the efficiency of 1C as a borohydride hydrolysis catalyst. Efficient performance at these temperatures is of critical importance, because prototyped engineered systems for borohydride hydrolysis operate above 60 °C.20,36 The decay of catalytic activity at 80 °C indicates that the ideal temperature window is app. 70 °C and the loss in catalytic activity is most likely due to structural changes, i.e. decrease of active sites. An ideal temperature for a given reaction is a general phenomenon for both heterogeneous and homogeneous catalysts.| Catalyst | T | Rate of H2 evolution | |
|---|---|---|---|
| (°C) | L min−1 gcat−1 | L min−1 gCo−1a | |
| a Using 4.5% Co determined by STEM EDS analysis, or as calculated in the literature by authors. b In the un-catalysed run, 4 mL of H2 evolved over 30 minutes, the rate is expressed w.r.t. 1 mg catalyst in line with the other results. c Value given is relative to Pt atoms. | |||
| 1C | 20 | 0.09 | 0.38 |
| 1C | 50 | 1.8 | 7.5 |
| 1C | 60 | 2.0 | 8.1 |
| 1C | 70 | 12 | 49.3 |
| 1C | 80 | 7.6 | 31.1 |
| 1 | 70 | 2.0 | |
| CoCl2·6H2O | 70 | 6.0 | 24 |
| Graphene | 70 | 0.34 | — |
| Blankb | 70 | 0.13b | — |
| CoCl2·6H2O37 | 20 | 0.57 | 2.3 |
| Co–B/Cblack28 | 30 | — | 23.94 |
| Co–O–P24 | 20 | 2.81 | |
| CoO nanocrystals21 | 30 | 5.89 | |
| CoCl2/Al2O338 | 20 | 8.9 | 45.4 |
| Pt/C (10 wt%)39 | 25 | 23 | 176c |
Hydrogen evolution from NaBH4 was then investigated in the presence of 1C, 1, CoCl2·6H2O and graphene at 70 °C (Fig. 6B). Under these conditions, the run impregnated with graphene gave rise to very little hydrogen evolution, comparable to a blank run. 1 is less active than 1C, despite containing a higher portion of cobalt by mass and only achieved 82% conversion of borohydride to hydrogen. The lower performance of 1 despite the significantly higher portion of cobalt present can be related to the large particle sizes observed by SEM. Large particles are typically associated with inferior catalytic performance. The improved durability of 1C relative to 1 supports the postulate that the graphene platelets are effective at stabilising cobalt metal oxide nanoparticles.
The vast majority of studies on cobalt (and other) catalysts for the hydrolysis of borohydrides have investigated their efficacy only between 20–30 °C.20,24 To determine if the more than hundred-fold improvement in hydrogen production rate at 1C upon heating to 70 °C from room temperature is a general feature of cobalt catalysts, or idiosyncratic to this material, we examined the prototypical cobalt catalyst – cobalt chloride.40 At 70 °C, CoCl2 turned over 6.0 L(H2) min−1 g(cat)−1 hydrogen, indicating a 14-fold improvement compared to previous literature reports at 20 °C. The improvement in rate here is an order of magnitude less than that observed for 1C, which is also ten times more active than CoCl2 at 70 °C on a Co atom basis.
To study the long-term stability of 1C, we performed a longer catalytic run (Fig. 6C). In this run, the maximum turnover rate was noted after 15 minutes at 7 L min−1 gcat−1, which then gradually declined to ca. 2 L min−1 gcat−1, a rate still comparable with many literature catalysts. The reaction proceeded to completion with a turnover number of at least 1.2 × 10⁷ in terms of molecules of H2 produced per Co atom in the catalyst.
Most cobalt (and other non-precious metal) systems for borohydride hydrolysis have been benchmarked around room temperature to facilitate straightforward comparison to other systems. The activity of cobalt systems at elevated reaction temperatures is poorly characterised, obfuscating comparisons between literature catalysts and 1C. Developing an understanding of how cobalt catalysts function over long time periods and at elevated temperatures is important if they are to find applications in hydrogen fuel cells. Our results emphasize that valorisation can be considered as sustainable recycling of used Li-ion batteries.41
Conclusions
The mixed cobalt–aluminium borate catalyst 1C was prepared from scrapped Li-ion battery cathodes with the addition of a graphene support. The preparation of 1C was straightforward and green, involving treatment of a deconstructed battery with hydrochloric acid, neutralisation of the extract with sodium carbonate and finally reduction of the catalyst with sodium borohydride in the presence of graphene.1C is an effective catalyst for the alkaline hydrolysis of sodium borohydride, achieving an optimal production rate of 49.3 L(H2) min−1 g−1 Co at 70 °C, and a turnover number of at least 1.2 × 10⁷ molecules of H2 per Co atom. A similar catalyst, 1, prepared without a carbon support gave poor turnover and exhibited a relatively lower activity. SEM and STEM analysis showed that metal oxide nanoparticles with smaller particle sizes were obtained in 1C compared to 1, which may explain how the presence of carbon can improve mass activity.
The dramatic improvement in activity of 1C upon heating highlights the need to examine both cobalt and precious metal catalysts over a wide temperature range, as this data will better inform applications in hydrogen on demand systems. Furthermore, this work is illustrative that new possibilities for materials abound when chemists turn their attention to waste as a raw material. Future developments of this system will pursue an optimised synthesis, and seek conditions where long term stability is maximised so that up-cycled cobalt materials such as 1C can be practical components of hydrogen on demand energy systems.
Conflicts of interest
There are no conflicts to declare.Acknowledgements
This project was financially supported by the Olle Engkvists Stiftelse (Grant No. 198-0329). S. B. thanks the Austrian COMET Programme (Project InTribology, no. 872176) in collaboration with “Excellence Centre of Tribology” (AC2T Research GmbH) for additional financial support. We thank Battronics Engineering, Switzerland, and Jianhong Chen for fruitful discussions.Notes and references
- D. O. Akinyele and R. K. Rayudu, Sustainable Energy Technol. Assess., 2014, 8, 74–91 Search PubMed.
- J. Heelan, E. Gratz, Z. Zheng, Q. Wang, M. Chen, D. Apelian and Y. Wang, JOM, 2016, 68, 2632–2638 Search PubMed.
- X. Zeng, J. Li and N. Singh, Crit. Rev. Environ. Sci. Technol., 2014, 44, 1129–1165 Search PubMed.
- T. M. Budnyak, J. Piątek, I. V. Pylypchuk, M. Klimpel, O. Sevastyanova, M. E. Lindström, V. M. Gun’ko and A. Slabon, ACS Omega, 2020, 5, 10847–10856 Search PubMed.
- T. M. Budnyak, A. Slabon and M. H. Sipponen, ChemSusChem, 2020, 13, 4344–4355 Search PubMed.
- E. Hsu, K. Barmak, A. C. West and A.-H. A. Park, Green Chem., 2019, 21, 919–936 Search PubMed.
- Y. Yang, X. Meng, H. Cao, X. Lin, C. Liu, Y. Sun, Y. Zhang and Z. Sun, Green Chem., 2018, 20, 3121–3133 Search PubMed.
- P. K. R. Tay, A. Manjula-Basavanna and N. S. Joshi, Green Chem., 2018, 20, 3512–3520 Search PubMed.
- S. L. Poe, C. L. Paradise, L. R. Muollo, R. Pal, J. C. Warner and M. B. Korzenski, US Pat., US2014/0306162A1, 2014 Search PubMed.
- P. Chen, K. Xu, T. Zhou, Y. Tong, J. Wu, H. Cheng, X. Lu, H. Ding, C. Wu and Y. Xie, Angew. Chem., Int. Ed., 2016, 55, 2488–2492 Search PubMed.
- X. Deng and H. Tüysüz, ACS Catal., 2014, 4, 3701–3714 Search PubMed.
- Z. Ma, T. Thersleff, A. L. Görne, N. Cordes, Y. Liu, S. Jakobi, A. Rokicinska, Z. G. Schichtl, R. H. Coridan, P. Kustrowski, W. Schnick, R. Dronskowski and A. Slabon, ACS Appl. Mater. Interfaces, 2019, 11, 19077–19086 Search PubMed.
- C. Lu, P. R. Jothi, T. Thersleff, T. M. Budnyak, A. Rokicinska, K. Yubuta, R. Dronskowski, P. Kuśtrowski, B. P. T. Fokwa and A. Slabon, Nanoscale, 2020, 12, 3121–3128 Search PubMed.
- P. Hu and M. Long, Appl. Catal., B, 2016, 181, 103–117 Search PubMed.
- J. Xiao, J. Li and Z. Xu, Environ. Sci. Technol., 2020, 54, 9–25 Search PubMed.
- V. P. Parikh, A. Ahmadi, M. H. Parekh, F. Sadeghi and V. G. Pol, Environ. Sci. Technol., 2019, 53, 3757–3763 Search PubMed.
- E. A. Aboelazm, G. A. Ali and K. F. Chong, Chem. Adv. Mater., 2018, 3, 67–74 Search PubMed.
- Y. I. Mesbah, N. Ahmed, B. A. Ali and N. K. Allam, ChemElectroChem, 2020, 7, 975–982 Search PubMed.
- X. Wang, H. Qiu, H. Liu, P. Shi, J. Fan, Y. Min and Q. Xu, Green Chem., 2018, 20, 4901–4910 Search PubMed.
- S. S. Muir and X. Yao, Int. J. Hydrogen Energy, 2011, 36, 5983–5997 Search PubMed.
- A. Lu, Y. Chen, J. Jin, G.-H. Yue and D.-L. Peng, J. Power Sources, 2012, 220, 391–398 Search PubMed.
- C. Wu, F. Wu, Y. Bai, B. Yi and H. Zhang, Mater. Lett., 2005, 59, 1748–1751 Search PubMed.
- A. M. Ozerova, V. I. Simagina, O. V. Komova, O. V. Netskina, G. V. Odegova, O. A. Bulavchenko and N. A. Rudina, J. Alloys Compd., 2012, 513, 266–272 Search PubMed.
- L. Wei, X.-L. Dong, Y.-M. Yang, Q.-Y. Shi, Y.-H. Lu, H.-Y. Liu, Y.-N. Yu, M.-H. Zhang, M. Qi and Q. Wang, Int. J. Hydrogen Energy, 2020, 45, 10745–10753 Search PubMed.
- N. Patel and A. Miotello, Int. J. Hydrogen Energy, 2015, 40, 1429–1464 Search PubMed.
- N. Patel, R. Fernandes and A. Miotello, J. Catal., 2010, 271, 315–324 Search PubMed.
- A. K. Babko and A. T. Pilipenko, Photometric analysis: general principles and working tools, Mir Publishers, 1971 Search PubMed.
- F. Baydaroglu, E. Özdemir and A. Hasimoglu, Int. J. Hydrogen Energy, 2014, 39, 1516–1522 Search PubMed.
- J. Manna, B. Roy, M. Vashistha and P. Sharma, Int. J. Hydrogen Energy, 2014, 39, 406–413 Search PubMed.
- H. Tan, J. Verbeeck, A. Abakumov and G. Van Tendeloo, Ultramicroscopy, 2012, 116, 24–33 Search PubMed.
- F. Tuinstra and J. L. Koenig, J. Chem. Phys., 1970, 53, 1126–1130 Search PubMed.
- X.-F. Luo, C.-H. Yang, Y.-Y. Peng, N.-W. Pu, M.-D. Ger, C.-T. Hsieh and J.-K. Chang, J. Mater. Chem. A, 2015, 3, 10320–10326 Search PubMed.
- C. Uthaisar, V. Barone and B. D. Fahlman, Carbon, 2013, 61, 558–567 Search PubMed.
- R. Frech and J. B. Bates, Spectrochim. Acta, Part A, 1979, 35, 685–694 Search PubMed.
- U. Eberle, B. Müller and R. von Helmolt, Energy Environ. Sci., 2012, 5, 8780–8798 Search PubMed.
- S. C. Amendola, S. L. Sharp-Goldman, M. S. Janjua, M. T. Kelly, P. J. Petillo and M. Binder, J. Power Sources, 2000, 85, 186–189 Search PubMed.
- B. H. Liu, Z. P. Li and S. Suda, J. Alloys Compd., 2006, 415, 288–293 Search PubMed.
- O. Akdim, U. B. Demirci and P. Miele, Int. J. Hydrogen Energy, 2009, 34, 4780–4787 Search PubMed.
- Y. Bai, C. Wu, F. Wu and B. Yi, Mater. Lett., 2006, 60, 2236–2239 Search PubMed.
- H. I. Schlesinger, H. C. Brown, A. E. Finholt, J. R. Gilbreath, H. R. Hoekstra and E. K. Hyde, J. Am. Chem. Soc., 1953, 75, 215–219 Search PubMed.
- B. Huang, Z. Pan, X. Su and L. An, J. Power Sources, 2018, 399, 274–286 Search PubMed.
Footnote |
| † Electronic supplementary information (ESI) available: Spectra and photographs of experimental setups. See DOI: 10.1039/d0ma00372g |
| This journal is © The Royal Society of Chemistry 2020 |


