 Open Access Article
Creative Commons Attribution 3.0 Unported Licence
Continuous-flow liquid-phase dehydrogenation of 1,4-cyclohexanedione in a structured multichannel reactor†
M. Arsalan
Ashraf
 *a,
Julia
Tan
a,
Matthew G.
Davidson
b,
Steven
Bull
 b,
Marc
Hutchby
b,
Davide
Mattia
b,
Marc
Hutchby
b,
Davide
Mattia
 a and
Pawel
Plucinski
*a
aDepartment of Chemical Engineering, University of Bath, Claverton Down, Bath BA27AY, UK. E-mail: M.A.Ashraf@bath.ac.uk; P.Plucinski@bath.ac.uk
bDepartment of Chemistry, University of Bath, Claverton Down, Bath BA27AY, UK
First published on 6th November 2018
Abstract
A highly selective, scalable and continuous-flow process is developed for the liquid-phase dehydrogenation of 1,4-cyclohexanedione to hydroquinone in a millimetre-scale structured multichannel reactor. The square-shaped channels (3 mm × 3 mm) were filled with 10 wt% Pd/C catalyst particles and utilized for the dehydrogenation reaction in single-pass and recycle modes. For the purpose of enhancing process understanding and maximizing conversion and selectivity by process optimization, the design of experiment (DoE) methodology was utilized by studying the effect of operating parameters on the catalytic performance in the kinetic regime. The results demonstrated the strong influence of temperature and liquid feed flow on the conversion and selectivity, with liquid feed and N2 flows influencing pressure drop significantly. A multi-objective optimization methodology was used to identify the optimum process window with the aid of sweet spot plots, with design space plots developed to establish acceptable boundaries for process parameters. In single-pass mode, complete conversion per pass per channel was not achievable, whereas conversion increased from 59.8% in one channel to 78.3% for two channels in series while maintaining selectivity (>99%) with intermediate hydrogen removal. However, without the intermediate H2 removal step, selectivity decreased from >99% in one channel to 82.3% at the outlet of the second channel. In recycle mode, the dehydrogenation reaction resulted in almost complete conversion (>99%) with very high selectivity (>99%) and yield (>98%). This combination of mm-scale multichannel reactor and DoE methodology opens the way to developing highly selective and scalable dehydrogenation processes in the fine chemical and pharmaceutical industries.
1. Introduction
Climate change, security of fossil fuel supply and other considerations are driving the development of a biomass-based economy. The existing industrial process routes are developed to synthesize chemicals from fossil feedstock. In turn, the oxygen-rich chemistry of bio-feedstocks requires novel synthetic routes to key chemicals that can be prepared using economical and environmentally viable processes.1,2 In the fine chemical and pharmaceutical industries, dehydrogenation is an interesting reaction in the formation of highly valuable ketones, aldehydes and aromatic compounds from renewable feedstock. Endothermic dehydrogenation is usually performed at higher temperature and lower pressure. However, insufficient chemical stability of most fine chemicals requires the reaction to be performed under moderate conditions in the liquid phase with the use of a solvent. This dehydrogenation to aromatic compounds becomes more complex in terms of achieving high selectivity when a hydroxyl, carbonyl or acid anhydride group is attached to the ring.3Hydroquinone is a key intermediate (benzene ring with two hydroxyl groups) in the production of many high-value fine chemicals and pharmaceutical ingredients, with hydroquinone currently produced from petroleum-based feedstocks such as benzene, phenol, and aniline.4 It has commercial applications such as an antioxidant in skincare products,5 as a polymerization inhibitor,6 and as a photo-developing agent.7 However, hydroquinone can potentially be synthesized by the dehydrogenation of 1,4-cyclohexanedione,8 which, in turn, can be derived from bio-renewable succinic esters9 that can be accessed from lignocellulosic feedstocks using fermentative processes.10
In fine-chemical processes, multiphase dehydrogenation of cyclohexanones is currently performed in conventional slurry reactors: for instance, the liquid phase dehydrogenation of 1,4-cyclohexanedione has been carried out in a batch slurry reactor at 215 °C over suspended Pd/C catalysts (10–200 μm) in a polyglycol solvent with a hydroquinone yield of 91.5%.8 In a similar study,11 4-hydroxyacetophenone was synthesized by dehydrogenation reaction in ∼84% yield using a continuous stirred tank reactor (CSTR) over a suspended RANEY® Ni catalyst at 280 °C. In another study,12 a maximum yield of 92% was reported for the dehydrogenation of a number of cyclic ketones to phenols in a batch slurry reactor over a suspended Pd/C catalyst in N,N-dimethylacetamide at 150 °C with a reaction time of 20 h. The main disadvantage of using slurry reactors is that the reactants face a range of residence times and varying operating conditions that are dependent on their location in the reactor. This results in inefficient heat and mass transfer that can result in poor selectivity, with typical fine chemical processes producing 20–100 kg of unwanted by-products per kg of desired product.13
Continuous-flow technology is well established in the bulk chemical and petrochemical industries which can transform conventional batch processes into more sustainable, highly selective and continuous-flow processes in the fine chemical and pharmaceutical industries.14 Millimeter-scale flow reactors have been used as an alternative to slurry reactors for dehydrogenation reactions due to their significant advantages of excellent heat and mass transfer, rapid mixing, and fine control of contact time.15,16 This uniformity of reaction environment ensures that every reactant experiences the same operating conditions and allows the reaction to operate in the intrinsic kinetic regime, which enables the selectivity of the dehydrogenation reactions to be maximized,17 leading to waste by-product minimization.18 Additionally, this approach enables pilot scale work to be bypassed by scaling up the number of reactors using well-established numbering-up processes19 that do not sacrifice selectivity or yield.20,21 Heterogeneous catalysts can be wash-coated onto reactor channel walls or used as a packed bed inside the channels, which prevents abrasion and separation of catalyst particles.22 Indeed, micro/mm-scale packed channel reactors have been shown to provide better reaction performance than non-packed bed channel reactors, particularly wall-coated channels that exhibit excellent mass transfer characteristics.23
The yield of the dehydrogenation reaction is limited by thermodynamics3 which results in lower conversion per pass through the flow reactor. In order to achieve complete conversion without thermodynamic or kinetic limitations or to avoid side reactions, the dehydrogenation reaction can be performed by recycling of unconverted raw material or ideally by removing the products immediately during the course of the reaction.24 The determination of optimized conditions and an operating window is necessary to achieve complete conversion with the highest selectivity. This process can be aided by statistical design of experiments (DoE), which is a proven method for developing optimal processes by applying experimental design and analysis in a structured and organized manner.25 The large number of process parameters that affect multiphase dehydrogenation reactions requires extensive testing to optimize performance. After screening out critical process parameters, experimental results are then analysed to develop predictive models that relate the process parameters and response functions.26,27 For chemical transformations, DoE helps in identifying the optimal combination of process parameters for maximizing reactivity and selectivity.28 Within the realm of DoE analysis, response surface methodology (RSM) can be used to identify acceptable process ranges to control response functions which, in turn, can lead to the development of an adequate control strategy.29
In this work, we present the first study on the continuous-flow liquid-phase dehydrogenation of 1,4-cyclohexanedione over 10 wt% Pd/C catalyst to produce a high yield of hydroquinone in a mm-scale structured multichannel reactor. The reaction is performed in continuous flow (single-pass and recycle modes) at lower pressure using a high-boiling-point solvent (tetraethylene glycol dimethyl ether) under optimized conditions identified by DoE methodology. To our knowledge, this is also the first study on multiphase dehydrogenation combining experimental study and statistical modelling in both single-pass and recycle flow systems.
2. Experimental
2.1. Materials
Tetraethylene glycol dimethyl ether (99%), methanol (99.9%), and 1,4-cyclohexanedione (98%) were supplied by Acros Organics, UK. Biphenyl (99.5%), benzene-d6 (99.6%) and 10 wt% Pd/C catalyst (reduced) were supplied by Sigma Aldrich, UK. Nitrogen gas was of high purity (>99%) and was purchased from BOC, UK. All the chemicals, nitrogen, and 10 wt% Pd/C catalyst were used as received without any further purification.2.2. Design of experiments
Design of experiment (DoE) is applied as a key tool to enhance process understanding and optimize the dehydrogenation reaction for the purpose of maximizing conversion and selectivity. For this study, two sets of experimental design were generated using a D-optimal design for process parameters (temperature, liquid feed flow, nitrogen flow, and substrate concentration) and MODDE Pro 10.0.1 software (MKS Umetrics AB). The first experimental design for continuous dehydrogenation (single-pass mode) that employed a subset of 34 experiments is shown in Table S1 (see the ESI†), with Table S2 (see the ESI†) showing a second experimental design using 32 experiments for semi-continuous dehydrogenation (recycling mode). The designed experiments were performed to evaluate conversion, selectivity, and pressure drop as response functions. D-optimal experimental design coupled with regression analysis was used to develop a quadratic model from the experimental results that enabled the relationship between process parameters and response functions to be determined. Finally, all model predictions were then validated experimentally.2.3. Catalytic performance evaluation
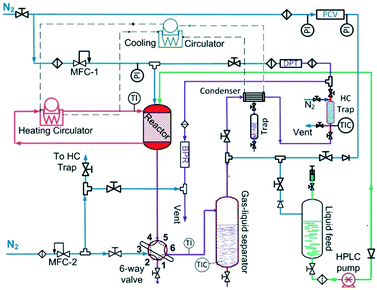
The liquid-phase dehydrogenation of 1,4-cyclohexanedione was carried out over 10 wt% Pd/C catalyst under favourable conditions of lower pressure (1.5 bar) and higher temperature (≤240 °C) in a high boiling point (TBP = 275 °C) solvent, i.e., tetraethylene glycol dimethyl ether, with excellent thermal and chemical stability. The experiments were conducted in a purpose-built experimental setup (Fig. 1) using a previously developed30 mm-scale structured multichannel reactor at the University of Bath, as shown in Fig. S1 (see the ESI†). The reactor design allows the flexibility to operate multiple channels in single-pass, series and recycle modes. The reactor channel (3 mm × 3 mm, square shape, length = 10 cm) was selected due to the highest conversion of organic feedstock as compared to other channels (2 mm × 2 mm and 5 mm × 5 mm) in a previous study.31 The channel was packed with 210 mg of pre-reduced 10 wt% Pd/C catalyst (average particle size of activated carbon = 64.4 μm, Pd nanoparticles = ca. 5 nm (ref. 32–34)), with glass wool placed at each end of the chamber to hold the catalyst bed in place. The liquid and gas streams were preheated to the reaction temperature in an upfront static mixer (length = 6 cm). The reaction temperature was controlled by using a heating system employing a recirculating fluid for heat transfer to the heat-exchanging type structured multichannel reactor. A back-pressure regulator controlled the pressure at 1.5 bar to avoid air ingress into the reactor. A detailed description of the reactor and experimental setup is provided in the ESI.†For the first experimental design, the reactor was operated in continuous flow mode with controlled temperature (T, 180–240 °C), nitrogen gas flow (FG, 5–80 mL min−1, 33.3–566.7 m3 m−2 h−1 at STP), liquid feed flow (FL, 0.10–0.50 mL min−1, 0.7–3.3 m3 m−2 h−1 at STP), and 1,4-cyclohexanedione concentration (Co, 1–10 wt% in tetraethylene glycol dimethyl ether).
The dehydrogenation reaction is limited by thermodynamics, requiring higher temperatures to achieve a reasonable conversion; however, reaction selectivity is badly affected by high temperatures.3 Therefore, to achieve a higher yield, a second set of experiments was designed for semi-continuous operation, whereby the exit product liquid stream was recycled as a feedstock back into the reactor whilst gas was vented. The factors varied in the second set of experiments were reactor inlet conversion (Xin, 0–100%), reactor temperature (T, 200–240 °C), nitrogen gas flow (FG, 5–85 mL min−1, 33.3–602.1 m3 m−2 h−1 at STP), and liquid feed flow (FL, 0.10–0.50 mL min−1, 0.7–3.3 m3 m−2 h−1 at STP). The feed stream contained 5 wt% 1,4-cyclohexanedione and hydroquinone (based on reactor inlet conversion) in tetraethylene glycol dimethyl ether.
Prior to catalytic testing, the reactor was purged with 45 mL min−1 nitrogen for 30 min at room temperature. The liquid feed was introduced at a flow rate of 0.50 mL min−1 for 10 min to wet the catalyst bed. Pre-wetting is commonly performed to achieve uniform distribution of the liquid substrate throughout the catalyst bed.35 However, for miniaturized packed bed reactors, wet and dry start-up procedures can provide the same hydrodynamic state after stabilization due to strong capillary forces,36 with pre-wetting carried out as a precautionary step in this study to ensure good reproducibility. After wetting, the liquid feed was stopped, and the reactor was heated from room temperature to the desired reaction temperature with a continuous nitrogen flow. At the desired temperature, the reaction was initiated with liquid and gas flows using a co-current flow arrangement. For each experiment, the feed was allowed to flow for 60 min to ensure a steady-state condition. Subsequently, three liquid samples were collected at 10 minute intervals, which were then analysed by 1H NMR spectroscopy using a 300 MHz Bruker spectrometer for product detection and quantification. Biphenyl was used as the internal standard for quantification purposes. The sample used for 1H NMR analysis was prepared by dissolving 0.2 mL of product in 0.5 mL benzene-d6. Product ratios were validated using gas chromatography (GC system, 7890B, Agilent Technologies) coupled to mass spectrometry (MS, 5977A, Agilent Technologies) detection. The samples used for GC-MS analysis were prepared by dissolving product analytes in methanol prior to analysis.
3. Results and discussion
To develop a continuous-flow process for liquid-phase dehydrogenation, different parameters, i.e., temperature, liquid feed flow, nitrogen gas flow, and substrate concentration, were evaluated for catalytic performance in a mm-scale structured multichannel reactor in single-pass and recycle modes.The catalytic performance of multiphase dehydrogenation reaction can be assumed as a sequence of fundamental steps: (1) diffusion of 1,4-cyclohexanedione from the liquid feed stream to the surface of the Pd/C particles, (2) subsequent diffusion through the pore network of activated carbon, (3) followed by adsorption on the metallic Pd catalyst surface, (4) then surface reaction leading to the formation of products (i.e., hydroquinone, hydrogen etc.), (5) eventually the desorption of the products from the metallic Pd catalyst surface, (6) which diffuse away from the catalyst surface through the pore structure back to the bulk stream. Hydroquinone remains in the liquid phase, whereas the produced hydrogen goes to the surrounding gas stream.
The plug flow behaviour in the mm-scale structured packed bed reactor was confirmed by a number of appropriate criteria, i.e., ratio of reactor to particle diameter, ratio of reactor length to particle diameter, and Peclet number. The presence of external and internal mass transfer diffusion limitations was evaluated under extreme operating conditions at higher conversion (79.1%) for experiment N17 (T = 240 °C, FL = 0.1 mL min−1, FG = 5 mL min−1, and Co = 10); see Table S1 in the ESI.†
The understanding of the interaction at the liquid–solid interphase is very important for uniform distribution of the liquid stream surrounding the catalyst particles in heterogeneous multiphase reactors. Small catalyst particles (50–200 μm) in micro/mm-scale packed bed reactors alter the prevailing hydrodynamics of multiphase flow, which is not characteristic of trickle flow regimes, and help to overcome the non-idealities of trickle bed reactors: (1) incomplete wetting, (2) internal concentration gradient, (3) flow maldistribution, and (4) temperature gradient on reactor scale.37,38 The small particle size (64.4 μm) results in capillary forces dominating over viscous and gravitational forces, which results in almost complete wetting of the catalyst bed.39 However, further decrease in particle size (<50 μm) will result in a significant pressure drop over the catalyst bed. The dehydrogenation reaction is favoured at lower pressure. The smaller particles and longer channel length will increase the pressure drop significantly, with a negative influence on yield and energy requirements. The Sie criterion40 (eqn (1)) was used to estimate the wetting characteristics of the catalyst packed bed.
 | (1) |
The narrow residence time distribution is characteristic of plug flow reactors in addition to the uniformity of the reaction environment that ensures the same operating conditions for each reactant along the reactor. A previous study31 has shown that plug flow normally occurs for the flow ranges operating in our reactor system, with a reactor diameter (dr) to particle diameter (dp) ratio of 46.6 > 10 confirming the absence of wall effects on the plug flow pattern.38 The radial distribution of the substrate concentration in the reactor can be considered to be uniform for large dr/dp values of >25.40 The effects of axial gradients can be neglected based on the reactor length to particle diameter ratio (Lr/dp) of 466 > 50, which was also confirmed by the particle Peclet number (Pep,ax ),41 as calculated by eqn (2).
 | (2) |
The mass transport limitations in heterogeneous catalytic reactors can alter the reaction rates, selectivity and even the reaction mechanism.42,43 However, in order to evaluate the external mass transport limitation between the bulk fluid stream and the external catalyst surface, the Mears criterion44 is utilized as described by eqn (3).
 | (3) |
The absence of intraparticle (internal) mass transfer limitation was verified by using the Weisz–Prater criterion45 which represents the ratio of the reaction rate to the rate of diffusion in pores, as given by eqn (4).
 | (4) |
These results suggest that the liquid-phase dehydrogenation reaction is performed in the kinetic regime under the investigated conditions with no transport (extra-particle and intra-particle diffusion) limitations.
3.1. Continuous dehydrogenation of 1,4-cyclohexanedione
For continuous flow (single-pass mode) liquid-phase dehydrogenation of 1,4-cyclohexanedione, the results are shown in Table S1 (see the ESI†) for 34 experiments designed by using D-optimal methodology. All the experiments were performed over 10 wt% Pd/C catalyst packed in a mm-scale structured multichannel reactor in a randomized order to avoid experimental bias, with three central point experiments showing that results were reproducible, with deviations between each run within an experimental error of ±2.9%.The experimental results (Table S1, see the ESI†) were analysed and quadratic models were developed using eqn (5) for conversion (Y1) of 1,4-cyclohexanedione, selectivity (Y2) for hydroquinone, and pressure drop (Y3) in terms of temperature (X1), nitrogen flow (X2), liquid feed flow (X3), and substrate concentration (X4).
 | (5) |
The regression coefficient of quadratic models and standard error and P-values are given in Table 1. The model significance of each response function was evaluated through P-values, with a P-value of <0.05 indicating that the coefficient influenced the response function significantly, whilst a P-value of 0.05 indicated a non-significant effect. Additionally, a positive coefficient value was considered to correspond to a synergistic effect, whilst a negative value indicated an antagonistic effect of the factor on the selected response.
| Model term | Coefficient estimate | Standard error | P |
|---|---|---|---|
| X 1 = temperature (T, °C), X2 = nitrogen flow (FG, mL min−1), X3 = liquid feed flow (FL, mL min−1), and X4 = substrate concentration (Co, wt%). | |||
| (a) Conversion, X(Y1) | |||
| Constant | 1.35 | 0.04 | 5.11 × 10⁻²⁴ |
| X 1 | 0.36 | 0.02 | 5.65 × 10⁻¹⁵ |
| X 2 | 0.12 | 0.02 | 2.49 × 10⁻⁶ |
| X 3 | −0.35 | 0.02 | 4.74 × 10⁻¹⁶ |
| X 4 | 5.94 × 10⁻³ | 0.02 | 0.76 |
| X 1 2 | −0.18 | 0.03 | 6.73 × 10⁻⁶ |
| X 1 × X2 | −0.11 | 0.02 | 2.31 × 10⁻⁶ |
| X 1 × X3 | 7.40 × 10⁻² | 0.02 | 5.30 × 10⁻⁴ |
| (b) Selectivity, S(Y2) | |||
| Constant | 0.44 | 0.07 | 3.28 × 10⁻⁶ |
| X 1 | −0.19 | 0.04 | 2.03 × 10⁻⁵ |
| X 2 | 0.03 | 0.04 | 0.50 |
| X 3 | 0.13 | 0.04 | 2.04 × 10⁻³ |
| X 4 | −6.97 × 10⁻² | 0.04 | 0.08 |
| X 3 2 | −0.32 | 0.07 | 6.31 × 10⁻⁵ |
| X 1 × X3 | 0.15 | 0.04 | 3.91 × 10⁻⁴ |
| (c) Pressure drop, ΔP(Y3) | |||
| Constant | 0.73 | 0.05 | 2.71 × 10⁻¹⁴ |
| X 1 | −0.01 | 0.02 | 0.58 |
| X 2 | 0.19 | 0.02 | 7.63 × 10⁻⁹ |
| X 3 | 0.16 | 0.02 | 5.29 × 10⁻⁸ |
| X 4 | −6.87 × 10⁻³ | 0.02 | 0.76 |
| X 2 2 | −8.80 × 10⁻² | 0.04 | 0.02 |
| X 3 2 | −9.52 × 10⁻² | 0.04 | 0.03 |
| X 1 × X3 | 4.59 × 10⁻² | 0.02 | 0.04 |
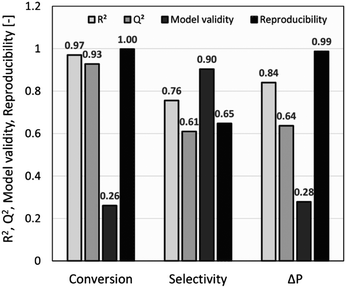
The summary of fit (R2 > 0.5, Q2 > 0.5, model validity > 0.25, and reproducibility > 0.5) was used as a criterion to measure the quality of the model fit and its potential for prediction. As shown in Fig. 2, R2 values of >0.75 indicated a good fit with a sufficiently precise description of experimental data to the models. However, due to several factors influencing a chemical reaction, a lower R2 of ∼0.7 was also considered acceptable,27 whilst Q2 values of >0.50 confirmed the good predictive capability for all models. Model diversity was probed using validity values of >0.25, which confirmed the absence of statistically significant problems.54 The high reproducibility values (>0.5) proved that the variation of replicates was less than the overall variation of the response function. For conversion and pressure drop, the model validity values were lower due to very high reproducibility values close to 1.0.55
The significance of the model and model terms was evaluated using P-value (<0.05) and analysis of variance (ANOVA) at the 95% confidence level. Finally, all model predictions were then validated experimentally. ANOVA data shown in Table 2 reveal that the models are statistically significant at the 95% confidence level. The lack of fit (LoF) was calculated from the pure error and its residual. A high F-value implies that the lack of fit is non-significant relative to the pure error which suggests that the developed models are valid with good predictability. The statistical significance of the models was checked by comparing the values of the term “RSD × sqrt(F(crit))” with “regression-SD” where lower first values for all responses confirm that the models were significant at the 5% level. Lack of fit was non-significant for all models as confirmed by larger values for SD-pe × sqrt(F(crit)) = 1.0281 than for SD-LoF. Fig. S2 (ESI†) reveals that the predicted values of the models were in good agreement with observed values, which confirmed that the factors are successfully correlated with the responses in the developed models.
| Source | DF | SS | MS (variance) | F | P | SD |
|---|---|---|---|---|---|---|
| DF = degree of freedom, SS = sum of squares, MS = mean square, SD = standard deviation, RSD = residual standard deviation, sqrt(F(crit)) = square root of critical F. | ||||||
| (a) Conversion, X(Y1) | ||||||
| Total | 34 | 58.14 | 1.71 | |||
| Constant | 1 | 47.4 | 47.4 | |||
| Total corrected | 33 | 10.74 | 0.33 | 0.57 | ||
| Regression | 7 | 10.42 | 1.49 | 120.6 | 0 | 1.2 |
| Residual | 26 | 0.32 | 1.24 × 10⁻² | 0.1 | ||
| Lack of fit (LoF) | 24 | 0.32 | 1.33 × 10⁻² | 18.61 | 0.05 | 0.1 |
| Pure error (pe) | 2 | 1.43 × 10⁻³ | 7.16 × 10⁻⁴ | 0.03 | ||
| RSD × sqrt(F(crit)) = 0.17 | ||||||
| SD-pe × sqrt(F(crit)) = 0.12 | ||||||
| (b) Selectivity, S(Y2) | ||||||
| Total | 34 | 5.69 | 0.17 | |||
| Constant | 1 | 0.6 | 0.6 | |||
| Total corrected | 33 | 5.09 | 0.15 | 0.39 | ||
| Regression | 6 | 3.85 | 0.64 | 13.91 | 0 | 0.8 |
| Residual | 27 | 1.24 | 4.61 × 10⁻² | 0.21 | ||
| Lack of fit (LoF) | 25 | 1.14 | 4.54 × 10⁻² | 0.84 | 0.68 | 0.21 |
| Pure error (pe) | 2 | 0.11 | 5.43 × 10⁻² | 0.23 | ||
| RSD × sqrt(F(crit)) = 0.34 | ||||||
| SD-pe × sqrt(F(crit)) = 1.03 | ||||||
| (c) Pressure drop, ΔP(Y3) | ||||||
| Total | 34 | 12.8 | 0.38 | |||
| Constant | 1 | 10.27 | 10.27 | |||
| Total corrected | 33 | 2.54 | 7.68 × 10⁻² | 0.28 | ||
| Regression | 7 | 2.13 | 0.3 | 19.5 | 0 | 0.55 |
| Residual | 26 | 0.14 | 1.56 × 10⁻² | 0.12 | ||
| Lack of fit (LoF) | 24 | 0.4 | 1.68 × 10⁻² | 17.3 | 0.06 | 0.13 |
| Pure error (pe) | 2 | 1.94 × 10⁻³ | 9.72 × 10⁻⁴ | 0.03 | ||
| RSD × sqrt(F(crit)) = 0.19 | ||||||
| SD-pe × sqrt(F(crit)) = 0.14 | ||||||
The understanding of the dehydrogenation process was developed by studying the influence of a series of operating parameters on process functions, i.e. conversion, selectivity, and pressure drop.
Nitrogen flow had a very minor but positive influence on conversion values, particularly at lower temperatures. This is likely due to the removal of H2 of the reactor serving to drive the equilibrium of the dehydrogenation reaction towards hydroquinone formation. This situation is different from that of conventional hydrogenation/oxidation reactions where one of the gaseous reactants (hydrogen or oxygen) needs to diffuse from the gas to the liquid phase before it can reach the catalyst surface. This means that interactions between hydrogen (or oxygen) and the substrate on the catalyst surface are very important, with these types of catalytic hydrogenation/oxidation reactions strongly influenced by the hydrodynamics of the catalyst bed.57 However, for the dehydrogenation reaction, 1,4-cyclohexanedione is already present in the liquid phase around the catalyst particles, which means that its distribution over the catalyst active sites is more uniform as the catalyst bed is fully wetted due to the presence of strong capillary forces. Moreover, changing the substrate concentration levels (1, 5, and 10 wt%) resulted in a non-significant effect on conversion rate as confirmed by a P-value of >0.05 (Fig. S3, ESI†). The results clearly indicate that it is not possible to obtain complete conversion of 1,4-cyclohexanedione in a single pass. The maximum conversion per pass was found to be 79.1% under the operating conditions of T = 240 °C, FL = 0.1 mL min−1, FG = 45 mL min−1 and Co = 10 wt% but at the cost of lower selectivity of 91.9%. This result highlights the importance of finding an operating window to obtain maximum conversion while maintaining a selectivity of >99% at the same time.
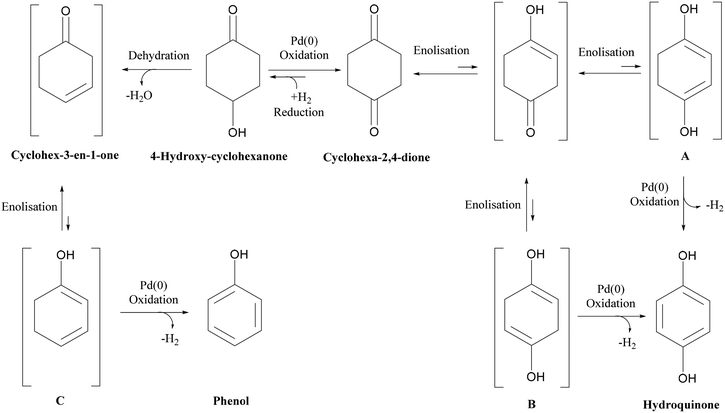 | ||
| Scheme 1 Reaction schematic for dehydrogenation of 1,4-cyclohexanedione and formation of 4-hydroxycyclohexanone and phenol by-products. | ||
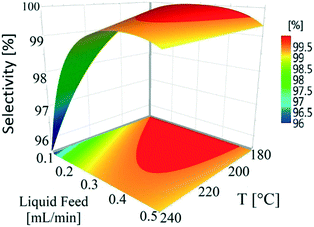
Temperature (180–240 °C) and liquid feed flow (0.1–0.5 mL min−1, 0.7–3.3 m3 m−2 h−1 at STP) showed a strong influence on selectivity as shown by the P-values (<0.05) of regression coefficients. Fig. 4 shows that the selectivity for hydroquinone declined with increasing temperature at lower liquid feed flow rates, which is likely linked to the residence time of 1,4-cyclohexadione (and 4-hydroxycyclohexanone) in the catalyst bed. An increase in liquid feed flow from 0.1 mL min−1 (235 °C, 5 wt% and 5 mL min−1) to 0.2 mL min−1 (240 °C, 5 wt% and 5 mL min−1) results in a significant improvement in selectivity from 91.9% to 99.4% but at the price of a drop in conversion values from 79.1% to 61.2%. The results clearly show a wide operating window to obtain >99% selectivity.
3.2. Influence of channel arrangement and time on stream composition
The mm-scale structured reactor used in this study is much smaller in size and throughput when compared to conventional batch reactors; however, the throughput of the structured reactor can be increased by numbering-up mm-scale parallel channels.19 The time required to reach >98% hydroquinone yield in semi-continuous mode was 9 h, with reaction time being potentially reduced for a fixed reaction volume being achieved through increasing the number of mm-scale channels employed.The reactor channels can be arranged in series to achieve higher yield, but this comes at a cost because of the need to use a large number of channels to drive conversion from 90% to >99%, caused by increasingly lower conversions per pass (see Fig. 7). For a recycling mode, the channels could potentially be arranged in series to increase reactor conversion per pass; however, the hydrogen produced in one channel may influence the selectivity in the next channel. To study the influence of produced hydrogen on side reactions, experiments were performed by connecting two channels in series, with and without intermediate gas removal, under operating conditions of T = 230 °C, 210 mg catalyst, back pressure = 1.5 bar, nitrogen flow rate = 35 mL min−1 (233.1 m3 m−2 h−1 at STP), liquid feed flow rate = 0.20 mL min−1 (1.4 m3 m−2 h−1 at STP), and substrate concentration = 5 wt%.
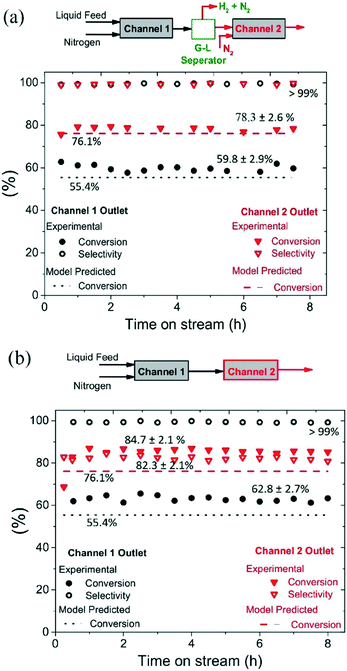
As shown in Fig. 6(a), two channels were connected with intermediate gas removal in a gas–liquid (G–L) separator, with a fresh nitrogen feed (35 mL min−1, 233.1 m3 m−2 h−1 at STP) then introduced into the second channel. At the outlet of the first channel, the conversion of 1,4-cyclohexanedione was found to be 59.8 ± 2.9%, which increased to 78.3% ± 2.6% in the second channel, with the selectivity for hydroquinone maintained at >99% for both channels. However, when the product of the first channel was directly introduced into the second channel (no gas removal step, Fig. 6b), and whilst the selectivity in the first channel was maintained at >99%, the selectivity in the second channel decreased to 82.3 ± 2.1% due to the presence of hydrogen in the feed resulting in the formation of 4-hydroxycyclohexanone. Therefore, the relatively high substrate conversion level (84.7 ± 2.1%) observed in the second channel is associated with the formation of 4-hydroxycyclohexanone and phenol side products arising from the unwanted hydrogenation pathway.
The catalyst maintained its stability for conversion and selectivity in the dehydrogenation reaction over the 8 h reaction period (see Fig. 6). These conversion values suggest that the dehydrogenation reaction reaches steady-state conditions in the first channel in less than 30 min, whereas it takes around 1 h to reach steady-state conditions in the second channel.
3.3. Semi-continuous dehydrogenation of 1,4-cyclohexanedione
The results of single-pass continuous dehydrogenation confirmed that the complete conversion of 1,4-cyclohexanedione is not achievable under the investigated conditions, which might be due to thermodynamic or kinetic limitations. In order to achieve complete conversion, the dehydrogenation reaction was performed in semi-continuous (recycle) mode in which the liquid product stream is recycled back as feed. The produced hydrogen is separated in the gas–liquid separator that is expected to overcome thermodynamic limitations when the product stream is recycled back along with hydroquinone, unconverted 1,4-cyclohexanedione and/or any by-product formed. Moreover, the rate of formation of the unwanted 4-hydroxycyclohexanone by-product is dependent on the concentration of hydrogen available to the catalyst bed. Therefore, the removal of hydrogen is also the key to minimize the reduction to 4-hydroxycyclohexanone. This could potentially be achieved by utilizing stoichiometric oxidants or hydrogen acceptors inside the catalyst bed or by removing the produced hydrogen outside the catalyst bed using a sweep gas while recycling the liquid product stream to achieve higher yields.In order to determine the optimum operating conditions for a recycling mode closely resembling the conditions for single-pass mode, a second set of experiments was performed while discarding the produced hydrogen through a gas–liquid separator. Table S2 (see the ESI†) shows the results of a second set of semi-continuous dehydrogenation experiments that were designed to study the influence of temperature (X1), nitrogen flow (X2), liquid flow (X3), and reactor inlet conversion (X5) on reactor outlet conversion (Y4), selectivity (Y5), and pressure drop (Y6). The experimental results were analysed and transformations were applied to obtain a normal distribution for better model estimation and statistical analysis. Negative logarithmic and logarithmic transformations were applied to analyse selectivities and pressure drops, whereas no transformation was required for recycled conversion. The quadratic models were developed according to eqn (6)–(8).
| Y4 = 63.01 + 8.58X1 + 1.09X2 − 8.74X3 + 32.38X5 − 6.36X1X5 − 9.49X3X5 + 10.49X52 | (6) |
| Y5 = 0.39 − 0.24X1 − 0.02X2 + 0.22X3 − 0.03X5 − 0.28X32 + 0.23X1X3 | (7) |
| Y6 = 0.81 − 0.02X1 + 0.21X2 + 0.17X3 + 0.07X5 − 0.15X22 | (8) |
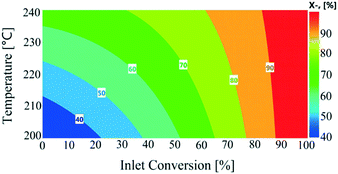
All the response functions showed a good fit to experimental data (Fig. S7, see the ESI†), with all the models significant and adequate, as confirmed by ANOVA (Table S3, see the ESI†). The P-values used to identify the significant model terms are given in Table S4 (see the ESI†). These results showed that nitrogen flow had a non-significant influence on the total conversion, as shown in Fig. S8 (see the ESI†). Total conversion was enhanced with a decreasing liquid feed flow rate, similar to conversion levels observed in the continuous experiments. The temperature showed an overall increasing trend on total conversion in the recycled experiments. The influence of varying reactor inlet conversion (0–100%) on recycled reactor outlet conversion is shown in Fig. 7. The reactor outlet conversion curves became steeper with increasing temperature; however increasing the reactor inlet conversion values resulted in a decrease in reactor outlet conversion which was attributed to a lower concentration of 1,4-cyclohexanedione being available to the catalyst. This behaviour suggests a higher number of recycles or reactors-in-series was required to reach close to 100% conversion.
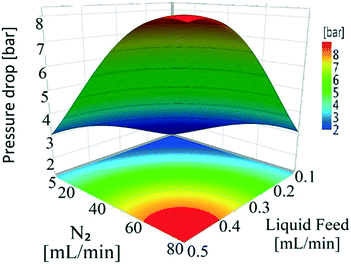
The influence of nitrogen flow, temperature, and liquid feed flow on selectivity is analogous to that observed in the continuous experiments (see Fig. S9 and S10, ESI†). The results proved that the presence of hydroquinone in the recycled feed had no effect on the selectivity, which is unsurprising as the hydroquinone product is expected to be stable and unreactive under the dehydrogenation conditions. Variations in pressure drop (Fig. S11, see the ESI†) in response to changes in operating factors were also analogous to those of the continuous experiments. However, an increase in pressure drop (∼4 bar) was observed with an increase in conversion from 0% to 100%, which was attributed to an increase in the density and viscosity of the mixture (Table S5, see the ESI†). Therefore, these results confirm that the selectivity values for hydroquinone formation of higher than 99% were present in the same region as seen under the continuous dehydrogenation conditions, suggesting that continuous experiment models could be utilized to identify the optimal conditions.
3.4. Optimization of liquid-phase dehydrogenation
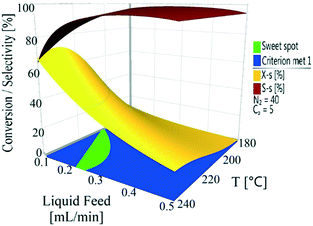
The conversion and selectivity of the dehydrogenation reaction of 1,4-cyclohexanedione was then optimized simultaneously using a multi-objective optimization process.59 The first objective is to achieve high selectivity to hydroquinone (>99%) which could be achieved in a wide process window, and the second objective is to achieve high 1,4-cyclohexanedione conversion (>99%). However, substrate conversion did not reach >99% in a single pass through the reactor in a continuous operation mode. The results of semi-continuous experiments showed that a large number of reactors in series would be required to achieve >99% conversion, which was not viable from an economical perspective due to high capital and operational costs. Therefore, as the presence of hydroquinone in the feed did not compromise selectivity in a semi-continuous operation mode, it is economically viable to recycle the liquid product while purging off the produced hydrogen to shift the equilibrium forward. Therefore, a conversion target for the second objective was selected as >40% substrate conversion.Optimal conditions for the developed models were determined using MODDE to generate a sweet spot plot for these transformations.60Fig. 8 shows the sweet spot plot obtained through RSM plots using MODDE, highlighting the process window where the reactor can be operated to meet the specified targets. The bright green area in the plot indicates the sweet spot where both objectives (conversion >40%, selectivity >99%) are met and the blue area indicates where only one target is fulfilled. A 4D contour plot for the sweet spot is shown in Fig. S12 (see the ESI†), indicating the sweet spots under the investigated conditions. A white area was identified at low liquid flow (0.10 mL min−1, 0.7 m3 m−2 h−1 at STP) where no objective was met and no sweet spot was identified for 0.50 mL min−1 (3.3 m3 m−2 h−1 at STP) liquid feed flow for a temperature range of 180–240 °C, nitrogen flow range of 5–85 mL min−1 (33.3–602.1 m3 m−2 h−1 at STP) and substrate concentration range of 1–10 wt%.
Within the identified optimal operating window, the reactor also requires a set point where the response remains insensitive to variation in a reasonable range of operating factors, described as a robust set-point. Based on the sweet spot plots, a criterion of 50% conversion and 99% selectivity was selected as target values for establishing an optimal robust set-point. Robustness analyses were carried out to find the robust set-point among the optimal set-points. A robust set-point was identified at a temperature of 231.4 °C, 69.3 mL min−1 (464.5 m3 m−2 h−1 at STP) nitrogen flow, 0.21 mL min−1 (1.4 m3 m−2 h−1 at STP) liquid feed flow and a concentration of 9.28 wt% 1,4-cyclohexanedione, which was predicted to afford 51.9% conversion and 99.3% selectivity with a pressure drop of 4.8 bar. This dehydrogenation model was validated by experimental testing using the robust set-point parameters, which gave conversion, selectivity and pressure drop values of 53.6%, 99.1% and 5.3 bar, which were 1.7%, 0.2% and 0.8 bar different from the predicted values, respectively.
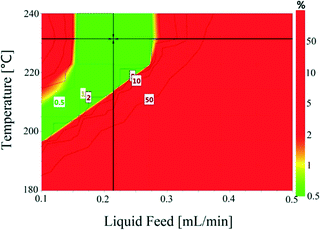
The final step in the process development was to establish optimal control ranges of operating conditions within which the performance (conversion and selectivity) of the dehydrogenation reaction could be maximized. This was achieved by identifying the design space, which was defined as a region of operating conditions with the least probability of failure to achieve the desired process output in the form of conversion, selectivity and pressure drop, as part of a quality by design approach.61Fig. 9 shows the design space generated by MODDE at the robust set-point with operating factors of temperature and liquid feed flow. Reactor conversion was assumed not to change while operating within the design space. The design space plots for 1,4-cyclohexanedione conversion as a function of nitrogen flow and substrate concentration are shown as Fig. S13 and S14 (see the ESI†), respectively, which enabled the development of strong process control procedures.
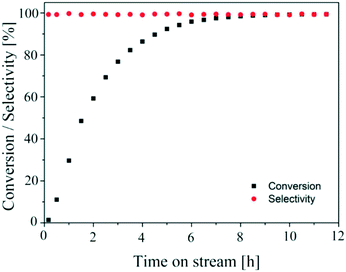
The aim of finding a robust set-point was to operate the reactor to achieve complete conversion (>99%) while keeping the selectivity >99% for a semi-continuous dehydrogenation process. Liquid phase semi-continuous dehydrogenation was carried out at a robust set-point at 231.4 °C temperature, 69.3 mL min−1 nitrogen flow (464.5 m3 m−2 h−1 at STP), and 0.21 mL min−1 (1.4 m3 m−2 h−1 at STP) liquid feed flow with an initial concentration of 9.28 wt% 1,4-cyclohexanedione in tetraethylene glycol dimethyl ether as solvent. The simplified schematic of the set-up to carry out a semi-continuous dehydrogenation reaction in the same reactor is shown in Fig. 10. The reactor was packed with 210 mg of 10 wt% Pd/C catalyst, the catalyst was pre-wetted with substrate, and the reactor temperature was increased to 231.4 °C with a nitrogen flow rate of 69.3 mL min−1 (464.5 m3 m−2 h−1 at STP). A liquid feed (9.28 wt% 1,4-cyclohexanedione) was then introduced at a rate of 0.21 mL min−1 (1.4 m3 m−2 h−1 at STP) into the reactor from a feed vessel containing 20 mL initial feed volume. The feed vessel was equipped with a stirrer to enable homogenous mixing of a recycled product stream, with any gases being vented to the atmosphere. The samples were collected from the feed vessel with time for analysis by 1H NMR spectroscopy and GC-MS. Fig. 11 shows the conversion of 1,4-cyclohexanedione and the selectivity for hydroquinone as a function of time on stream (h). The overall conversion is enhanced (1) by recycling of unconverted reactant and (2) by the removal of produced hydrogen in a G–L separator which removed the thermodynamic limitation. The selectivity for formation of hydroquinone was very high (>99%), which was maintained for ∼11 h under the investigated conditions.
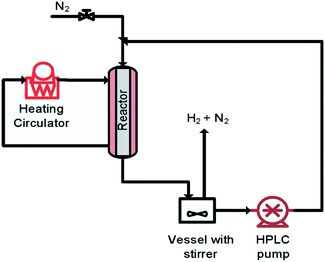 | ||
| Fig. 10 The simplified scheme of semi-continuous dehydrogenation (recycle mode) of 1,4-cyclohexanedione. | ||
As discussed in the introduction, the liquid phase dehydrogenation of 1,4-cyclohexanedione in a batch slurry reactor previously resulted in a hydroquinone yield of 91.5%.8 In contrast, a hydroquinone yield of >98% and no side products (>99% selectivity) was observed in the mm-scale structured multichannel reactor used in this study, which was shown to function over a wide operating range.
4. Conclusions
A highly selective and continuous-flow process is successfully developed for the liquid-phase dehydrogenation of 1,4-cyclohexanedione to hydroquinone over 10 wt% Pd/C catalyst in a scalable structured multichannel reactor. The design of experiment (DoE) methodology was utilized for experimental design to enhance process understanding and process optimization for the purpose of maximizing the yield. The experimental results were found to be in good agreement with the model's predicted values. Temperature and liquid feed flow strongly influenced the conversion and selectivity, with liquid feed and N2 flows influencing the pressure drop significantly. Sweet spot plots were successfully used for multi-objective optimization, with optimum operating conditions found at a robust set-point of 231.4 °C, 69.3 mL min−1 (464.5 m3 m−2 h−1 at STP) nitrogen flow, 0.21 mL min−1 (1.4 m3 m−2 h−1 at STP) liquid feed flow, and 9.28 wt% 1,4-cyclohexanedione concentration. The continuous-flow process was successfully demonstrated for liquid-phase dehydrogenation in single-pass and recycle modes. The results proved that complete conversion is not obtained in a single pass per channel which might be due to thermodynamic or kinetic limitations. However, the conversion increased from 59.8% for one-channel to 78.3% for two-channels-in-series while maintaining high selectivity (>99%) with intermediate hydrogen removal. Without the intermediate H2 removal step in the gas–liquid separator, the selectivity decreased to 82.3% in the second channel. Finally, the experiments in recycle mode demonstrated that almost complete conversion (>99%) of 1,4-cyclohexanedione was obtained for recycle mode dehydrogenation with very high selectivity (>99%) and yield (>98%).Conflicts of interest
There are no conflicts to declare.Acknowledgements
The authors acknowledge the EPSRC for funding the project “Terpene-based Manufacturing for Sustainable Chemical Feedstocks” EP/K014889/1. All the data of this study are available in the ESI.†References
-
T. Letcher, J. Scott and D. A. Patterson, Chemical Processes for a Sustainable Future, Royal Society of Chemistry, Abingdon, U. K., 2014 Search PubMed
.
-
P. Imhof and J. C. van der Waal, Catalytic Process Development for Renewable Materials, Wiley VCH, Weinhein, Germany, 2013 Search PubMed
.
-
R. A. Sheldon and H. van Bekkum, Fine Chemicals through Heterogeneous Catalysis, Wiley, 2008 Search PubMed
.
-
P. M. Hudnall, in Ullmann's Encyclopedia of Industrial Chemistry, Wiley-VCH Verlag GmbH & Co. KGaA, 2000, DOI:10.1002/14356007.a13_499
.
-
F. Gokden and A. Lazzarotto, Hydroquinone: Production, Uses, and Health Effects, Nova Science Publishers, 2012 Search PubMed
.
- N. N. Pozdeeva and E. T. Denisov, Kinet. Catal., 2011, 52, 506 CrossRef CAS
.
-
S. C. Gad and T. Pham, in Encyclopedia of Toxicology, Academic Press, Oxford, 3rd edn, 2014, pp. 979–981, DOI:10.1016/B978-0-12-386454-3.00855-1
.
-
H. Krekeler and W. H. Muller, US4024196A, 1977
.
- A. T. Nielsen and W. R. Carpenter, Org. Synth., 1965, 45, 25 CrossRef CAS
.
- K.-K. Cheng, X.-B. Zhao, J. Zeng and J.-A. Zhang, Biofuels, Bioprod. Biorefin., 2012, 6, 302–318 CrossRef CAS
.
- A. A. Lapkin, P. K. Heer, P. M. Jacob, M. Hutchby, W. Cunningham, S. D. Bull and M. G. Davidson, Faraday Discuss., 2017, 202, 483–496 RSC
.
- J. W. Zhang, Q. Q. Jiang, D. J. Yang, X. M. Zhao, Y. L. Dong and R. H. Liu, Chem. Sci., 2015, 6, 4674–4680 RSC
.
-
A. Cybulski, M. M. Sharma, R. A. Sheldon and J. A. Moulijn, Fine Chemicals Manufacture: Technology and Engineering, Elsevier Science, Amsterdam, The Netherlands, 1st edn, 2001 Search PubMed
.
- J. Salaklang, V. Maes, M. Conradi, R. Dams and T. Junkers, React. Chem. Eng., 2018, 3, 41–47 RSC
.
- S. Schwolow, A. Neumüller, L. Abahmane, N. Kockmann and T. Röder, Chem. Eng. Process.: Process Intesif., 2016, 108, 109–116 CrossRef CAS
.
- E. Novakova, N. Winterton, K. Jarosch and J. Brophy, Catal. Commun., 2005, 6, 586–590 CrossRef CAS
.
-
P. Kleinebudde, J. Khinast and J. Rantanen, Continuous Manufacturing of Pharmaceuticals, Wiley, 2017 Search PubMed
.
- V. Hessel, Chem. Eng. Technol., 2009, 32, 1655–1681 CrossRef CAS
.
- J. Wegner, S. Ceylan and A. Kirschning, Chem. Commun., 2011, 47, 4583–4592 RSC
.
- N. Kockmann, M. Gottsponer and D. M. Roberge, Chem. Eng. J., 2011, 167, 718–726 CrossRef CAS
.
- I. Rossetti and M. Compagnoni, Chem. Eng. J., 2016, 296, 56–70 CrossRef CAS
.
- A. Tanimu, S. Jaenicke and K. Alhooshani, Chem. Eng. J., 2017, 327, 792–821 CrossRef CAS
.
- Y. Su, Y. Zhao, F. Jiao, G. Chen and Q. Yuan, AIChE J., 2011, 57, 1409–1418 CrossRef CAS
.
-
M. F. Nagiev, The Theory of Recycle Processes in Chemical Engineering, Pergamon, 1964 Search PubMed
.
-
Z. R. Lazic, Design of Experiments in Chemical Engineering: A Practical Guide, Wiley, 2006 Search PubMed
.
- P. M. Murray, F. Bellany, L. Benhamou, D.-K. Bucar, A. B. Tabor and T. D. Sheppard, Org. Biomol. Chem., 2016, 14, 2373–2384 RSC
.
-
S. Soravia and A. Orth, in Ullmann's Encyclopedia of Industrial Chemistry, Wiley-VCH Verlag GmbH & Co. KGaA, 2000, DOI:10.1002/14356007.e08_e01.pub2
.
- S. A. Weissman and N. G. Anderson, Org. Process Res. Dev., 2015, 19, 1605–1633 CrossRef CAS
.
-
R. H. Myers, D. C. Montgomery and C. M. Anderson-Cook, Response Surface Methodology: Process and Product Optimization Using Designed Experiments, Wiley, 2016 Search PubMed
.
- D. V. Bavykin, A. A. Lapkin, S. T. Kolaczkowski and P. K. Plucinski, Appl. Catal., A, 2005, 288, 175–184 CrossRef CAS
.
- P. K. Plucinski, D. V. Bavykin, S. T. Kolaczkowski and A. A. Lapkin, Catal. Today, 2005, 105, 479–483 CrossRef CAS
.
- X. Fan, V. Sans, S. K. Sharma, P. K. Plucinski, V. A. Zaikovskii, K. Wilson, S. R. Tennison, A. Kozynchenko and A. A. Lapkin, Catal. Sci. Technol., 2016, 6, 2387–2395 RSC
.
- X. L. Fan, M. G. Manchon, K. Wilson, S. Tennison, A. Kozynchenko, A. A. Lapkin and P. K. Plucinski, J. Catal., 2009, 267, 114–120 CrossRef CAS
.
- T. Moreno, J. Garcia-Serna, P. Plucinski, M. J. Sanchez-Montero and M. J. Cocero, Appl. Catal., A, 2010, 386, 28–33 CrossRef CAS
.
- M. H. AlDahhan and M. P. Dudukovic, AIChE J., 1996, 42, 2594–2606 CrossRef CAS
.
-
N. M. Márquez Luzardo, Doctoral thesis, Technische Universiteit Delft, 2010 Search PubMed
.
- A. Faridkhou, J.-N. Tourvieille and F. Larachi, Chem. Eng. Process.: Process Intesif., 2016, 110, 80–96 CrossRef CAS
.
- J. A. Moulijn, M. Makkee and R. J. Berger, Catal. Today, 2016, 259, 354–359 CrossRef CAS
.
- S. T. Sie, Rev. Inst. Fr. Pet., 1991, 46, 501–515 CrossRef CAS
.
- S. T. Sie and R. Krishna, Rev. Chem. Eng., 1998, 14, 203–252 CAS
.
- B. H. Alsolami, R. J. Berger, M. Makkee and J. A. Moulijn, Ind. Eng. Chem. Res., 2013, 52, 9069–9085 CrossRef CAS
.
- C. Sievers, Y. Noda, L. Qi, E. M. Albuquerque, R. M. Rioux and S. L. Scott, ACS Catal., 2016, 6, 8286–8307 CrossRef CAS
.
- L. Rodríguez-García, R. Walker, E. Spier, K. Hungerbühler and F. Meemken, React. Chem. Eng., 2018, 3, 55–67 RSC
.
- D. E. Mears, Ind. Eng. Chem. Process Des. Dev., 1971, 10, 541–547 CrossRef CAS
.
-
G. Ertl, H. Knözinger and J. Weitkamp, Handbook of heterogeneous catalysis, VCH, Weinheim, 1997 Search PubMed
.
-
P. A. Ramachandran and R. V. Chaudhari, Three-phase catalytic reactors, Gordon and Breach Science Publishers, New York, 1983 Search PubMed
.
- A. Chantong and F. E. Massoth, AIChE J., 1983, 29, 725–731 CrossRef CAS
.
-
C. N. Satterfield and J. R. Katzer, in Molecular Sieve Zeolites-II, American Chemical Society, 1971, ch. 55, vol. 102, pp. 193–208 Search PubMed
.
- B. D. Prasher, G. A. Gabriel and Y. H. Ma, AIChE J., 1978, 24, 1118–1122 CrossRef CAS
.
- C. N. Satterfield, C. K. Colton and W. H. Pitcher, AIChE J., 1973, 19, 628–635 CrossRef CAS
.
-
J. M. Smith, Chemical Engineering Kinetics, McGraw-Hill, 1981 Search PubMed
.
-
C. N. Satterfield, Mass transfer in heterogeneous catalysis, M.I.T. Press, 1970 Search PubMed
.
- P. B. Weisz, Z. Phys. Chem., 1957, 11, 1–15 CrossRef CAS
.
-
J. Ermer and J. H. M. B. Miller, Method Validation in Pharmaceutical Analysis: A Guide to Best Practice, Wiley, 2006 Search PubMed
.
- User Guide to MODDE - Umetrics, https://umetrics.com/sites/default/files/downloads/1/user_guide_to_modde_10.1.pdf, 2017.
-
J. M. Winterbottom and M. King, Reactor Design for Chemical Engineers, CRC Press, 2018 Search PubMed
.
- N. Al-Rifai, F. Galvanin, M. Morad, E. H. Cao, S. Cattaneo, M. Sankar, V. Dua, G. Hutchings and A. Gavriilidis, Chem. Eng. Sci., 2016, 149, 129–142 CrossRef CAS
.
- A. Faridkhou, M. Hamidipour and F. Larachi, Chem. Eng. J., 2013, 223, 425–435 CrossRef CAS
.
-
G. P. Rangaiah and P. A. Bonilla-Petriciolet, Multi-Objective Optimization in Chemical Engineering: Developments and Applications, Wiley, 2013 Search PubMed
.
-
E. Castillo, Process Optimization: A Statistical Approach, Springer US, 2007 Search PubMed
.
- C. Hakemeyer, N. McKnight, R. St. John, S. Meier, M. Trexler-Schmidt, B. Kelley, F. Zettl, R. Puskeiler, A. Kleinjans, F. Lim and C. Wurth, Biologicals, 2016, 44, 306–318 CrossRef PubMed
.
Footnote |
| † Electronic supplementary information (ESI) available. See DOI: 10.1039/c8re00176f |
| This journal is © The Royal Society of Chemistry 2019 |

