 Open Access Article
Nanoporous MIL-101(Cr) as a sensing layer coated on a quartz crystal microbalance (QCM) nanosensor to detect volatile organic compounds (VOCs)†
Elahe Haghighi and
Sedigheh Zeinali *
*
Department of Nanochemical Engineering, Faculty of Advanced Technologies, Shiraz University, Shiraz, Iran. E-mail: zeinali@shirazu.ac.ir
First published on 7th August 2019
Abstract
The application of metal–organic frameworks (MOFs) as a sensing layer has been attracting great interest over the last decade, due to their high porosity and tunability, which provides a large surface area and active sites for trapping or binding target molecules. MIL-101(Cr) is selected as a good candidate from the MOFs family to fabricate a quartz crystal microbalance (QCM) nanosensor for the detection of volatile organic compound (VOC) vapors. The structural and chemical properties of synthesized MIL-101(Cr) are investigated by X-ray diffraction (XRD), Fourier-transfer infrared spectroscopy (FTIR) and scanning electron microscopy (SEM) and so on. A stable and uniform layer of MOF is coated onto the surface of a QCM sensor by the drop casting method. The frequency of the QCM crystal is changed during exposure to different concentrations of target gas molecules. Here, the sensor response to some VOCs with different functional groups and polarities, such as methanol, ethanol, isopropanol, n-hexane, acetone, dichloromethane, chloroform, tetrahydrofuran (THF), and pyridine under N2 atmosphere at ambient conditions is studied. Sensing properties such as sensitivity, reversibility, stability, response time, recovery time, and limit of detection (LOD) of the sensor are investigated. The best sensor response is observed for pyridine detection with sensitivity of 2.793 Hz ppm−1. The sensor shows short response/recovery time (less than two minutes), complete reversibility and repeatability which are attributed to the physisorption of the gases into the MOF pores and high stability of the device.
1. Introduction
Volatile organic compounds (VOCs) are the most important groups of air pollutants and are health hazards which contain aromatics, aldehydes, ketones, alkanes, alcohols etc. Due to their low boiling point and high volatility, they can be easily released into the environment. Many VOCs are carcinogens depending on exposure period and concentration that can cause cancers such as lymphatic and hematopoietic types. They can also cause serious harm to the liver and kidneys as well as the immune, nervous, reproductive systems, if they are ingested by drinking or eating, inhaled, or absorbed through the skin.1,2 Therefore, due to all these mentioned harmful effects, there is urgent need to fabricate sensitive, selective, stable and reliable detection devices for monitoring toxic gas species in the atmosphere. Although gas chromatography and mass spectrometry are reliable systems with high accuracy for detecting VOCs, they are expensive, time consuming, require trained operators, have large device size and cannot be used for online real time monitoring.3 In order to overcome these challenges, chemical gas sensors have been developed including electrochemical,4 metal oxide semiconductor (MOS),5 quartz crystal microbalances (QCM),6–9 surface acoustic wave (SAW) sensors,10 optical-fiber sensors,11 fluorescent sensors,12 micro-capacitors,13 resistors14 and so on. Chemical sensors are composed of sensitive layer and transducing element parts. Upon the chemical or physical interaction between gas and sensing materials, their properties such as resistance, capacitance, work function, ion mobility, mass, absorbance, or luminescence will change. The transducing element converts these changes to observable physical quantities such as resistance, capacitance, frequency or absorbance.3 However, most of these sensors have disadvantages such as low sensitivity, low selectivity, large detection limit, and high operational temperature (especially in MOS sensors).To obtain high sensitive, rapid and easy gas sensors at room temperature, QCM sensors based on the piezoelectric effect of the quartz crystal has been a promising candidate. QCM is the simplest and most commercialized type of thickness shear mode (TSM) acoustic wave devices and mostly applied for microgravimetering (it can determine even nanogram level mass changes) monitoring. It comprises of a slice of quartz with two electrodes deposited on its faces. When an AC voltage is applied to the electrodes of the piezoelectric quartz, it starts to vibrate and propagate a shear wave with a certain frequency known as the resonance frequency. When a mass loads onto the surface of the quartz crystal, its resonance frequency will change. The frequency shifts of crystal considered as sensor signal depends on mass loading.
The relationship between the mass loading and frequency shift is described by Sauerbrey eqn (1.1).15 For an AT-cut quartz crystal is defined as:
 | (1.1) |
There are many methods to coat a sensing layer onto the surface of QCM electrode such as drop casting,30 electrospinning or electrospraying,31 spin coating,32 electrochemical deposition,33 thermal evaporation,34 dip coating,30 chemical or physical vapor deposition,35 spray gun (airbrush),36 plasma enhanced chemical vapor deposition,37 Langmuir–Blodgett (LB) film,38 liquid phase epitaxy (LPE),39 and so on. Each method has advantages depending on the molecular weight, density, viscosity, chemical and physical nature of solution or nanomaterial.
MOFs as new hybrid crystalline porous materials have been attracting attention, due to their high porosity and tunability, which provides a large surface area and active sites for trapping or binding a target analyte.28 MOFs are made of metal ions and organic ligands which have high mechanical, thermal, and chemical stabilities. High porosity and regularity and uniformity of their pore size make them show high rates of molecular transport.25 They are used in wide range of applications, including gas storage,40 membrane separation,41 molecular sieves,42 heterogeneous catalyst,43 desiccants,44 encapsulation,45 ion exchangers,46 drug delivery,47 photocatalysis,48 electronics,49 etc. The reversible sorption behavior of MOFs makes them suitable for gas sensing purposes.50–53 MOFs have been used to detect various gases such as H2O, O2, H2S, and many VOCs.54–56
The use of QCM sensors for detection of VOCs at room temperature are the best choice, because other chemical sensors at room temperature are not usually possible. In most of them an electronic property of sensitive materials such as conductivity, capacitance, and so on, should be altered through chemical reactions between analyte molecules and the sensitive material. Therefore, this requires high activation energy or high operating temperatures that cannot be performed at room temperature, especially when VOCs are less reactive and more stable, and electrons may not easily transfer at room temperature. However, QCM is a gravimetric sensor, and it is not important whether electron exchanging or chemical reaction occurs between analyte and the sensing layer. What matters is the adsorption of analytes onto the sensing layer in order to detect VOCs at room temperature.
In this work MIL-101(Cr) was selected as a good sensing material among thousands of MOFs due to its high porosity, huge surface area to fabricate gravimetric mass sensor based on QCM for detection of VOCs. The synthesis of MIL-101(Cr) was reported by Férey et al.57 for the first time. It is built up from trimers of Cr octahedral with terminal ligands (H2O, F, or OH) linked by rigid carboxylate ligands, and has a giant pore volume, large surface area, numerous unsaturated Cr metal sites, and two types of mesoporous cages (29 and 34 Å in diameter) with microporous windows (12 and 16 Å in diameter).58 Drop casting as a simple inexpensive available coating method was chosen for deposition of MIL-101(Cr) onto the electrodes of QCM crystal. Nine types of VOCs with various functional groups and polarities (i.e., methanol, ethanol, 2-propanol, n-hexane, dichloromethane, chloroform, acetone, tetrahydrofuran (THF), and pyridine) were tested as targets. During the adsorption of VOC molecules in the pores of MOF, the mass on the surface of quartz crystal and consequently the frequency would change. The frequency variations as the sensor response were followed vs. VOCs concentrations. Sensing properties such as sensitivity, reversibility, stability, response time, recovery time, and limit of detection (LOD) of the sensor in the presence of all mentioned analytes were investigated. All sensing measurements were carried out at atmospheric pressure and room temperature under N2 condition.
2. Experimental
2.1. Materials and methods
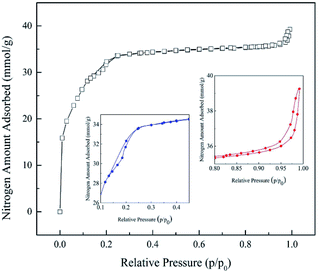
MIL-101(Cr) texture properties were investigated with N2 adsorption/desorption by BET technique (Micromeritics ASAP 2020). Before measurement of pore properties, sample was activated by degassing under vacuum at 150 °C for 3 h to remove all water molecules that occupied in the sample pores.
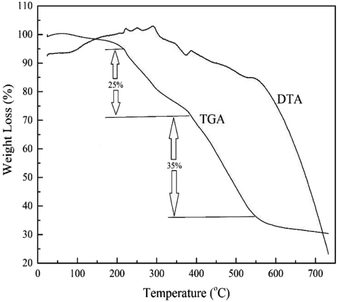
MIL-101(Cr) thermal stability was evaluated by thermogravimetric analyzer (BAHR, STA503, Iran). Weight loss percentages of 8.4 mg of MIL-101(Cr) in temperature range, 25–750 °C, with 10 °C min−1 temperature rate and continuous nitrogen flow (0.4 L h−1) was applied.
2.2. Synthesis of MIL-101(Cr)
2 g of chromium nitrate was dissolved in 12 ml deionized distilled water. Then 0.83 g terephthalic acid was dissolved in 12 ml deionized distilled water in separate vessel. Because of low solubility of terephthalic acid in water, mixture should be sonicated for 20 min to achieve a homogenous suspension and then was added to the first solution. Then, 0.1 ml HF (40% w/w) was added to above mixture and stirred for 15 min and finally was loaded into a Teflon lined autoclave and placed in an oven at 493 K for 8 h.59 After cooling to room temperature, the MOF precipitates were separated from water by centrifugation (5800 rpm, 20 min). MOF precipitate was washed with distilled water (thrice) and dimethylformamide (twice). Finally, washed MOF precipitate was dried in oven at 343 K for 24 h and stored in dry place. The synthesized MOF should be characterized to identify size, shape, structure, crystallinity, surface area and thermal stability. Therefore, SEM, FTIR, XRD, BET, and TGA techniques were used.2.3. Fabrication of MIL-101(Cr) based QCM gas sensor
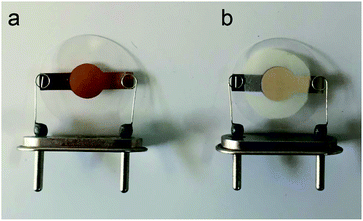
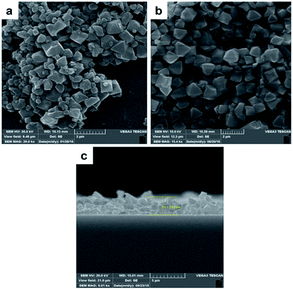
An AT-cut QCM crystals and its oscillator circuit were purchased from international crystal manufacturing (ICM) company. The quartz crystals had blank diameters of 0.5 in. with a resonant frequency of 10.000 MHz. Both top and bottom surfaces were coated with Au electrodes of 0.2 in. diameter (Fig. 1a). At first the crystal was rinsed with deionized water and then with ethanol and dried in ambient condition for about 20 minutes after that it was put in QCM circuit, the frequency meter showed 10.01055 MHz as resonance frequency of crystal. It was stored in desiccator in order not to adsorb moisture and other particles in the air until film fabrication. 10 mg of synthesized MOF powder was mixed vigorously with 5 ml of ethanol to make a suspension (0.2% w/v) then it was put in ultrasonic bath to disperse particles uniformly. This suspension was drop-casted at the center of crystal electrode using a 100 μl micropipette. Six, 20 μl, drops were dropped onto the electrode by time increments of seven minutes to ensure evaporation of solvent before next dropping, in order to make a good adhesion to the surface and avoiding agglomeration. The crystal was then put inside an oven at 150 °C for 17 hours. Fig. 1b shows the final coated crystal. The prepared QCM sensor was stored in vacuum desiccator to make it reusable; however, the film might be removed by mechanical force. The frequency shift caused by film deposition was calculated by subtracting the resonance frequency before coating from the frequency after the film had been dried. The frequency change of coating was about 42 kHz. The structure, morphology and thickness of the film were analyzed by FTIR and SEM.2.4. Experimental setup
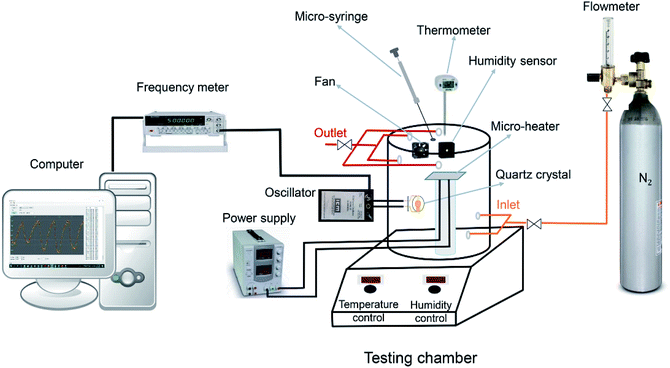
Scheme 1 is the schematic diagram of a measurement setup which was designed and fabricated in our lab for VOCs detection, under N2 condition. The MIL-101(Cr) based QCM sensor was installed in an oscillator circuit loop whose output frequency was measured by frequency meter (Dagatron 8037, 3.7 GHz) and recorded by a computer via RS232 interface which data were logged by a software written in C sharp. The coated QCM was placed in a sealed Teflon chamber with 3.7 liter in volume at room temperature. As many parameters may affect the resonance frequency of the crystal such as temperature fluctuations, pressure variations and moisture, to reduce these effects on the real sensor responses to VOC molecules, a modified setup was designed to control these parameters as much as possible. First of all, we turned on the fan and heater in the chamber subsequently opened all valves (the sequence of opening valves was: outlet, inlet and flowmeter valves respectively to avoid pressurizing) to purge nitrogen gas inside the chamber until a stable frequency line was obtained. In each gas exposure, the total flow rate was kept constant at 3 L min−1, using a flowmeter. By purging nitrogen, the moisture would be washed through the chamber and frequency changes would be related to only added analytes not anymore species. During above steps, heater and fan were kept on to ensure achieving uniform chamber temperature and analytes concentration. Afterwards, all valves should be closed (the sequence of closing valves was: flowmeter, inlet and outlet valves, respectively) and analytes in liquid form with known volume were injected inside the testing chamber by a micro-syringe on a micro-heater to make them vapor. The chamber temperature during measurements remained around 30 ± 1 °C. After evaporation, the molecules of analyte were trapped into MOF pores, therefore, the mass on the crystal was increased which led to decrease in its frequency. After the frequency reached plateau, all valves were opened in sequence mentioned above and N2 was purged again to remove adsorbed analyte molecules until the frequency came back to its initial value.2.5. Concentration determination
The concentration of injected analytes were calculated according to the following equation:60
 | (2.1) |
3. Results and discussion
3.1. MOF powder and MOF film characterization
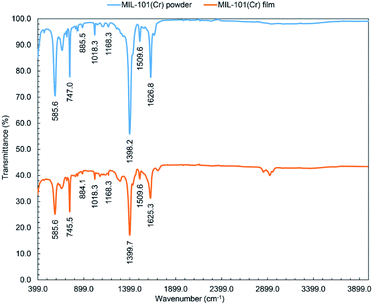
![[double bond, length as m-dash]](https://www.rsc.org/images/entities/char_e001.gif) C) at 1510 cm−1 and vibration (C–H) at 1168, 1018, 885, and 747 cm−1.62
C) at 1510 cm−1 and vibration (C–H) at 1168, 1018, 885, and 747 cm−1.62
3.2. Sensing properties and responses of MIL-101(Cr) based QCM sensor
There are various important factors, need to be considered, for design of gas sensors. Generally, they contain sensitivity, selectivity, repeatability and reversibility, stability, response and recovery time, reproducibility of fabrication of sensing film, linear range, and limit of detection.The set-up shown in Scheme 1 was employed to measure the sensor responses at room temperature to different VOCs concentrations including methanol, ethanol, 2-propanol, acetone, THF, dichloromethane, chloroform, n-hexane, and pyridine. Chemical properties and threshold limit values (TLV) of mentioned VOCs are given in Table 1.
| Analyte | Type | ρ (g ml−1) | Mw (g mol−1) | Boiling point (°C) | Vapor pressure (kPa) @ 20 °C | Dielectric constant (20 to 25 °C) | Polarity | TLV (ppm) |
|---|---|---|---|---|---|---|---|---|
| Methanol | Alcohol | 0.79 | 32.04 | 64.70 | 12.98 | 33.1 | Polar protic | 200 |
| Ethanol | 0.79 | 46.07 | 78.24 ± 0.09 | 5.83 | 24.3 | 1000 | ||
| 2-Propanol | 0.79 | 60.10 | 82.60 | 4.24 | 18.3 | 200 | ||
| Acetone | Ketone | 0.78 | 58.08 | 56.05 | 24.57 | 20.7 | Polar aprotic | 500 |
| Chloroform | Halomethane | 1.49 | 119.38 | 61.15 | 21.09 | 4.8 | Non polar | 10 |
| Dichloromethane | 1.33 | 84.39 | 39.60 | 57.30 | 9.1 | Polar | 25 | |
| n-Hexane | Alkane | 0.66 | 86.18 | 68.50 to 69.10 | 16.18 | 1.89 | Non polar | 50 |
| Pyridine | Heterocyclic aromatic | 0.98 | 79.10 | 115.20 | 2.13 | 12.3 | Polar | 1 |
| THF | Heterocyclic aliphatic | 0.89 | 72.11 | 66.00 | 17.60 | 7.85 | Polar | 50 |
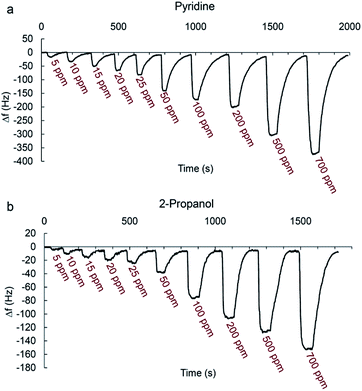
Fig. 7a and b shows typical real-time response curves of the sensor to pyridine and 2-propanol vapors with increasing concentrations from 5 to 700 ppm. By injection of a certain volume of VOC in the chamber, frequency decreased very rapidly till reaching the steady state value. Then, sensor was exposed to the N2 with a flow rate of 3 L min−1 for several seconds for recovering baseline value of the frequency signal. The frequency difference between baseline value and equilibrium value after sorption of vapor was taken as the sensor response. It is defined as:
| Δf = f − f0 | (3.1) |
When the test chamber was purged with N2, frequency of sensor returned to the original values each time with negligible baseline drift indicating the complete desorption of analyte vapors from the sensing film. Sometimes a small change in baseline value occurs during the repeated frequency measurement by the exposure of the analytes. This is expected since when VOC molecules are absorbed by the film, there may be changes in its viscoelastic properties65 or maybe analytes are not completely flushed out of the sensor when using N2 to recover the sensor.
When the concentration increases, the sensor response increases accordingly since higher concentrations make the sensing film adsorb more molecules.
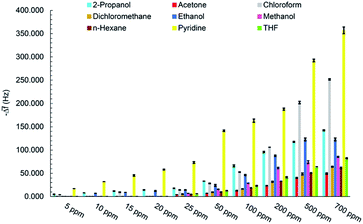
The real-time response of sensor to other analytes in different concentrations was also investigated (Fig. S1–S7†) and an overall view of them is shown in Fig. 8 by bar diagrams. Among these compounds, the sensor response is the highest for pyridine vapors in all concentration ranges.
3.3. Reversibility, repeatability and response/recovery time of the QCM sensor
To evaluate the gas sensing performances, the MIL-101(Cr) coated QCM sensor was repeatedly exposed to a constant concentration of analyte for three times. The dynamic sensor responses versus time at different concentrations (5–700 ppm) for pyridine and 2-propanol vapors were plotted in Fig. 9a and b. The higher the concentration the higher signal-to-noise ratio and the smoother curves are obtained. Similar response/recovery curves were obtained for other analytes (Fig. S8–S14†). For three successive cycles, the response curves were similar under the same exposure, almost with no significant changes in sensor response. The response time to reach 90% of the final equilibrium value when exposed to VOC vapor in different concentrations was between 8 to 24 s for pyridine and 7 to 14 s for 2-propanol during three cycles. The recovery time required to return to 10% of the equilibrium baseline value following the dry N2 purge was between 61 to 118 s for pyridine and 30 to 86 s for 2-propanol during three cycles. Table S1† depicts the sensor mean response, response and recovery time for all analytes in different concentrations with standard deviation (n = 3). These results demonstrate the excellent reversibility and repeatability of MIL-101(Cr) based QCM sensor and consequently shows good sensing properties of sensing film due to its high surface area, uniformity, rigidity, stiffness and thin layer which leads to better stability of sensor. The reversible response suggests that the analytes adsorption on the sensing film is rarely weak, such as hydrogen bonding and van der Waals force. Moreover, the rapid vapor sorption and desorption curves indicate that fast mass equilibrium occurred on the MIL-101(Cr) sensing film. The nanopores provide a route for fast mass transport, explaining why the response times are significantly short.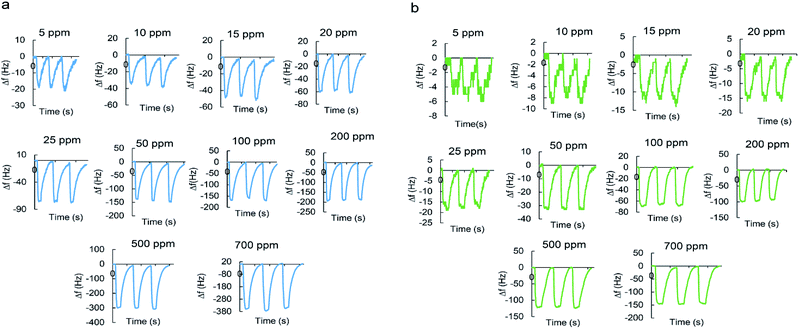 | ||
| Fig. 9 Reversibility and repeatability of sensor response versus time to (a) pyridine; and (b) 2-propanol. | ||
3.4. Calibration curves for MIL-101(Cr) based QCM sensor
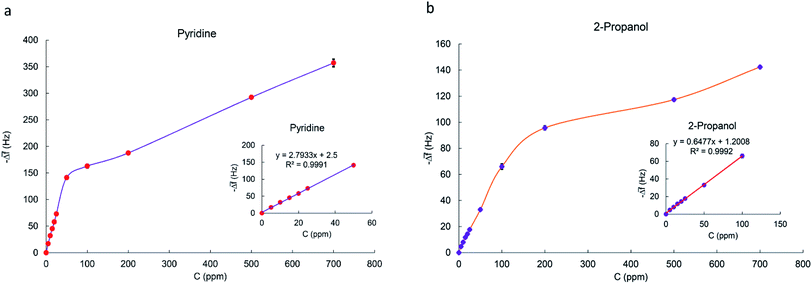
To realize sensitivity and linear detection range of the fabricated QCM sensor to the analytes, calibration curves were fitted by the linear regression model. The relation between frequency shift (y) and vapor concentration (x) is shown in Fig. 10a and b for pyridine and 2-propanol respectively. It can be seen that Δf is linear to pyridine and 2-propanol in the concentration range of 5–50 ppm and 5–100 ppm as the Sauerbrey equation described. The slope of regression equation is considered as sensitivity. When concentration is more than 50 or 100 ppm, the response does not increase linearly as before and the saturation of the sensor is observed. Calibration curves fitted by linear regression model are plotted in Fig. S15–S21† for other VOC vapors. The sensor has the highest sensitivity towards pyridine vapors and the lowest for acetone vapors. The sensitivity, linear range and correlation coefficient of VOCs vapors are listed in Table 2.| Analyte | Sensitivity (Hz ppm−1) | R2 | Linear detection range (ppm) | SB (Hz) | LOD (ppm) |
|---|---|---|---|---|---|
| Methanol | 0.306 | 0.999 | 25–200 | 1.072 | 10.511 |
| Ethanol | 0.429 | 0.998 | 10–200 | 1.268 | 8.862 |
| 2-Propanol | 0.648 | 0.999 | 5–100 | 0.660 | 3.056 |
| Acetone | 0.114 | 0.996 | 25–200 | 0.655 | 17.186 |
| Chloroform | 0.524 | 1.000 | 5–200 | 0.802 | 4.593 |
| Dichloromethane | 0.155 | 0.997 | 25–200 | 0.731 | 14.170 |
| n-Hexane | 0.164 | 0.995 | 25–200 | 1.075 | 19.664 |
| Pyridine | 2.793 | 0.999 | 5–50 | 1.492 | 1.603 |
| THF | 0.205 | 0.996 | 25–200 | 1.259 | 18.398 |
3.5. Limit of detection (LOD)
One of the other statistical criteria for evaluation of the sensor performance is limit of detection (LOD). LOD can be calculated using calibration curves in the linear range by the following equation.66
 | (3.2) |
 | (3.3) |
According to this equation, calculated LOD values for pyridine and 2-propanol were obtained as 1.603 and 3.056 ppm respectively. The detection limits of other analytes were also calculated in the same way (Table 2).
3.6. Selectivity
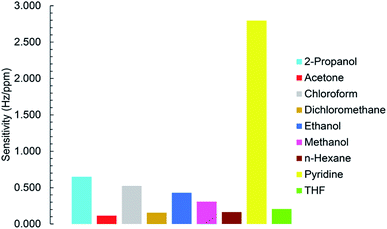
To investigate the selectivity of the sensor to studied VOCs, all sensitivity values were plotted as a function of VOCs types (Fig. 11). Fig. 11 shows MIL-101(Cr) based QCM sensor was performed more efficient in the presence of pyridine.3.7. Long term stability
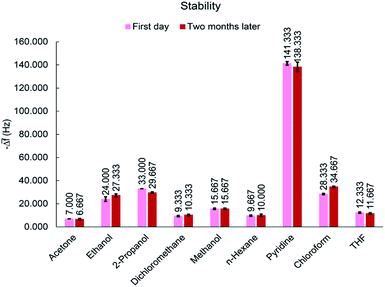
The long term stability is a function of the phenomena leading to random walk (e.g., temperature variations or component aging).25 For applicable chemical gas sensors, stability is a very important factor. To investigate the life-time of MIL-101(Cr), the response of the sensor to 50 ppm of all analytes was tested after two months. During this time, the sensor was stored in a vacuum desiccator at room temperature. As shown in Fig. 12, response of the sensor to the same concentrations of VOCs remained almost constant after a period of time, indicating an acceptable stability for proposed sensor. This good stability is an evidence for maintenance of the sensor properties and no aging process.3.8. Sensing mechanism
In general, it is considered that gas adsorption occurs by three steps: adsorption, diffusion, and desorption process. When the sensor is exposed to VOC molecules, the frequency decreases sharply with time which results from surface adsorption effect. Then, the frequency decreases slowly, mainly resulting from bulk diffusion effect. After reaching equilibrium, the frequency attains a stable value. The recovery also shows a rapid increase followed by a slow increase of frequency when the vapors are desorbed, which is also due to surface effect and bulk effect.32The magnitude of the sensor response is dependent on two main factors: molar adsorption potential and molecular weight of analytes. Molar adsorption potential is considered as the polarizability of the gas to provide van der Waals interactions with the sensing film and the compatibility of the kinetic diameter of the gas with the aperture size of MOF pores. So both of factors together determine the magnitude of sensor response.24
The frequency shifts and also the sensitivity of the MIL-101(Cr) coated QCM sensor for the alcoholic polar protic organics are in the following order: 2-propanol > ethanol > methanol. This result indicates that a larger molecular weight has a higher sensitivity, which is in good agreement with the previous works.32,67 It is reasonable to assume that if the number of adsorbed molecules on the sensing film is identical for various analytes, a greater molecular weight of analyte will actually lead to a larger sensor response. The frequency shifts and sensitivity of sensor for the halomethanes are in the following order: chloroform > dichloromethane. It may expect that dichloromethane induces a higher Δf as compared to chloroform, due to its higher polarity (dielectric constant). But, higher sensitivity is observable for chloroform which is due to its higher molecular weight.
Two various polar organic molecules for example 2-propanol and acetone were compared here. Since 2-propanol is a protic compound due to the presence of –OH group, it can form strong hydrogen bonds with the sensing material; consequently, more molecules were adsorbed and provide enhanced sensitivity; however, acetone is an aprotic compound and there is no hydrogen bond formation.
As a final consequence, the highest sensitivity was observed for pyridine among all analytes. This can due to having the lowest vapor pressure and large molecular weight. Also, it is the only analyte with aromatic ring which can have strong π–π stacking interaction with aromatic rings in the linker of MOF. These accumulative factors may lead to highest sensitivity for pyridine.
4. Conclusion
A highly sensitive, stable and low-cost gas sensor based on MIL-101(Cr) coated onto QCM was developed using a facile approach. MIL-101(Cr) was selected from MOFs family since its 3D octahedral nanoporous architecture supplies high diffusion paths for VOC molecules sorption and its huge surface area uploads more sensing agents. Other benefits of MOFs are mechanical, chemical and thermal stability and they are very good candidate for VOCs sensing application at room temperature.MIL-101(Cr) was successfully synthesized and deposited onto the Au electrode of the QCM sensor by using drop casting method. Structural and morphological characterizations of the fabricated samples were performed by using FTIR, SEM and other characterization methods mentioned before. Gas sensing measurements of the fabricated film were done at room temperature for VOCs detection such as methanol, ethanol, 2-propanol, acetone, n-hexane, THF, chloroform, dichloromethane, and pyridine. The response of sensor to different concentrations of VOCs was investigated and the detection limit for detection of all analytes was calculated. Good sensitivity, reversibility, repeatability and long term stability were obtained at room temperature for all analytes. Linear calibration curves were obtained between the frequency shift and the concentration of all the analytes in range of 5–200 ppm. Sensor showed sensitivity in the range of 0.114–2.793 Hz ppm−1 to the VOCs. The sensing film afforded selective adsorption towards specific VOCs based on the different driving forces including polarity, compatibility of pore size of sensing film with size of analyte molecules, molecular weight of analytes and type of interaction between analytes and sensing film. The highest sensitivity (3 to 24 times more than other analytes) was observed for pyridine vapors due to π–π interaction with MOFs linker moieties. It shows that the proposed sensor can operate more selective to pyridine among all applied analytes and consequently the lowest LOD value was obtained for pyridine. The physical adsorption of analytes onto the film surface and their fast mass transferring through the open windows and mesoporous cages of MIL-101(Cr) can be claimed because of fast response/recovery time and reversible response. The sensor was reusable after complete removal of analyte by N2 purging into the sensor test chamber. Therefore, the reversible and stable response of the film indicated that MOF film can be successfully used for sensing applications.
Conflicts of interest
There are no conflicts to declare.Acknowledgements
We really appreciate Dr Saeed Shabanian for his generous helps and also Shiraz University.References
- T. Endo, Y. Yanagida and T. Hatsuzawa, Sens. Actuators, B, 2007, 125, 589–595 CrossRef CAS.
- F. Xu, L. Sun, P. Huang, Y. Sun, Q. Zheng, Y. Zou, H. Chu, E. Yan, H. Zhang, J. Wang and Y. Du, Sens. Actuators, B, 2018, 254, 872–877 CrossRef CAS.
- S. Öztürk, A. Kösemen, Z. Şen, N. Kılınç and M. Harbeck, Sensors, 2016, 16, 423 CrossRef PubMed.
- M. I. Mead, O. A. M. Popoola, G. B. Stewart, P. Landshoff, M. Calleja, M. Hayes, J. J. Baldovi, M. W. McLeod, T. F. Hodgson, J. Dicks, A. Lewis, J. Cohen, R. Baron, J. R. Saffell and R. L. Jones, Atmos. Environ., 2013, 70, 186–203 CrossRef CAS.
- W.-M. Zhang, J.-S. Hu, W.-G. Song and L.-J. Wan, Sens. Actuators, B, 2007, 123, 454–460 CrossRef CAS.
- Y. Lu, Y. Chang, N. Tang, H. Qu, J. Liu, W. Pang, H. Zhang, D. Zhang and X. Duan, ACS Appl. Mater. Interfaces, 2015, 7, 17893–17903 CrossRef CAS PubMed.
- Y. Kosaki, H. Izawa, S. Ishihara, K. Kawakami, M. Sumita, Y. Tateyama, Q. Ji, V. Krishnan, S. Hishita, Y. Yamauchi, J. P. Hill, A. Vinu, S. Shiratori and K. Ariga, ACS Appl. Mater. Interfaces, 2013, 5, 2930–2934 CrossRef CAS PubMed.
- Z. Zhang, J. Fan, J. Yu, S. Zheng, W. Chen, H. Li, Z. Wang and W. Zhang, ACS Appl. Mater. Interfaces, 2012, 4, 944–949 CrossRef CAS PubMed.
- N. Bachar, L. Liberman, F. Muallem, X. Feng, K. Müllen and H. Haick, ACS Appl. Mater. Interfaces, 2013, 5, 11641–11653 CrossRef CAS PubMed.
- M. J. Fernández, J. L. Fontecha, I. Sayago, M. Aleixandre, J. Lozano, J. Gutiérrez, I. Gràcia, C. Cané and M. del C. Horrillo, Sens. Actuators, B, 2007, 127, 277–283 CrossRef.
- C. Elosua, I. Matias, C. Bariain and F. Arregui, Sensors, 2006, 6, 1440–1465 CrossRef CAS.
- G. G. Surpateanu, M. Becuwe, N. C. Lungu, P. I. Dron, S. Fourmentin, D. Landy and G. Surpateanu, J. Photochem. Photobiol., A, 2007, 185, 312–320 CrossRef CAS.
- S. V. Patel, T. E. Mlsna, B. Fruhberger, E. Klaassen, S. Cemalovic and D. R. Baselt, Sens. Actuators, B, 2003, 96, 541–553 CrossRef CAS.
- X. Wang, S. Hou, H. Goktas, P. Kovacik, F. Yaul, A. Paidimarri, N. Ickes, A. Chandrakasan and K. Gleason, ACS Appl. Mater. Interfaces, 2015, 7, 16213–16222 CrossRef CAS PubMed.
- J. Polo, E. Llobet, X. Vilanova, J. Brezmes and X. Correig, Electron. Lett., 1999, 35, 772 CrossRef CAS.
- A. H. Khoshaman and B. Bahreyni, in Proceedings of IEEE Sensors, Elsevier, 2011, vol. 162, pp. 1101–1104 Search PubMed.
- M. M. Aria, A. Irajizad, F. R. Astaraei, S. P. Shariatpanahi and R. Sarvari, Measurement, 2016, 78, 283–288 CrossRef.
- L. R. Khot, S. Panigrahi and D. Lin, Sens. Actuators, B, 2011, 153, 1–10 CrossRef CAS.
- N. Horzum, D. Tascioglu, C. Özbek, S. Okur and M. M. Demir, New J. Chem., 2014, 38, 5761–5768 RSC.
- I. Sasaki, H. Tsuchiya, M. Nishioka, M. Sadakata and T. Okubo, Sens. Actuators, B, 2002, 86, 26–33 CrossRef CAS.
- H.-B. Lin and J.-S. Shih, Sens. Actuators, B, 2003, 92, 243–254 CrossRef CAS.
- S. Sankaran, S. Panigrahi and S. Mallik, Sens. Actuators, B, 2011, 155, 8–18 CrossRef CAS.
- H. Tai, Y. Zhen, C. Liu, Z. Ye, G. Xie, X. Du and Y. Jiang, Sens. Actuators, B, 2016, 230, 501–509 CrossRef CAS.
- J. Devkota, K.-J. Kim, P. R. Ohodnicki, J. T. Culp, D. W. Greve and J. W. Lekse, Nanoscale, 2018, 10, 8075–8087 RSC.
- A. H. Khoshaman and B. Bahreyni, Sens. Actuators, B, 2012, 162, 114–119 CrossRef CAS.
- H.-L. Lu, C.-J. Lu, W.-C. Tian and H.-J. Sheen, Talanta, 2015, 131, 467–474 CrossRef CAS PubMed.
- C.-C. Chang, S. Lin, Y. Chu-Su and C.-W. Lin, Sens. Lett., 2011, 9, 404–408 CrossRef CAS.
- K. N. Chappanda, O. Shekhah, O. Yassine, S. P. Patole, M. Eddaoudi and K. N. Salama, Sens. Actuators, B, 2018, 257, 609–619 CrossRef CAS.
- E. S. Muckley, L. Collins, A. V. Ievlev, X. Ye, K. Kisslinger, B. G. Sumpter, N. V. Lavrik, C.-Y. Nam and I. N. Ivanov, ACS Appl. Mater. Interfaces, 2018, 10, 31745–31754 CrossRef CAS PubMed.
- C.-C. Wang, P.-Y. Lin, C.-J. Lu and M.-H. Liu, Instrum. Sci. Technol., 2017, 45, 639–649 CrossRef CAS.
- A. H. Khoshaman, P. C. H. Li, N. Merbouh and B. Bahreyni, Sens. Actuators, B, 2012, 161, 954–960 CrossRef CAS.
- P. Sun, Y. Jiang, G. Xie, J. Yu, X. Du and J. Hu, J. Appl. Polym. Sci., 2010, 116, 562–567 CrossRef CAS.
- A. Kösemen, S. Öztürk, Z. Şen, Z. A. Kösemen, M. Harbeck and Z. Ziya Öztürk, J. Electrochem. Soc., 2017, 164, B657–B664 CrossRef.
- A. Kumar, J. Brunet, C. Varenne, A. Ndiaye and A. Pauly, Procedia Eng., 2015, 120, 594–597 CrossRef CAS.
- A. Bearzotti, A. Macagnano, P. Papa, I. Venditti and E. Zampetti, Sens. Actuators, B, 2017, 240, 1160–1164 CrossRef CAS.
- M. Matsuguchi and A. Tada, Sens. Actuators, B, 2017, 251, 821–827 CrossRef CAS.
- M. Boutamine, A. Bellel, S. Sahli, Y. Segui and P. Raynaud, Thin Solid Films, 2014, 552, 196–203 CrossRef CAS.
- J. Benito, S. Sorribas, I. Lucas, J. Coronas and I. Gascon, ACS Appl. Mater. Interfaces, 2016, 8, 16486–16492 CrossRef CAS PubMed.
- M. A. Andrés, M. Benzaqui, C. Serre, N. Steunou and I. Gascón, J. Colloid Interface Sci., 2018, 519, 88–96 CrossRef PubMed.
- M. Eddaoudi, J. Kim, N. Rosi, D. Vodak, J. Wachter, M. O'Keeffe and O. M. Yaghi, Science, 2002, 295, 469 CrossRef CAS PubMed.
- Z. Y. Yeo, S.-P. Chai, P. W. Zhu and A. R. Mohamed, RSC Adv., 2014, 4, 54322–54334 RSC.
- J. Caro, in Zeolites and Zeolite-Like Materials, 2016, pp. 283–307 Search PubMed.
- A. M. Rasero-Almansa, A. Corma, M. Iglesias and F. Sánchez, ChemCatChem, 2014, 6, 1794–1800 CrossRef CAS.
- S. Cui, M. Qin, A. Marandi, V. Steggles, S. Wang, X. Feng, F. Nouar and C. Serre, Sci. Rep., 2018, 8, 15284 CrossRef PubMed.
- L. Paseta, G. Potier, S. Abbott and J. Coronas, Org. Biomol. Chem., 2015, 13, 1724–1731 RSC.
- P. Kumar, A. Pournara, K. H. Kim, V. Bansal, S. Rapti and M. J. Manos, Prog. Mater. Sci., 2017, 86, 25–74 CrossRef CAS.
- P. Horcajada, T. Chalati, C. Serre, B. Gillet, C. Sebrie, T. Baati, J. F. Eubank, D. Heurtaux, P. Clayette, C. Kreuz, J.-S. Chang, Y. K. Hwang, V. Marsaud, P.-N. Bories, L. Cynober, S. Gil, G. Férey, P. Couvreur and R. Gref, Nat. Mater., 2010, 9, 172–178 CrossRef CAS PubMed.
- X. Deng, M. Hao and Z. Li, Curr. Org. Chem., 2018, 22, 1825–1835 CrossRef CAS.
- V. Stavila, A. A. Talin and M. D. Allendorf, Chem. Soc. Rev., 2014, 43, 5994–6010 RSC.
- M. Ghanbarian, S. Zeinali and A. Mostafavi, Sens. Actuators, B, 2018, 267, 381–391 CrossRef CAS.
- W. Vandezande, K. P. F. Janssen, F. Delport, R. Ameloot, D. E. De Vos, J. Lammertyn and M. B. J. Roeffaers, Anal. Chem., 2017, 89, 4480–4487 CrossRef CAS PubMed.
- F. Y. Yi, D. Chen, M. K. Wu, L. Han and H. L. Jiang, ChemPlusChem, 2016, 81, 1–17 CrossRef.
- H. Yamagiwa, S. Sato, T. Fukawa, T. Ikehara, R. Maeda, T. Mihara and M. Kimura, Sci. Rep, 2014, 4, 6247 CrossRef CAS PubMed.
- O. Yassine, O. Shekhah, A. H. Assen, Y. Belmabkhout, K. N. Salama and M. Eddaoudi, Angew. Chem., Int. Ed., 2016, 55, 15879–15883 CrossRef CAS.
- R. Xu, Y. Wang, X. Duan, K. Lu, D. Micheroni, A. Hu and W. Lin, J. Am. Chem. Soc., 2016, 138, 2158–2161 CrossRef CAS PubMed.
- C. Sapsanis, H. Omran, V. Chernikova, O. Shekhah, Y. Belmabkhout, U. Buttner, M. Eddaoudi and K. Salama, Sensors, 2015, 15, 18153–18166 CrossRef CAS PubMed.
- C. Férey, C. Mellot-Draznieks, C. Serre, F. Millange, J. Dutour, S. Surblé and I. Margiolaki, Science, 2005, 309, 2040–2042 CrossRef PubMed.
- C.-Y. Huang, M. Song, Z.-Y. Gu, H.-F. Wang and X.-P. Yan, Environ. Sci. Technol., 2011, 45, 4490–4496 CrossRef CAS PubMed.
- S. M. Mirsoleimani-Azizi, P. Setoodeh, F. Samimi, J. Shadmehr, N. Hamedi and M. R. Rahimpour, J. Environ. Chem. Eng., 2018, 6, 4653–4664 CrossRef CAS.
- Z. Ihdene, A. Mekki, B. Mettai, R. Mahmoud, B. Hamada and M. M. Chehimi, Sens. Actuators, B, 2014, 203, 647–654 CrossRef CAS.
- Z. Zhang, S. Huang, S. Xian, H. Xi and Z. Li, Energy Fuels, 2011, 25, 835–842 CrossRef CAS.
- S. Kayal, B. Sun and A. Chakraborty, Energy, 2015, 91, 772–781 CrossRef CAS.
- Y.-Y. Liu, J.-L. Zeng, J. Zhang, F. Xu and L.-X. Sun, Int. J. Hydrogen Energy, 2007, 32, 4005–4010 CrossRef CAS.
- Q. Liu, L. Ning, S. Zheng, M. Tao, Y. Shi and Y. He, Sci. Rep., 2013, 3, 2916 CrossRef PubMed.
- R. Das, R. Bandyopadhyay and P. Pramanik, RSC Adv., 2015, 5, 59533–59540 RSC.
- F. Temel and M. Tabakci, Talanta, 2016, 153, 221–227 CrossRef CAS.
- L. Xu, X. Hu, Y. Tze Lim and V. Subramanian, Thin Solid Films, 2002, 417, 90–94 CrossRef CAS.
Footnote |
| † Electronic supplementary information (ESI) available: The real-time response of sensor to other analytes in different concentrations (Fig. S1–S7); response/recovery curves for other analytes (Fig. S8–S14). Calibration curves for other VOC vapors (Fig. S15–S21). See DOI: 10.1039/c9ra04152d |
| This journal is © The Royal Society of Chemistry 2019 |

