 Open Access Article
Optimisation of compatibility for improving elongation at break of chitosan/starch films
Kai-qiang Sunab,
Fang-yi Li *ab,
Jian-yong Li*ab,
Jian-feng Liab,
Chuan-wei Zhangab,
Shuai Chenab,
Xu Sunab and
Jin-feng Cuiab
aKey Laboratory of High Efficiency and Clean Mechanical Manufacture, Ministry of Education, School of Mechanical Engineering, Shandong University, Jinan 250061, China. E-mail: lifangyi@sdu.edu.cn
bNational Demonstration Center for Experimental Mechanical Engineering Education, Shandong University, Jinan 250061, China
First published on 7th August 2019
Abstract
When chitosan/starch films were used as agricultural mulch films, the problem of rupture often occurred. In order to improve the elongation at break, chitosan/starch blend films were prepared by casting with different formulations (different ratios of chitosan to starch, different plasticizing components and different plasticizer ratios) in this research. The elongation at break of the film reached up to 104.1% when chitosan was plasticized with 10% glycerol and 0.94% ethylene glycol alone and then mixed according to a 1![[thin space (1/6-em)]](https://www.rsc.org/images/entities/char_2009.gif) :
:![[thin space (1/6-em)]](https://www.rsc.org/images/entities/char_2009.gif) 0.6 chitosan–starch ratio. The fact that plasticizing starch, plasticizing chitosan or co-plasticizing starch and chitosan made a big difference to the mechanical properties of the films was discovered for the first time. The films with different plasticizing components were characterized by their mechanical properties, crystal structures and surface morphologies. Mechanical properties of the films were related to their crystallinity. The higher the crystallinity, the higher the elongation at break. Plasticizing starch alone facilitated the formation of hydrogen bonds and massive structures. Plasticizing chitosan alone was beneficial to the formation of network structures of the films and exhibited anti-plasticization at low plasticizer concentration.
0.6 chitosan–starch ratio. The fact that plasticizing starch, plasticizing chitosan or co-plasticizing starch and chitosan made a big difference to the mechanical properties of the films was discovered for the first time. The films with different plasticizing components were characterized by their mechanical properties, crystal structures and surface morphologies. Mechanical properties of the films were related to their crystallinity. The higher the crystallinity, the higher the elongation at break. Plasticizing starch alone facilitated the formation of hydrogen bonds and massive structures. Plasticizing chitosan alone was beneficial to the formation of network structures of the films and exhibited anti-plasticization at low plasticizer concentration.
1. Introduction
Plastic waste poses a serious threat to the environment and human health.1 Finding fully degradable natural polymer materials to replace plastics is currently a hot topic.2 Agricultural mulch films are widely used in crop protection, as they can retain heat and moisture, improve the utilisation of solar energy, and protect plant roots. Most of these films remain in the form of debris in the soil, thereby causing heavy metal contamination of the soil and impeding soil permeability.3 Therefore, the development and utilization of degradable films has become a trend. Among the existing degradable materials, natural biopolymers (i.e. starch) have huge advantages compared to synthetic biodegradable polymers as they are renewable, widely available, degradable and are fully compostable and free of toxic residues.4However, starch films are limited in application due to their poor mechanical properties and poor water resistance.5,6 To overcome these shortcomings, researchers have studied a number of methods, including: (1) physical modification: ultrasonic treatment of starch films to increase its elongation at break.7 (2) Chemical modification: plastic modification,8,9 cross-linking modification,10,11 etc. to improve mechanical properties; (3) blending modification: mixing sugar palm nanocrystalline cellulose12–14 to improve the waterproofness and degradability,15,16 adding chitosan17–19 to improve the mechanical properties and waterproofness. Among all the improvements, chitosan has good antibacterial properties20 and biocompatibility.21,22 The prepared chitosan/starch films as agricultural mulch films can serve as fertilisers to nourish crops after full degradation and keep seeds away from harmful bacteria. Therefore, it is a good choice to replace agricultural plastic films. However, when the chitosan/starch films are used as an agricultural mulch film, the problem of film rupture often occurred. Hence, the elongation at break of such films must be increased. The mechanical properties of chitosan and starch at different ratios and with concentration gradients of 0.5 were compared in the study by Xu et al. The results showed that the tensile strength and elongation of the films increase first and then decrease as starch content increases. The maximum elongation at break of the film can reach 60%.23 Therefore, by changing the ratio of chitosan to starch, the elongation at break of the films can be increased. However, the exact ratio of chitosan to starch at the highest elongation at break has not been explored. In addition, it has been widely proved that plasticizing modification can improve the mechanical properties of the films.9,10,24,25 The results of Natta laohakunjit et al. showed that glycerol, sorbitol and ethylene glycol had different effects on the mechanical properties of starch films when used as plasticizers.9 It was found that glycerol molecules were probably bound to the acetamide group of chitosan by H-bonds, which prevents the acetamide groups from forming interchain H-bonds with other chitosan molecules, and leads to breakdown of the intermolecular connectivity between the polysaccharide chains, seen in Attila Domjan's research. It also showed that no stable connection was found between the PEG 400 molecules and the polysaccharide chains, but the H-bonds formed by the amide groups were reduced.26 The above studies found that glycerin and polyethylene glycol were both good plasticizer for chitosan and starch. So these two reagents were chosen as plasticizers in this research. H. H. Liu et al. used glycerine as a plasticizer to improve the mechanical properties of chitosan/starch films. The research showed that adding 5% and higher concentrations of glycerine leads to a decrease in tensile strength and an increase in elongation at break.24 It was found that different concentrations of glycerol changed the elongation at break of the chitosan/starch films by affecting the formation of hydrogen bonds between chitosan and starch in Cholwasa Bangyekan's research.25 The results of Natta lahakunjit et al. showed that different plasticizers changed the solid crystallinity of the chitosan/starch films, which in turn affects the properties of the films.27 Tuhin et al. used glycerine and mustard oil as plasticizer. The research showed that the elongation at break of the films exerts different effects depending on the proportion of plasticizer.28 The above studies showed that different concentrations of plasticizers had a greater impact on the elongation at break of the chitosan/starch films.
In summary, increasing the elongation at break of films requires changing the ratio of chitosan to starch and the ratio of plasticizers. In addition to the two methods, the current study also showed that plasticisation of different components also affected the mechanical properties of films. In this study, the elongation at break of films under different ratios of chitosan and starch was compared by controlled variable method. The ratio of glycerol to ethylene glycol at the time of maximum elongation at break of the films was obtained by uniform experiment and calculation analysis. Finally, the optimal compatibility of the films was determined when the elongation at break of the films reached its peak. And the problem of insufficient elongation at break when chitosan/starch films were used as agricultural films was solved. The above studies showed that the mechanical properties of the chitosan/starch films had a great relationship with the hydrogen bond strength, crystallinity and the internal structure of the films. Therefore, in order to explain the different effects of plasticizing different components on the mechanical properties of the films, Fourier transform infrared (FTIR), spectroscopy and X-ray diffraction (XRD), and scanning electron microscopy (SEM) methods were used to characterize hydrogen bond strength, crystallinity, and internal structure of the films whose different components were plasticized.
2. Experimental
2.1. Experimental instruments and materials
Chitosan (95.0% deacetylation degree) with molecular weight of about 106 was purchased from Shandong Dongrun Biotechnology Co., Ltd. (Shandong, China). Corn starch of reagent grade and with an average particle diameter of 30 μm was purchased from Hebei Huachen Starch Sugar Co., Ltd. (Hebei, China). The general specifications are as follows: 12.5–13.0% moisture content, 0.20% ash, 0.20% pulp, pH value of 5–7. Glycerol (99.0% purity) and glycol (99.0% purity) as plasticizing agents were purchased from Tianjin Fuyu Fine Chemical Co., Ltd. (Tianjin, China). Urea of AR grade and with purity ≥99.0% was purchased from Tianjin Zhiyuan Chemical Reagent Co., Ltd. (Tianjin, China). Sodium hydroxide (NaOH) powder with purity ≥96.0% was purchased from Cangzhou Manyue Chemical Sales Co., Ltd. (Hebei, China).HHS-2 electronic water bath with constant temperature was bought from Shanghai Kanglu Instrument Equipment Co., Ltd. JJ-1 precision booster was sourced from Cangzhou Boyuan Experimental Analytical Instrument Factory. Electronic balance (2000 g/0.01 g) was purchased from Shanghai Huachao Electric Co., Ltd. Electric thermostat blast drying oven was bought from Shanghai Jinghong Experimental Equipment Co., Ltd. The infrared spectrometer, BRUKER VERTEX-70, was obtained from Bruker, Germany. XLW (L)-PC intelligent electronic tension machine was sourced from Jinan Blu-ray Electromechanical Technology Co., Ltd. The scanning electron microscope (model FEG250) was purchased from Beijing Oubo Tong Optical Technology Co., Ltd. YS20B nickel–copper filter radiator was procured from Taizhou Yishun Valve Co., Ltd.
2.2. Film preparation
![[thin space (1/6-em)]](https://www.rsc.org/images/entities/char_2009.gif) :
:![[thin space (1/6-em)]](https://www.rsc.org/images/entities/char_2009.gif) chitosan = 1
chitosan = 1![[thin space (1/6-em)]](https://www.rsc.org/images/entities/char_2009.gif) :
:![[thin space (1/6-em)]](https://www.rsc.org/images/entities/char_2009.gif) 0, 1
0, 1![[thin space (1/6-em)]](https://www.rsc.org/images/entities/char_2009.gif) :
:![[thin space (1/6-em)]](https://www.rsc.org/images/entities/char_2009.gif) 0.5, 1
0.5, 1![[thin space (1/6-em)]](https://www.rsc.org/images/entities/char_2009.gif) :
:![[thin space (1/6-em)]](https://www.rsc.org/images/entities/char_2009.gif) 1, 1
1, 1![[thin space (1/6-em)]](https://www.rsc.org/images/entities/char_2009.gif) :
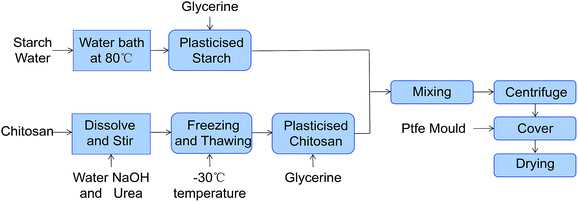
:![[thin space (1/6-em)]](https://www.rsc.org/images/entities/char_2009.gif) 1.5. And then we stirred them for 60 min with a magnetic stirrer to get the mixed slurry. Bubbles were removed through centrifugation. The mixed slurry was spread on a Teflon plastic sheet and was then placed in the dryer. The temperature of the dryer was kept at 80 °C. After drying for 3 h, the films were peeled off from the Teflon plastic mould. Then we carried out the mechanical test of the films according to the method of 2.2. The experimental results are shown in Fig. 1. The elongation at break (E) of the films increased first and then decreased as starch content increased. Thus, the ratio of chitosan to starch when the films had the highest E should be between 1
1.5. And then we stirred them for 60 min with a magnetic stirrer to get the mixed slurry. Bubbles were removed through centrifugation. The mixed slurry was spread on a Teflon plastic sheet and was then placed in the dryer. The temperature of the dryer was kept at 80 °C. After drying for 3 h, the films were peeled off from the Teflon plastic mould. Then we carried out the mechanical test of the films according to the method of 2.2. The experimental results are shown in Fig. 1. The elongation at break (E) of the films increased first and then decreased as starch content increased. Thus, the ratio of chitosan to starch when the films had the highest E should be between 1![[thin space (1/6-em)]](https://www.rsc.org/images/entities/char_2009.gif) :
:![[thin space (1/6-em)]](https://www.rsc.org/images/entities/char_2009.gif) 0–1
0–1![[thin space (1/6-em)]](https://www.rsc.org/images/entities/char_2009.gif) :
:![[thin space (1/6-em)]](https://www.rsc.org/images/entities/char_2009.gif) 1.
1.
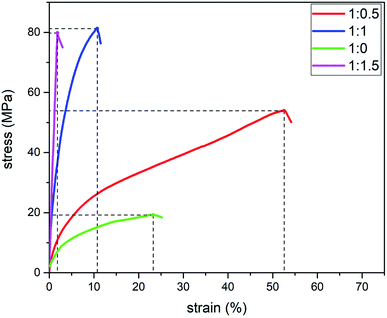 | ||
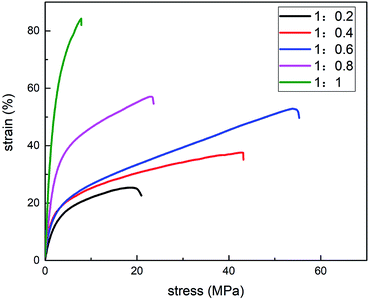
| Fig. 1 Stress–strain (d–3) curves of different starch–chitosan films with various proportions in the pilot experiment. | ||
Therefore, the concentration gradient was set to 0.2. We mixed the chitosan solution and the gelatinised starch according to the ratio of starch![[thin space (1/6-em)]](https://www.rsc.org/images/entities/char_2009.gif) :
:![[thin space (1/6-em)]](https://www.rsc.org/images/entities/char_2009.gif) chitosan = 1
chitosan = 1![[thin space (1/6-em)]](https://www.rsc.org/images/entities/char_2009.gif) :
:![[thin space (1/6-em)]](https://www.rsc.org/images/entities/char_2009.gif) 0.2, 1
0.2, 1![[thin space (1/6-em)]](https://www.rsc.org/images/entities/char_2009.gif) :
:![[thin space (1/6-em)]](https://www.rsc.org/images/entities/char_2009.gif) 0.4, 1
0.4, 1![[thin space (1/6-em)]](https://www.rsc.org/images/entities/char_2009.gif) :
:![[thin space (1/6-em)]](https://www.rsc.org/images/entities/char_2009.gif) 0.6, 1
0.6, 1![[thin space (1/6-em)]](https://www.rsc.org/images/entities/char_2009.gif) :
:![[thin space (1/6-em)]](https://www.rsc.org/images/entities/char_2009.gif) 0.8 and 1
0.8 and 1![[thin space (1/6-em)]](https://www.rsc.org/images/entities/char_2009.gif) :
:![[thin space (1/6-em)]](https://www.rsc.org/images/entities/char_2009.gif) 1. Repeat the above process of preparing the films.
1. Repeat the above process of preparing the films.
| 1 | 2 | 3 | 4 | 5 | 6 | |
|---|---|---|---|---|---|---|
| Glycerine (g) | 0 | 2.5 | 5 | 7.5 | 10 | 12.5 |
| Glycol (g) | 5 | 12.5 | 2.5 | 10 | 0 | 7.5 |
2.3. Film tensile test
The obtained films were subjected to a standard pattern in accordance with the ASTM Standard Method D 882-91 (1995a). It was then subjected to a tensile test using an XLW (L)-PC type intelligent electronic tensile machine to measure the mechanical properties of tensile strength (TS) and elongation at break (E). The initial jig separation was set to 50 mm, and the crosshead speed was set to 100 mm min−1. TS was expressed in MPa and was calculated by dividing the maximum load (N) by the initial cross-sectional area (m2) of the sample. The E was calculated as the ratio of the final length of the sample break point to the initial length of the sample and was expressed as a percentage. Test each type of the films five times. The stress–strain curve of the sample was obtained by calculating and analysing the TS.2.4. Microscopic testing of the film
2.5. Optimised film performance test
We prepared the optimised film according to the results obtained in 2.2 and tested them for water vapor transmission rate and tensile test. The tensile test method is shown in 2.3. The water vapor transmission rate test method is as follows.The water vapour transmission rate (g m−2 h−1) was determined gravimetrically using the ASTM method E 96-95 (1995b).23 The film sample was mounted on a polymethylmethacrylate cup containing 16 mL of distilled water. The cup was placed in an environmental chamber at 25 °C and relative humidity of 50%. The infiltrates were removed at a speed of about 200 m min−1 using a fan in the chamber. The weight of the beaker was recorded every 4 h for a total of 48 h. The water vapour transmission rate of the film in different time periods was calculated. Five films were taken for testing and averaging.
3. Results and discussion
3.1. Analysis of the effects of chitosan/starch ratio on the mechanical properties of films
The results are shown in Fig. 3. Given the chitosan–starch ratio ranging from 1![[thin space (1/6-em)]](https://www.rsc.org/images/entities/char_2009.gif) :
:![[thin space (1/6-em)]](https://www.rsc.org/images/entities/char_2009.gif) 0.1 to 1
0.1 to 1![[thin space (1/6-em)]](https://www.rsc.org/images/entities/char_2009.gif) :
:![[thin space (1/6-em)]](https://www.rsc.org/images/entities/char_2009.gif) 1, the TS gradually increased. In addition, the breaking elongation first increased and then decreased as starch content increased. The comparison between the stress and strain curves showed that the elongation reached 53.9% when the chitosan–starch ratio was 1
1, the TS gradually increased. In addition, the breaking elongation first increased and then decreased as starch content increased. The comparison between the stress and strain curves showed that the elongation reached 53.9% when the chitosan–starch ratio was 1![[thin space (1/6-em)]](https://www.rsc.org/images/entities/char_2009.gif) :
:![[thin space (1/6-em)]](https://www.rsc.org/images/entities/char_2009.gif) 0.6 and that the TS reached 52.9 MPa. Under this ratio, the films had the highest E and good TS.
0.6 and that the TS reached 52.9 MPa. Under this ratio, the films had the highest E and good TS.
3.2. Effects of single/integral composition modification on mechanical properties of films
| Different plasticizing methods | NC + NS | TPC + NS | TPS + NC | TPC + TPS |
|---|---|---|---|---|
| Tensile strength (MPa) | 53.9 | 47.7 | 93.4 | 80.4 |
| Elongation at break (%) | 52.6 | 76.3 | 29.1 | 58.3 |
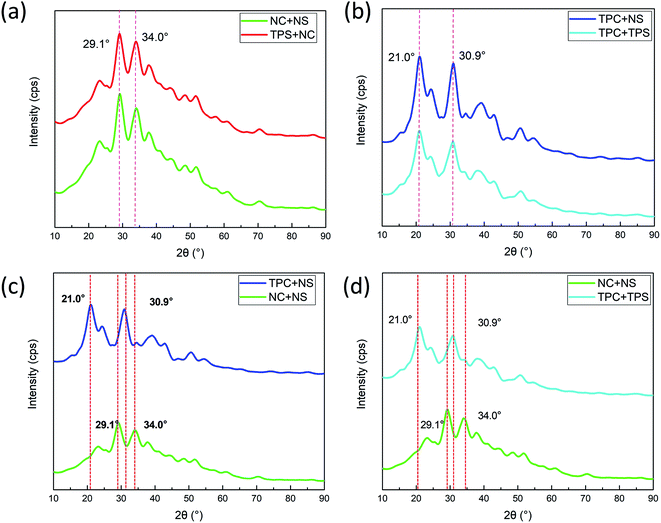
| FTIR peak frequency (cm−1) | 3302 | 3338 | 3257 | 3263 |
| 1406 | 1421 | 1392 | 1400 | |
| XRD 2θ (°) | 29.14 | 29.10 | 20.96 | 21.04 |
| 34.04 | 33.98 | 30.98 | 31.02 |
3.3. Analysis of the effects of plasticizer ratio on the mechanical properties of films
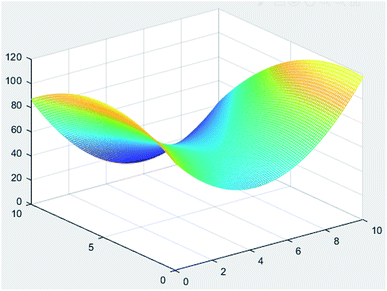
The results are shown in Table 3. The E of the film peaked at 78.6% when the glycerine concentration reached 10% and no ethylene glycol was applied. Further regression analysis of the films by MINTAB software showed that the regression equation model of E with glycerol and ethylene glycol is the formula (1).| Y = 89.29 − 17.78X1 + 9.065X2 + 20.64X12 − 0.931X22 − 0.7307X1X2 | (1) |
| Glycerine (%) | 0 | 2.5 | 5 | 7.5 | 10 | 12.5 |
| Glycol (%) | 5 | 12.5 | 2.5 | 10 | 0 | 7.5 |
| Elongation at break (%) | 57 | 70 | 12.9 | 72 | 78.6 | 43 |
MATLAB was used to analyse the regression equation, and the resulting 3D contour map is shown in Fig. 8. The concentration of glycerol and ethylene glycol was set in the range of 0–10%. (The study of M. J. Halimatul found that TS and E of the films would significantly decrease with the increase of plasticizer content when the plasticizer was above 10%.39 So the concentration range was set within 10%.) The E of the film reached the maximum when the glycerol was 10 g and the ethylene glycol was 0.94 g. Model prediction results showed that the E of the film at this time reached 118.7%.
3.4. Analysis of variance test
Analysis of variance was conducted on all mechanical test data by SPSS software. The results of the analysis are shown in Table 4. The P values were all less than 0.05, the influence of different chitosan and starch ratios, different plasticizing components and different plasticizer ratios these three factors on the film E was very significant. And the interaction of the three factors mutual interaction of the three factors had a significant effect on the E of the films. Therefore, in this paper, it was reasonable to combine the three methods to improve the elongation at break of the film.| Source | Class III square sum | Degree of freedom | Mean square | F | P |
|---|---|---|---|---|---|
| Modified model | 46![[thin space (1/6-em)]](https://www.rsc.org/images/entities/char_2009.gif) 496.704 496.704 |
12 | 3874.725 | 4278.468 | 0.000 |
| Intercept | 47![[thin space (1/6-em)]](https://www.rsc.org/images/entities/char_2009.gif) 241.669 241.669 |
1 | 47![[thin space (1/6-em)]](https://www.rsc.org/images/entities/char_2009.gif) 241.669 241.669 |
52![[thin space (1/6-em)]](https://www.rsc.org/images/entities/char_2009.gif) 164.204 164.204 |
0.000 |
| Ratio of chitosan to starch (A) | 15![[thin space (1/6-em)]](https://www.rsc.org/images/entities/char_2009.gif) 449.589 449.589 |
3 | 5149.863 | 5686.474 | 0.000 |
| Plasticizing different components (B) | 19![[thin space (1/6-em)]](https://www.rsc.org/images/entities/char_2009.gif) 545.190 545.190 |
2 | 9772.595 | 10![[thin space (1/6-em)]](https://www.rsc.org/images/entities/char_2009.gif) 790.890 790.890 |
0.000 |
| Plasticizer ratio (C) | 19![[thin space (1/6-em)]](https://www.rsc.org/images/entities/char_2009.gif) 960.665 960.665 |
2 | 9980.332 | 11![[thin space (1/6-em)]](https://www.rsc.org/images/entities/char_2009.gif) 020.273 020.273 |
0.000 |
| A × B | 4017.218 | 1 | 4017.218 | 4435.809 | 0.000 |
| A × C | 13.759 | 1 | 13.759 | 15.193 | 0.000 |
| B × C | 1554.261 | 1 | 1554.261 | 1716.213 | 0.000 |
| A × B × C | 187.749 | 1 | 187.749 | 207.312 | 0.000 |
| Error | 47.093 | 52 | 0.906 | ||
| Total | 143![[thin space (1/6-em)]](https://www.rsc.org/images/entities/char_2009.gif) 121.185 121.185 |
65 | |||
| Total after correction | 46![[thin space (1/6-em)]](https://www.rsc.org/images/entities/char_2009.gif) 543.797 543.797 |
64 |
3.5. Performance testing
The tensile test result of the film is shown in Fig. 9(a). At this time, the E of the film reached 104.1%, and the TS was 56.18 MPa. Compared with previous studies, elongation at break was much improved.23,24 Thus, the film had a high E. It also maintained a certain strength, and the mechanical properties of the film were satisfactory. The experimental test on the water vapour transmission rate of the film is presented in Fig. 9(b). The experimental results showed that the water vapour transmission rate was stable at about 20 g m−2 h−1. The water vapour transmittance of the film was significantly lower than that of the films studied by Xu et al.23 Fig. 9(c) shows that the light transmittance of the film was good. These performance results meet the requirements of agricultural films.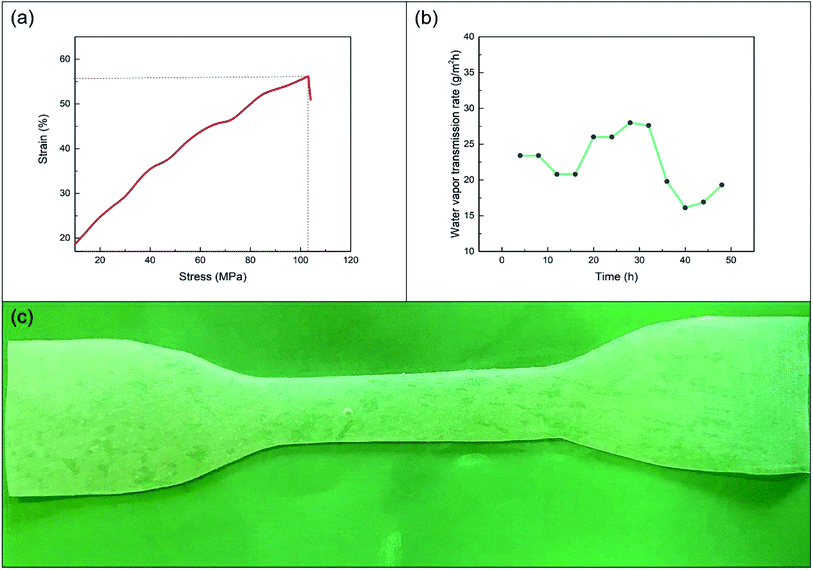 | ||
| Fig. 9 Test results of (a) mechanical properties, (b) water vapour permeability and (c) film pictures. | ||
4. Conclusions
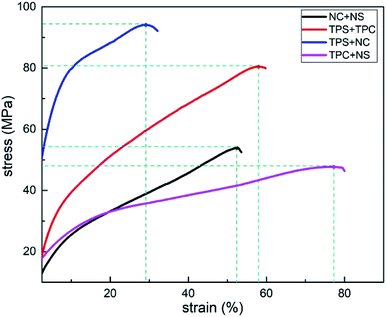
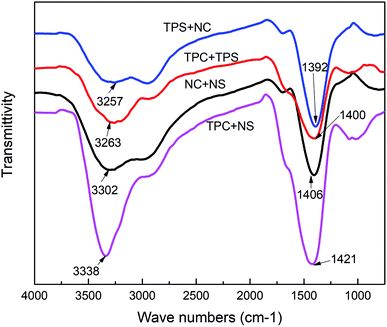
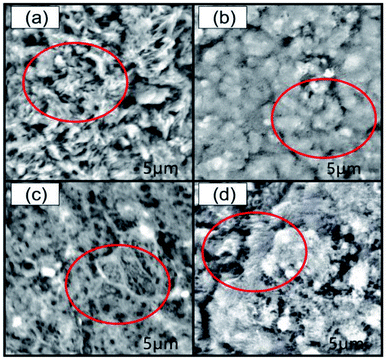
Among plasticizing films of different compositions, TPC + NS had the largest elongation at break and TPS + NC had the largest tensile strength. The results of XRD showed that mechanical properties of films were related to its crystallinity. The higher the crystallinity, the higher the elongation at break. Plasticizing starch alone facilitated the formation of hydrogen bonds and massive structure, supported by the results of FTIR and SEM respectively. Plasticizing chitosan alone was beneficial to the formation of network structure and exhibited anti-plasticization at low plasticizer concentration, supported by the results of SEM and FTIR respectively. The film prepared by mixing chitosan plasticized with 10% glycerol and 0.94% ethylene glycol alone to starch at a ratio of 1![[thin space (1/6-em)]](https://www.rsc.org/images/entities/char_2009.gif) :
:![[thin space (1/6-em)]](https://www.rsc.org/images/entities/char_2009.gif) 0.6, had the highest elongation at break of up to 104.1%, with good tensile strength, water vapour barrier properties and light transmission. Such discovery can effectively solve the problem that chitosan/starch films often break, which is beneficial to its use as agricultural mulching films.
0.6, had the highest elongation at break of up to 104.1%, with good tensile strength, water vapour barrier properties and light transmission. Such discovery can effectively solve the problem that chitosan/starch films often break, which is beneficial to its use as agricultural mulching films.
Conflicts of interest
There are no conflicts to declare.Acknowledgements
This work was financially supported by National Natural Science Foundation of China (No. 51775318), National Natural Science Foundation of China (No. 51375278), and The Interdisciplinary Cultivation Project of Shandong University (No. 2018JC043). We would like to thank our colleagues from Shandong University.References
- J. R. Jambeck, R. Geyer and C. Wilcox, et al., Plastic waste inputs from land into the ocean, Science, 2015, 347(6223), 768–771 CrossRef CAS PubMed.
- W. D. Luzier, Materials Derived from Biomass/Biodegradable Materials, Proc. Natl. Acad. Sci. U. S. A., 1992, 89(3), 839–842 CrossRef CAS PubMed.
- T. W. Brooks, Apparatus for recycling previously used agricultural plastic film much, J. Cleaner Prod., 1997, 5(4), 318 Search PubMed.
- R. A. Ilyas, S. M. Sapuan and M. R. Ishak, et al., Development and characterization of sugar palm nanocrystalline cellulose reinforced sugar palm starch bionanocomposites, Carbohydr. Polym., 2018, 202, 186–202 CrossRef CAS PubMed.
- F. H. Otey and R. P. Westhoff, Starch-based films. Preliminary diffusion evaluation, Ind. Eng. Chem. Prod. Res. Dev., 2002, 23(2), 284–287 CrossRef.
- L. Ren, X. Yan and J. Zhou, et al., Influence of chitosan concentration on mechanical and barrier properties of corn starch/chitosan films, Int. J. Biol. Macromol., 2017, 105(3), 1636–1643 CrossRef CAS PubMed.
- H. Abral, A. Basri and F. Muhammad, et al., A simple method for improving the properties of the sago starch films prepared by using ultrasonication treatment, Food Hydrocolloids, 2019, 93, 276–283 CrossRef CAS.
- S. Mali, L. S. Sakanaka and F. Yamashita, et al., Water sorption and mechanical properties of cassava starch films and their relation to plasticizing effect, Carbohydr. Polym., 2005, 60(3), 283–289 CrossRef CAS.
- N. Laohakunjit and A. Noomhorm, Effect of Plasticizers on Mechanical and Barrier Properties of Rice Starch Film, Starch, 2004, 56(8), 348–356 CrossRef CAS.
- Q. Chen, H. J. Yu and L. Wang, et al., Recent progress in chemical modification of starch and its applications, RSC Adv., 2015, 5(83), 67459–67474 RSC.
- N. Reddy and Y. Yang, Citric acid cross-linking of starch films, Food Chem., 2015, 118(3), 702–711 CrossRef.
- R. A. Ilyas, S. M. Sapuan and M. R. Ishak, et al., Isolation and characterization of nanocrystalline cellulose from sugar palm fibres (Arenga pinnata), Carbohydr. Polym., 2017, 181, 1038 CrossRef PubMed.
- R. A. Ilyas, S. M. Sapuan and M. R. Ishak, et al., Sugar palm (Arenga pinnata (Wurmb.) Merr) cellulosic fifibre hierarchy: a comprehensive approach from macro to nano scale, J. Mater. Res. Technol., 2019, 8(3), 2753–2766 CrossRef CAS.
- R. A. Ilyasa, S. M. Sapuan and M. R. Ishakc, et al., Isolation and characterization of nanocrystalline cellulose from sugar palm fibres (Arenga pinnata), Carbohydr. Polym., 2018, 181, 1038–1051 CrossRef PubMed.
- R. A. Ilyas, S. M. Sapuan and M. R. Ishak, et al., Water Transport Properties of Bio-Nanocomposites Reinforced by Sugar Palm (Arenga pinnata) Nanofibrillated Cellulose, Journal of Advanced Research in Fluid Mechanics and Thermal Sciences, 2018, 51(2), 234–246 Search PubMed.
- R. A. Ilyas, S. M. Sapuan and M. R. Ishak, et al., Sugar palm nanocrystalline cellulose reinforced sugar palm starch composite: degradation and water-barrier properties, IOP Conf. Ser.: Mater. Sci. Eng., 2018, 368, 012006 Search PubMed.
- J. Bonilla, L. Atares and M. Vargas, et al., Properties of wheat starch film-forming dispersions and films as affected by chitosan addition, J. Food Eng., 2013, 114(3), 303–312 CrossRef CAS.
- S. Mathew, M. Brahmakumar and T. E. Abraham, Microstructural imaging and characterization of the mechanical, chemical, thermal, and swelling properties of starch-chitosan blend films, Biopolymers, 2006, 82, 176–187 CrossRef CAS PubMed.
- J. Bonilla, L. Atares, M. Vargas and A. Chiralt, Properties of wheat starch film-forming dispersions and films as affected by chitosan addition, Food Eng., 2013, 114, 303–312 CrossRef CAS.
- M. Kong, X. G. Chen and K. Xing, et al., Antimicrobial properties of chitosan and mode of action: a state of the art review, Int. J. Food Microbiol., 2010, 144(1), 51–63 CrossRef CAS PubMed.
- S. I. Park, M. A. Daeschel and Y. Zhao, Functional properties of antimicrobial lysozyme–chitosan composite films, J. Food Sci., 2004, 69(8), M215–M221 CrossRef CAS.
- C. Xiao, L. Zhu, W. Luo, X. Song and Y. Deng, Combined action of pure oxygen pretreatment and chitosan coating incorporated with rosemary extracts on the quality of fresh-cut pears, Food Chem., 2010, 121(4), 1003–1009 CrossRef CAS.
- X. Y. Xu, K. M. Kim and M. A. Hanna, et al., Chitosan–starch composite film: preparation and characterization, Ind. Crops Prod., 2005, 21(2), 185–192 CrossRef.
- H. H. Liu, R. Adhikari, Q. P. Guo and B. Adhikari, Preparation and characterization of glycerol plasticized (high-amylose) starch-chitosan films, Food Eng., 2013, 116, 588–597 CrossRef CAS.
- C. Bangyekan, D. Aht-Ong and K. Srikulkit, Preparation and properties evaluation of chitosan-coated cassava starch films, Carbohydr. Polym., 2006, 63(1), 61–71 CrossRef CAS.
- D. Attila, B. Janos and P. Klara, Understanding of the Plasticizing Effects of Glycerol and PEG 400 on Chitosan Films Using Solid-State NMR Spectroscopy, Macromolecules, 2009, 42(13), 4667–4673 CrossRef.
- M. F. Cervera, M. Karjalainen and S. Airaksinen, et al., Physical stability and moisture sorption of aqueous chitosan–amylose starch films plasticized with polyols, Eur. J. Pharm. Biopharm., 2004, 58(1), 76 CrossRef PubMed.
- M. O. Tuhin, N. Rahman and M. E. Haque, et al., Modification of mechanical and thermal property of chitosan–starch blend films, Radiat. Phys. Chem., 2012, 81(10), 1659–1668 CrossRef CAS.
- X. Hu, Y. Du and Y. Tang, et al., Solubility and property of chitin in NaOH/urea aqueous solution, Carbohydr. Polym., 2007, 70(4), 451–458 CrossRef CAS.
- B. Duan, B. Y. Liu and L. N. Zhang, et al., Intermolecular interaction and the extended wormlike chain conformation of chitin in NaOH/urea aqueous solution, Biomacromolecules, 2015, 1410–1417 Search PubMed.
- C. W. Zhang, F. Y. Li and J. F. Li, et al., A new biodegradable composite with open cell by combining modified starch and plant fibers, Mater. Des., 2017, 120, 222–229 CrossRef CAS.
- Y. Guan, X. Liu and Y. Zhang, et al., Study of phase behavior on chitosan/viscose rayon blend film, J. Appl. Polym. Sci., 1998, 67(12), 1965–1972 CrossRef CAS.
- G. C. Ritthidej, T. Phaechamud and T. Koizumi, Moist heat treatment on physicochemical change of chitosan salt films, Int. J. Pharm., 2002, 232(1), 11–22 CrossRef CAS PubMed.
- M. A. Garcia, A. Pinotti and N. E. Zaritzky, Physicochemical, Water Vapor Barrier and Mechanical Properties of Corn Starch and Chitosan Composite Films, Starch/Staerke, 2006, 58(9), 453–463 CrossRef CAS.
- S. W. Kuo, C. F. Huang and F. C. Chang, Study of hydrogen-bonding strength in poly(epsilon--caprolactone) blends by DSC and FTIR, J. Polym. Sci., Part B: Polym. Phys., 2001, 39(12), 1348–1359 CrossRef CAS.
- C. W. Zhang, F. Y. Li and J. F. Li, et al., Novel treatments for compatibility of plant fiber and starch by forming new hydrogen bonds, J. Cleaner Prod., 2018, 185, 357–365 CrossRef CAS.
- X. S. Wu, Effect of Glycerin and Starch Crosslinking on Molecular Compatibility of Biodegradable Poly (lactic acid)-Starch Composites, J. Polym. Environ., 2011, 19(4), 912–917 CrossRef CAS.
- R. A. Talja, H. Helen and Y. H. Roos, et al., Effect of various polyols and polyol contents on physical and mechanical properties of potato starch-based films, Carbohydr. Polym., 2007, 67(3), 288–295 CrossRef CAS.
- M. J. Halimatul, S. M. Sapuan and M. Jawaid, et al., Effect of sago starch and plasticizer content on the properties of thermoplastic films: mechanical testing and cyclic soaking-drying, Polimery, 2019, 64, 32–41 Search PubMed.
| This journal is © The Royal Society of Chemistry 2019 |

