 Open Access Article
A multifunctional SERS sticky note for real-time quorum sensing tracing and inactivation of bacterial biofilms†
Jingxing
Guo‡
,
Ying
Liu‡
,
Yunlong
Chen
,
Jianqi
Li
and
Huangxian
Ju
 *
*
State Key Laboratory of Analytical Chemistry for Life Science, School of Chemistry and Chemical Engineering, Nanjing University, Nanjing 210023, P. R. China. E-mail: hxju@nju.edu.cn
First published on 31st May 2018
Abstract
Quorum sensing (QS) is crucial for bacterial survival and activity. Although detecting related signaling metabolites can reveal QS, a versatile platform for convenient real-time imaging of their secretion in the context of bacterial biofilms along with inhibition to the growth of biofilms is still highly desired. Here we develop a flexible sticky note with a sandwich structure by encapsulating gold nanostars between two pieces of hexagonal boron nitride layers, which can be easily pasted on natural biofilms to monitor in real-time the secreted signaling molecule by SERS imaging with high sensitivity and spatiotemporal resolution. Using Pseudomonas aeruginosa and its pyocyanin secretion as a model and an internal standard for self-calibration of SERS signals, the sticky note achieves reliable quantification and a rapid response to the secretion as early as 1 h biofilm growth. With antibiotic loading, the multifunctional SERS sticky note also demonstrated effective inactivation of the bacterial biofilm with simultaneous evaluation of the inactivation effect. This multifunctional SERS sticky note provides a versatile platform for investigating bacterial behaviors and developing antibacterial therapeutics.
Introduction
Most bacterial populations in natural environments exist as biofilms, which are densely packed multicellular aggregates attached to various surfaces and responsible for several unique bacterial functions, such as intercellular signaling processes including quorum sensing (QS). QS has a great effect on bacterial physiological processes,1 which allows bacteria to monitor their local environment and population density by secreting and sensing extracellular signaling molecules, and ultimately regulates the gene expression2,3 and coordinates bacterial activities.4 Therefore, exploring QS in the context of biofilms is important to pathological research and various medical and industrial applications.Traditional techniques for studying QS in biofilms include the detection of isotope-labeled metabolites5 and bioluminescent or fluorescent proteins transcribed by reporter genes,6,7 which need tedious pretreatments like isotope labelling and genetic manipulation. Although direct detection of QS-related signaling molecules has been achieved with imaging mass spectrometry (IMS),8,9 scanning electrochemical microscopy (SECM)10 and integrated circuit (IC),11 these techniques require relatively complicated processes and skilled technicians. Due to the high sensitivity and specific molecule identification capability, surface-enhanced Raman spectroscopy (SERS) has emerged as a powerful analytical tool for various biological and chemical species.12–14 Recently, several gold nanoparticle-loaded platforms that use a gel layer to coat the metal substrate for bacterial growth have been proposed to image QS signaling molecules in biofilms by SERS.15,16 Whereas, other than the complicated fabrication process, the gel layer isolates the bacterial biofilms from SERS-active components, which to some extent impairs its capability of real-time profiling the spatial distribution of QS-related metabolite secretion. On the other hand, increasing requirements are raised up recently for multifunctional devices which not only detect bacterial species, but can also be used to inhibit its growth.17,18 Therefore, a universal SERS platform capable of real-time QS tracing and inhibition to the growth of bacterial biofilms with application convenience can fulfill the urgent research need.
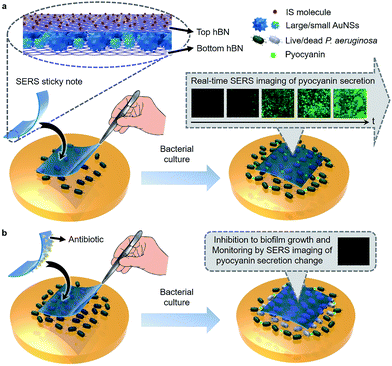
2D materials, such as graphene and hexagonal boron nitride (hBN), have received much attention recently in SERS. Used as the wrapping layers of metal substrates, they can help to improve SERS sensitivity by generating a strong electromagnetic field at the narrow gap of its surface,19 and uniform the localized surface plasmon resonance effect of metal nanoparticles to provide clean and reproducible SERS signals.19–22 In this work, we designed a multifunctional SERS sticky note by wrapping densely packed multi-sized gold nanostars (AuNSs) between two pieces of hBN (Scheme 1a) to achieve real-time QS tracing and inactivation of bacterial biofilms. Thanks to biocompatible and ultrathin hBN wrapping, the AuNSs could be located in the vicinity of the bacterial biofilm without direct contact, which resulted in a quick and high-quality SERS response to metabolites for long term tracing of QS in real time.19,22 By implanting 4-mercaptobenzoic acid (MBA) as an internal standard (IS) on the top hBN and contacting the bottom hBN with analytes, the sticky note was endowed with self-calibration ability for SERS quantification. Using Pseudomonas aeruginosa (wild type, ATCC9027) as a model, the SERS sticky note could conveniently attach on live biofilms for real-time SERS imaging and quantification of secreted pyocyanin, an indicator for QS.23–25 The hBN also provided abundant delocalized π bonds and therefore was capable of carrying antibiotics via van der Waals interactions for simultaneous inactivation of bacterial biofilms with in situ verification of the inactivation effect (Scheme 1b). The SERS sticky note is flexible and freestanding, which offers operation convenience and reusability and therefore has great potential in practical applications for QS monitoring in microbial communities and medicine efficacy assessment of antibacterial therapeutics.
Results and discussion
Design and preparation of the SERS sticky note
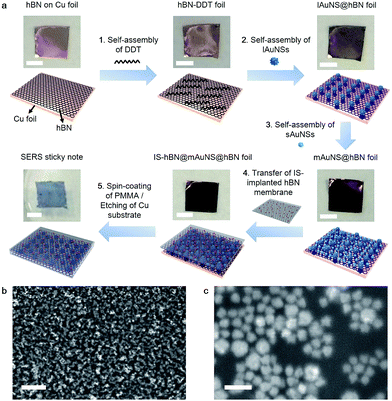
To enhance the response of the SERS substrate, AuNSs with two kinds of sizes were synthesized.26 The large AuNSs (lAuNSs) and small AuNSs (sAuNSs) possessed a core radius of 36.6 ± 2.5 nm and 25.1 ± 1.9 nm, respectively (Fig. S1a–d†). Their hydrodynamic diameters were 119.2 and 82.2 nm due to the presence of multibranches (Fig. S1e and f†), and their absorbance peaks at 794 and 752 nm showed significant optical transition at 785 nm (Fig. S2a†) which indicated a resonant charge excitation process and could lead to the strong SERS effect under 785 nm laser irradiation. They also showed low SERS signals themselves (Fig. S2b†), providing a high signal-to-background ratio for SERS measurements.Dodecanethiol (DDT) was first adsorbed on the bottom hBN surface to provide thiol–Au interactions for sequential self-assemblies of lAuNSs and sAuNSs (Fig. 1a), which obtained a highly uniform monolayer of multi-sized AuNSs on hBN (mAuNSs@hBN) (Fig. S3a†). The sequential self-assemblies led to filling of sAuNSs into the gaps of lAuNSs, which showed a higher surface Au content (wt%) (5.6%) compared with lAuNSs@hBN (2.9%) and sAuNSs@hBN (3.1%) (Fig. S3†), and resulted in a large number of surface hot spots for increased SERS sensitivity. The electromagnetic field distribution of the mAuNS monolayer, which was simulated via finite-difference time domain (FDTD) with a simplified model, also showed the maximum number of hot spots (Fig. S4†). An (|E|/|E0|)4 value of 9.3 × 10⁷ compared to 5.6 × 10⁷ for the lAuNS monolayer and 3.5 × 10⁷ for the sAuNS monolayer led to the highest SERS sensitivity since the Raman cross-section enhancement is proportional to |E|4.
After the IS molecule MBA was adsorbed on another piece of hBN foil, polymethyl methacrylate (PMMA) was spin-coated on the resulting IS@hBN foil, and the bottom Cu substrate was etched to obtain an IS-implanted hBN membrane, which was transferred onto the top of mAuNSs@hBN foil to form a sandwich-type IS-hBN@mAuNS@hBN foil. Afterward, PMMA was spin-coated on the top side of the foil for supporting the sticky note. The experiments indicated that the PMMA coating did not obviously affect the optical sensitivity. The bottom Cu substrate was finally etched to get the freestanding 2D SERS sticky note with a size of 5 mm × 5 mm (Fig. 1a). The mAuNSs were well dispersed in the SERS sticky note (Fig. 1b and c) and retained their characteristic absorbance peak at around 700 nm (Fig. S5†). The slight difference of the peak position compared to that of the free AuNSs (Fig. S2†) came from the different dispersive states of AuNSs and refractive indexes of the media.
SERS characteristics of the SERS sticky note
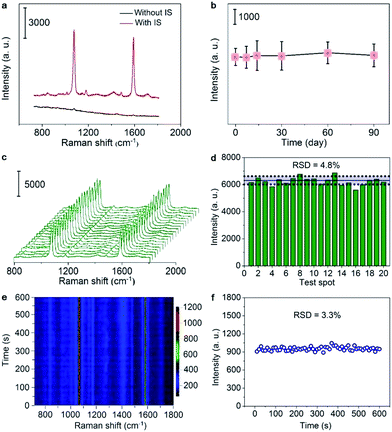
The SERS spectrum of the sticky note showed two strong peaks at 1076 and 1589 cm−1 from MBA27 (Fig. 2a), and the peak intensity at 1076 cm−1 showed remarkable long-term stability over three months at room temperature (Fig. 2b). Moreover, the signal represents impressive uniformity and reproducibility with a relative standard deviation (RSD) of 4.8% from 20 randomly selected spots on the sticky note (Fig. 2c and d). Due to the excellent thermal conductivity of hBN,28 the signal was also very stable against photothermal damage by a laser, as demonstrated by only 3.3% RSD under continuous laser irradiation of 600 s (Fig. 2e and f). These advantages guaranteed the capability of self-calibration and measurements for imaging applications. When the SERS sticky note was floated on 1.0 μM crystal violet (CV) solution, it showed strong SERS characteristic peaks of CV at 724, 760, 802, 916, 1174, 1365, 1538 and 1622 cm−1,29 while the Raman spectrum of this solution did not show visible peaks (Fig. S6a†). In addition, the control sticky notes in the absence of sAuNSs or lAuNSs, or constructed with monolayer graphene (1LG) instead of hBN all showed much weaker SERS intensities (Fig. S6a and b†). The enhancement factors for the SERS peak at 1174 cm−1 were calculated to be 1.1 × 10⁶ for IS-hBN@mAuNSs@hBN, 1.6 × 10⁵ for IS-hBN@lAuNSs@hBN, 3.2 × 10⁵ for IS-hBN@sAuNSs@hBN and 2.0 × 10⁵ for IS-1LG@mAuNSs@1LG sticky notes. Obviously, the presence of both the mAuNS monolayer and hBN effectively improved the SERS activity.Quantitative response to pyocyanin
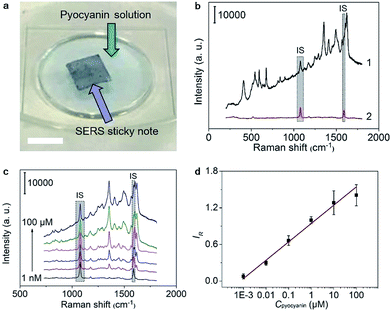
To verify the feasibility for quantitative detection of pyocyanin, as a QS signaling molecule, the SERS sticky note was floated on the pyocyanin solution to record the SERS spectra under 785 nm irradiation (Fig. 3a), which exhibited a series of pyocyanin characteristic peaks for ring deformations at 412, 519, 545, 593, 636, 676, 816, 841 and 895 cm−1, N–CH3 wagging at 1171 cm−1, ring stretchings at 1291, 1356, 1408, 1605 and 1622 cm−1, and –CH3 scissoring at 1492 and 1566 cm−1 (ref. 15) (Fig. 3b). The characteristic peak intensities of pyocyanin increased with the increasing concentration, while the intensity of the IS peaks remained stable (Fig. 3c). Taking the peaks at 1076 cm−1 and 1356 cm−1 to represent IS and pyocyanin respectively, the self-calibrated detection signal showed good linear dependence on the logarithmic value of the pyocyanin concentration from 1.0 × 10⁻⁹ to 1.0 × 10⁻⁴ M (R = 0.9916) (Fig. 3d). The limit of detection (LOD) was calculated from the triple signal-to-noise ratio to be 0.58 nM, which was about 5 orders of magnitude lower than the concentration found in clinical samples30 and also much lower than many previous studies.12,14,31,32The self-calibration capability of the sticky note for SERS imaging was evaluated by floating it on 1.0 × 10⁻⁴ M pyocyanin solution. After self-calibration, the SERS signals over the whole imaging area showed much better uniformity with an RSD decrease from 22.8% to 14.6% for 1681 data points (Fig. S7†). Thus the IS calibration effectively uniformed the SERS imaging signal by eliminating the disturbance from the substrate topography, instrumental variables and changes in light scattering from the solution.33 Moreover, the SERS sticky note was freestanding and flexible, which could tightly attach on various surfaces, such as opisthenar and an intravenous bag (Fig. S8a and b†), and demonstrated no deformation or detachment after water rinsing and mechanical crumpling (Fig. S8c to f†).
Real-time imaging of QS in the P. aeruginosa biofilm
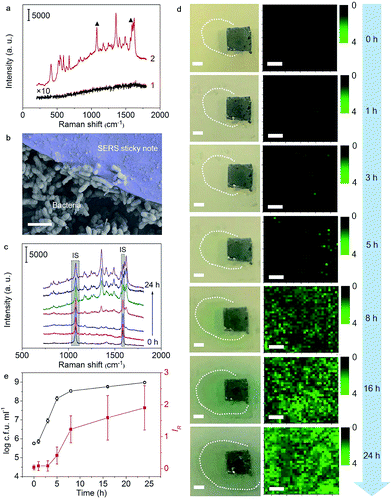
The satisfactory performance for pyocyanin detection and close adhesion to objects allowed the real-time imaging of pyocyanin secretion in developing biofilms and tracing of QS behaviors. After dropping pyocyanin-devoid P. aeruginosa suspension on a Luria–Bertani (LB)-agar plate to initiate bacterial growth, the SERS sticky note was adhered to the place where the suspension was dropped and cocultured for 24 h to in situ image pyocyanin secretion. The SERS spectrum from the sticky note demonstrated all the strong pyocyanin characteristic peaks, while no obvious Raman signal was collected from the bare biofilm (Fig. 4a), indicating the capability of the sticky note for real time QS tracing. As expected, the SERS sticky note could tightly adhere to the bottom biofilm (Fig. 4b), and the shape of underlying P. aeruginosa was clearly visible (Fig. S9†). Compared with other detection components,8–11,15,16 the close attachment of the sticky note to P. aeruginosa led to a quicker response to pyocyanin upon its secretion and guaranteed the spatiotemporal resolution for real-time monitoring of QS, which was demonstrated from the continuous SERS spectra during the biofilm growth (Fig. 4c), in which the SERS intensity of pyocyanin gradually increased while the intensities of IS remained stable. The spatial distribution of pyocyanin displayed by self-calibrated SERS imaging in a time course of 24 h demonstrated the increased secretion of pyocyanin (Fig. 4d). Impressively, due to the enhanced sensitivity of the SERS sticky note and its close attachment, QS could be imaged as easily as 1 h bacterial growth (Fig. S10†).Since pyocyanin secretion is seriously regulated by QS related to cell density,23–25 the relationship between bacterial growth and the pyocyanin expression level was analyzed. As shown in Fig. 4e, pyocyanin was slightly produced in the lag phase (0 to 1 h) and almost remained unchanged during the earlier logarithmic phase (1 to 3 h), but it visibly increased in the later logarithmic phase (3 to 5 h) to reach the maximum secretion rate in the earlier stationary phase (5 to 8 h), followed by slow secretion in the later stationary phase (8 to 24 h). These results revealed that pyocyanin secretion depended on the growth phase and reached the maximum in the early stationary phase, which was in agreement with previous studies,15,34,35 indicating the detecting reliability of the sticky note to monitor QS. In addition, the high spatial resolution of the sticky note to reveal pyocyanin distribution in biofilms was meaningful for future spatial heterogeneity studies of the metabolite involved in community behaviors.
The reusability of the sticky note was demonstrated by simply peeling it off from the biofilm with a tweezer after 24 h growth (Fig. S11a†) and washing it with ethanol to detect its SERS spectrum, which showed an IS peak intensity similar to that of a freshly prepared SERS sticky note at 1076 cm−1 (Fig. S11b†). After the regenerated sticky note was pasted to another P. aeruginosa biofilm with the same initial bacterial number and culture conditions, the SERS spectra collected after 24 h growth showed comparable signal intensity to that from the freshly prepared sticky note pasted on the biofilm (Fig. S11c to e†).
Inactivation of the P. aeruginosa biofilm by loading antibiotics on the sticky note
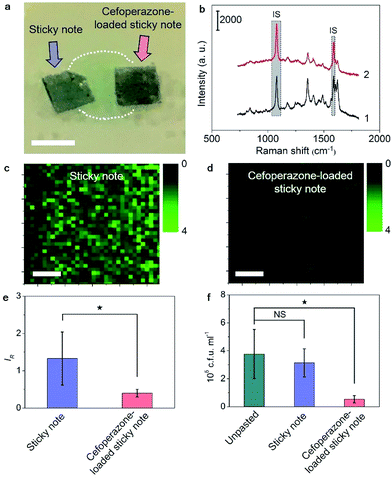
Besides the real-time tracing of QS, the SERS sticky note could be loaded with antibiotics to achieve multi-functionalization. Cefoperazone, an antibiotic with superior bactericidal ability to P. aeruginosa was loaded via van der Waals interactions for inactivation of the bacterial biofilm, and the inhibition effect could be simultaneously monitored in real time by SERS imaging of the pyocyanin secretion change due to the close relevance between QS and biofilm activity. Though the sticky note showed four cefoperazone characteristic peaks at 1298, 1354, 1451 and 1619 cm−1 (Fig. S12a†), the loading of cefoperazone did not affect the sensing ability of the sticky note in comparison with the SERS intensities of IS and pyocyanin after floating it on 1.0 nM pyocyanin solution (Fig. S12b†). To evaluate the inhibition effect of the multifunctional SERS sticky note on bacterial biofilm growth, the cefoperazone-loaded sticky note was pasted on a P. aeruginosa biofilm along with another note in the absence of antibiotic loading (Fig. 5a). The close attachment of the sticky note led to the full interaction of cefoperazone with the P. aeruginosa biofilm, which showed a weaker SERS peak intensity of pyocyanin after 8 h growth (Fig. 5b). The SERS imaging also demonstrated the suppression of pyocyanin secretion (Fig. 5c and d). The average intensity of pyocyanin for the cefoperazone-loaded sticky note was 30.1% of that for the normal sticky note (Fig. 5e). The obvious decrease of pyocyanin secretion in response to cefoperazone indicated bacterial death, which was confirmed by viable bacteria counting. The pasting of the normal sticky note did not lead to a significant difference in the live bacterial number, while the live bacterial number after pasting the cefoperazone-loaded SERS sticky note was only 14.4% of the original biofilm (Fig. 5f), demonstrating the good biocompatibility of the SERS sticky note and its capability of bacterial biofilm inactivation with real-time inactivation effect evaluation after loading antibiotics.Cefoxitin, which has no bactericidal ability to P. aeruginosa, was also loaded on the SERS sticky note and incubated with P. aeruginosa for 8 h as a control. This sticky note showed the cefoxitin characteristic peaks at 1403 and 1438 cm−1 on the SERS spectrum (Fig. S13†). Both SERS imaging of pyocyanin secretion and viable bacteria counting demonstrated little effect on bacterial biofilm growth compared with the original biofilm (Fig. S14†). This result further demonstrated the antibacterial ability of the multifunctional SERS sticky note via loading antibiotics.
Conclusions
This work presents a multifunctional SERS sticky note with self-calibration ability for reliable real-time tracing of QS, quantification of secretion, and further inactivation of bacterial biofilms and simultaneous inactivation effect evaluation after loading antibiotics. The mAuNS monolayer and hBN brings high SERS sensitivity, stability and reproducibility, and the self-calibration guarantees the reliability of SERS measurements, which lead to excellent performance for quantitation of pyocyanin, an indicator of QS. The sticky note can be simply pasted on natural biofilms for a quicker response to pyocyanin secretion for long-time tracing of QS. This work opens a new avenue for studying QS in a convenient and low-cost manner and shows potential for applications of the designed sticky note in inactivation of pathogenic bacteria and developing a medicine evaluation platform for antibiotic therapeutics.Conflicts of interest
The authors declare no competing financial interests.Acknowledgements
This work was financially supported by the National Natural Science Foundation of China (21635005, 21605083, 21605080) and Natural Science Foundation of Jiangsu Province (BK20160644, BK20160646).References
- J. Q. Boedicker, M. E. Vincent and R. F. Ismagilov, Angew. Chem., Int. Ed., 2009, 48, 5908–5911 CrossRef PubMed.
- M. E. Hibbing, C. Fuqua, M. R. Parsek and S. B. Peterson, Nat. Rev. Microbiol., 2010, 8, 15–25 CrossRef PubMed.
- A. Korgaonkar, U. Trivedi, K. P. Rumbaugh and M. Whiteley, Proc. Natl. Acad. Sci. U. S. A., 2013, 110, 1059–1064 CrossRef PubMed.
- M. Whiteley, S. P. Diggle and E. P. Greenberg, Nature, 2017, 551, 313–320 CrossRef PubMed.
- P. K. Singh, A. L. Schaefer, M. R. Parsek, T. O. Moninger, M. J. Welsh and E. P. Greenberg, Nature, 2000, 407, 762–764 CrossRef PubMed.
- J. K. Jansson, Curr. Opin. Microbiol., 2003, 6, 310–316 CrossRef PubMed.
- A. K. Wessel, T. A. Arshad, M. Fitzpatrick, J. L. Connell, R. T. Bonnecaze, J. B. Shear and M. Whiteley, mBio, 2014, 5, e00992-14 CrossRef PubMed.
- Y. Z. Ding, Y. F. Zhou, J. Yao, C. Szymanski, J. Fredrickson, L. Shi, B. Cao, Z. H. Zhu and X. Y. Yu, Anal. Chem., 2016, 88, 11244–11252 CrossRef PubMed.
- E. J. Lanni, R. N. Masyuko, C. M. Driscoll, J. T. Aerts, J. D. Shrout, P. W. Bohn and J. V. Sweedler, Anal. Chem., 2014, 86, 9139–9145 CrossRef PubMed.
- J. L. Connell, J. Kim, J. B. Shear, A. J. Bard and M. Whiteley, Proc. Natl. Acad. Sci. U. S. A., 2014, 111, 18255–18260 CrossRef PubMed.
- D. L. Bellin, H. Sakhtah, Y. H. Zhang, A. Price-Whelan, L. E. P. Dietrich and K. L. Shepard, Nat. Commun., 2016, 7, 10535 CrossRef PubMed.
- O. Žukovskaja, I. J. Jahn, K. Weber, D. Cialla-May and J. Popp, Sensors, 2017, 17, 1704 CrossRef PubMed.
- S. Polisetti, N. F. Baig, N. Morales-Soto, J. D. Shrout and P. W. Bohn, Appl. Spectrosc., 2017, 71, 215–223 CrossRef PubMed.
- X. M. Wu, J. Chen, X. B. Li, Y. P. Zhao and S. M. Zughaier, Nanomedicine, 2014, 10, 1863–1870 CrossRef PubMed.
- G. Bodelón, V. Montes-García, V. López-Puente, E. H. Hill, C. Hamon, M. N. Sanz-Ortiz, S. Rodal-Cedeira, C. Costas, S. Celiksoy, I. Pérez-Juste, L. Scarabelli, A. L. Porta, J. Pérez-Juste, I. Pastoriza-Santos and L. M. Liz-Marzán, Nat. Mater., 2016, 15, 1203–1211 CrossRef PubMed.
- G. Bodelón, V. Montes-García, C. Costas, I. Pérez-Juste, J. Pérez-Juste, I. Pastoriza-Santos and L. M. Liz-Marzán, ACS Nano, 2017, 11, 4631–4640 CrossRef PubMed.
- H. Y. Wang, Y. F. Zhou, X. X. Jiang, B. Sun, Y. Zhu, H. Wang, Y. Y. Su and Y. He, Angew. Chem., Int. Ed., 2015, 54, 5132–5136 CrossRef PubMed.
- X. Y. Meng, H. Y. Wang, N. Chen, P. Ding, H. Y. Shi, X. Zhai, Y. Y. Su and Y. He, Anal. Chem., 2018, 90, 5646–5653 CrossRef PubMed.
- G. Kim, M. Kim, C. Hyun, S. Hong, K. Y. Ma, H. S. Shin and H. Lim, ACS Nano, 2016, 10, 11156–11162 CrossRef PubMed.
- N. Zhang, L. Tong and J. Zhang, Chem. Mater., 2016, 28, 6426–6435 CrossRef.
- W. G. Xu, J. Q. Xiao, Y. F. Chen, Y. B. Chen, X. Ling and J. Zhang, Adv. Mater., 2013, 25, 928–933 CrossRef PubMed.
- Q. R. Cai, S. Mateti, W. R. Yang, R. Jones, K. Watanabe, T. Taniguchi, S. M. Huang, Y. Chen and L. H. Li, Angew. Chem., Int. Ed., 2016, 55, 8405–8409 CrossRef PubMed.
- W. Kim, N. Kim, J. W. Park and Z. H. Kim, Nanoscale, 2016, 8, 987–994 RSC.
- L. S. Pierson III and E. A. Pierson, Appl. Microbiol. Biotechnol., 2010, 86, 1659–1670 CrossRef PubMed.
- J. Lee and L. Zhang, Protein Cell, 2015, 6, 26–41 CrossRef PubMed.
- P. S. Kumar, I. Pastoriza-Santos, B. Rodríguez-González, F. J. G. de Abajo and L. M. Liz-Marzán, Nanotechnology, 2008, 19, 015606 CrossRef PubMed.
- S. H. Cho, H. S. Han, D. J. Jang, K. Kim and M. S. Kim, J. Phys. Chem., 1995, 99, 10594–10599 CrossRef.
- I. Jo, M. T. Pettes, J. Kim, K. Watanabe, T. Taniguchi, Z. Yao and L. Shi, Nano Lett., 2013, 13, 550–554 CrossRef PubMed.
- I. Persaud and W. E. L. Grossman, J. Raman Spectrosc., 1993, 24, 107–112 CrossRef.
- R. C. Hunter, V. Klepac-Ceraj, M. M. Lorenzi, H. Grotzinger, T. R. Martin and D. K. Newman, Am. J. Respir. Cell Mol. Biol., 2012, 47, 738–745 CrossRef PubMed.
- E. Kim, T. Gordonov, W. E. Bentley and G. F. Payne, Anal. Chem., 2013, 85, 2102–2108 CrossRef PubMed.
- C. Q. Nguyen, W. J. Thrift, A. Bhattacharjee, S. Ranjbar, T. Gallagher, M. Darvishzadeh-Varcheie, R. N. Sanderson, F. Capolino, K. Whiteson, P. Baldi, A. I. Hochbaum and R. Ragan, ACS Appl. Mater. Interfaces, 2018, 10, 12364–12373 CrossRef PubMed.
- S. E. Bell and N. M. S. Sirimuthu, Chem. Soc. Rev., 2008, 37, 1012–1024 RSC.
- L. E. P. Dietrich, A. Price-Whelan, A. Petersen, M. Whiteley and D. K. Newman, Mol. Microbiol., 2006, 61, 1308–1321 CrossRef PubMed.
- A. Price-Whelan, L. E. P. Dietrich and D. K. Newman, J. Bacteriol., 2007, 189, 6372–6381 CrossRef PubMed.
Footnotes |
| † Electronic supplementary information (ESI) available: Experimental section and 14 supplementary figures. See DOI: 10.1039/c8sc02078g |
| ‡ J. X. Guo and Y. Liu contributed equally to this work. |
| This journal is © The Royal Society of Chemistry 2018 |

