 Open Access Article
Combined scanning electrochemical and fluorescence microscopies using a tetrazine as a single redox and luminescent (electrofluorochromic) probe†
L.
Guerret-Legras
,
J. F.
Audibert
,
G. V.
Dubacheva
 and
F.
Miomandre
 *
*
PPSM, CNRS, Ecole Normale Supérieure Paris-Saclay, Université Paris-Saclay, 61 Avenue Président Wilson, 94235 Cachan, France. E-mail: mioman@ens-cachan.fr
First published on 30th May 2018
Abstract
The possibility of using a single electroactive and luminescent molecule both as a redox mediator and as a fluorophore in an experiment combining in situ Scanning Electrochemical Microscopy (SECM) and epifluorescence microscopy was validated. The usual working modes of SECM, namely positive and negative feedback as well as generation–collection, were used and the fluorescence images, intensity and spectra were recorded for each configuration. The tip potential, tip–substrate distance and, in the case of a conducting substrate, the substrate potential are the parameters that are likely to control the fluorescence. It is shown that the tip can be used to switch on and off the luminescence and that the modulation amplitude maximum is sensitive to the nature of the substrate. Approach curves based on this fluorescence modulation amplitude can be obtained showing a higher sensitivity than the classical electrochemical ones.
1. Introduction
The combination of electrochemical and fluorescence techniques has been the subject of growing interest among the scientific community from the beginning of the 1990s, starting with emission spectroelectrochemistry1 and moving gradually towards more advanced configurations allowing spatially resolved measurements like fluorescence microscopy.2 The topic was recently reviewed3 and this combination of fluorescence and electrochemical techniques has been used to solve practical problems like the selective addressing of phospholipids in liposomes4 or for imaging transient concentration profiles at microelectrode surfaces.5 Among others, this combination has the great advantage of converting the electrochemical information, given by the current, into an optical signal, therefore improving the signal to noise ratio.Examples where fluorescence microscopy and scanning electrochemical microscopy (SECM) are combined are scarce in the literature since its first report.6 Heinze et al. applied this coupling for local pH measurements using pH-sensitive fluorophores.7 A decade later, the same hyphenated set-up was reused by Salamifar et al. for the detection of Reactive Oxygen Species (ROS) released by a cell8 and by Amemiya et al. to investigate the permeation issues of a nuclear pore complex.9 Meanwhile Bard et al. also used this coupling to design nanopatterns through SECM writing and visualize them through fluorescence microscopy.10 In these examples, the fluorescence and electrochemical responses are due to different compounds. Usually the electrochemical signal is used to trigger a phenomenon (like a pH change7 or a cycloaddition reaction10) that the fluorescence is going to report. However, there is also a need to develop systems where the electrochemical and luminescence signals are simultaneously measured at the local scale and coming from a unique molecule. This is especially true for example in the investigation of exocytosis11 where a dramatic increase in the space and time resolution of the event was recently observed using a single redox and luminescent moiety.12 Molecules displaying both redox activity in an easily accessible potential range and visible light emission properties are said to be electrofluorochromic (EF) since their luminescence can be switched reversibly by changing their redox state.13 Tetrazines14 belong to this category and their EF behaviour was extensively investigated by us15 and even used to make displays.16 Their great advantages are that they can be excited by close UV or even visible light and have long emission lifetimes. Therefore we thought they could be good candidates for use in a dual role of redox mediator and fluorophore in a combined SECM–fluorescence microscopy experiment. To the best of our knowledge this is the first example of this coupling using a single molecular compound in this dual role. As the redox mediator, the tetrazine can be used to accurately position the SECM tip at a distance closest to the substrate using classical approach curves.17 Then, the luminescence of the probe can be directly tuned by the polarization of the tip and recorded through a fluorescence microscope, either in TIRF (Total Internal Reflection Fluorescence)18 or in wide field configuration, irrespective of the polarization of the substrate when it is conductive. This opens new ways of directly analyzing these two properties at the very local scale and in real time for versatile applications like identification of species involved in biochemical processes or activation of redox and luminescent properties of a molecule through plasmonic electrodes. It also highlights the possibility to tune the fluorescence of molecules grafted on the substrate surface even if this latter is totally insulating thanks to the polarization of the tip. This paper aims to demonstrate that fluorescence images, spectra and intensities can be recorded simultaneously under electrochemical control, in all the configurations classically used in SECM.
2. Results and discussion
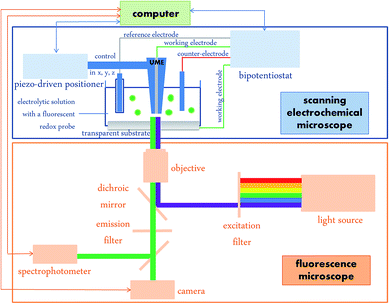
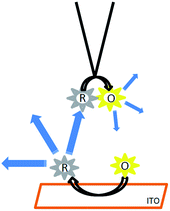
The overall set-up is represented in Scheme 1.The substrate acting as the working electrode is put on the microscope stage that divides the overall set-up into two parts: the lower part is the fluorescence microscope with excitation and emission going through the same objective and two outputs to collect fluorescence images and spectra. The upper part is devoted to SECM with the ultramicroelectrode (UME, 20 μm diameter) tip location controlled by piezo positioners. A bipotentiostat enables simultaneous control of the SECM tip and substrate polarizations as independent working electrodes in a 4-electrode configuration.
2.1. Feedback mode
In the feedback mode, the distance between the tip and substrate controls the current measured at the tip. When the substrate is insulating, this current drops when the tip approaches the substrate due to restricted diffusion (negative feedback). Conversely when the substrate is conductive, the current increases at a short distance because the reactant concentration increases at the tip due to its regeneration induced by the reverse electrochemical reaction at the substrate (positive feedback). The two processes are illustrated in Scheme 2 for an EF mediator which is supposed to emit in the oxidized state and not in the reduced state. The aim of this paper is to show how the fluorescence can be controlled both by the tip potential and by the tip–substrate distance in the two types of feedback configurations. In particular, we will focus on the relative amplitude of the fluorescence modulation in these two configurations and the way this output varies with the tip–substrate distance.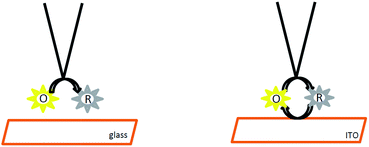 | ||
| Scheme 2 Role of the electrofluorochromic mediator in the feedback mode on insulating (left) and conducting (right) substrates. | ||
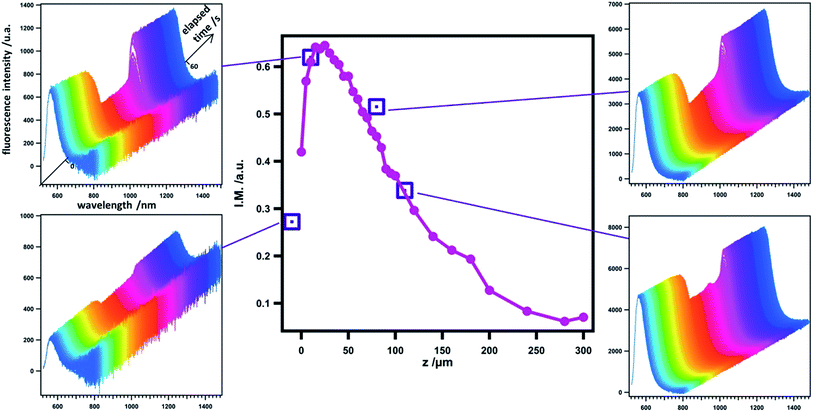 | ||
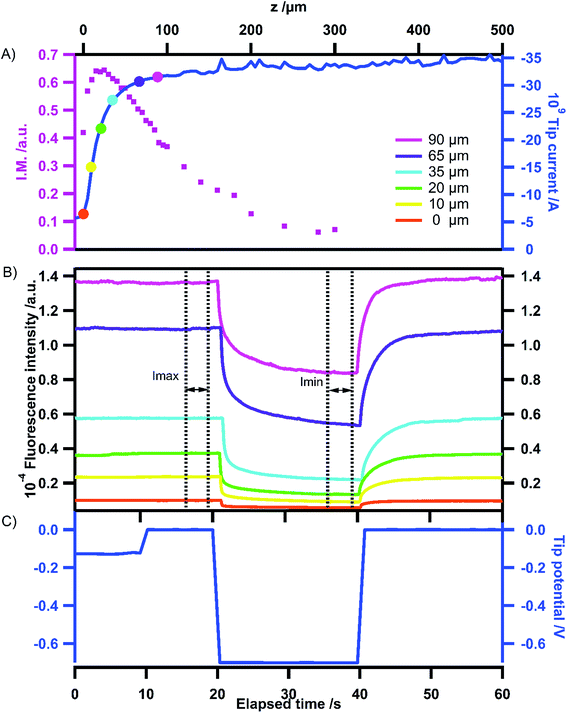
| Fig. 2 Evolution of emission spectra with time at various tip positions in the negative feedback mode. The tip potential signal corresponds to the following sequence: open circuit (10 s); 0 V (10 s); −0.7 V (20 s); 0 V (20 s) as in Fig. 1C. Purple squares are the normalized amplitude I.M. = (Imax − Imin)/Imax of the fluorescence intensity variation calculated from chronofluorograms obtained by the integration of emission spectra with time at the corresponding tip position. For a comparison a similar curve obtained with the camera and corresponding to Fig. 1A (pink dots) is overlaid. | ||
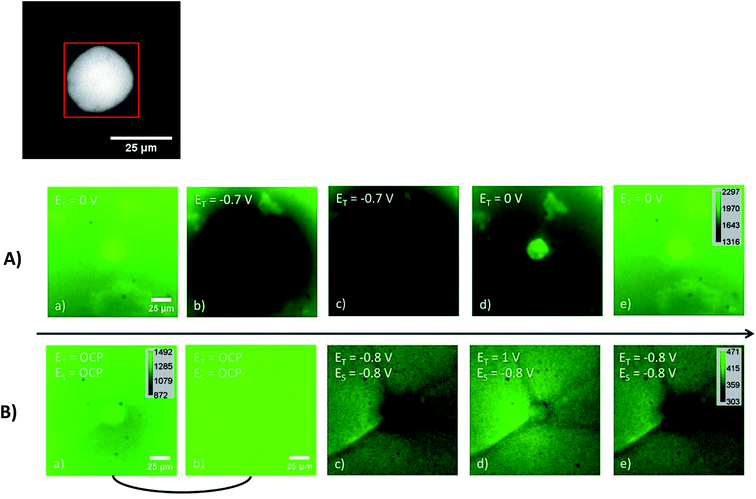
Fluorescence images recorded at a fixed position but at various tip and substrate potential values have also been recorded and are shown in Fig. 3. The region of interest (ROI) is indicated by the red square surrounding the tip. On the insulating substrate (Fig. 3A), starting from the homogeneous fluorescence signal in the whole ROI, it is possible to switch off almost all the emission by applying a negative potential at the tip. A clear difference in the images can be seen between the beginning and the end of the period where the tip is polarized at a given potential (compare (b) vs. (c) in Fig. 3A). When stepping back the tip potential to 0 V, the fluorescence is gradually restored first at the tip and then around it, as can be seen on the two images (d and e) in Fig. 3A.
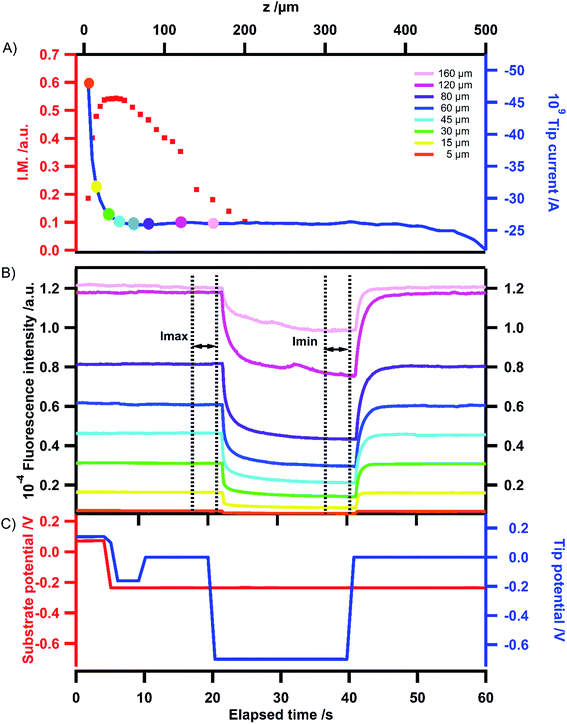
The variation of electrochemical current with tip position, constituting the electrochemical approach curve is shown in Fig. 4A (blue trace). As expected the current increases when the tip approaches the substrate, illustrating the positive feedback mode.‡ The corresponding variation of fluorescence intensity with the tip position is shown in Fig. 4B when the tip is used to switch the fluorescence according to the signal displayed in Fig. 4C. At first sight, the behaviour looks similar to that of the previous case. Indeed, the modulation remains low at long distances and gradually increases when the tip approaches the substrate for the same reasons as stated in the previous section. In the region of closest approach where the electrochemical current significantly increases, the normalized amplitude of the fluorescence modulation reaches the maximum and drops (see the red curve in Fig. 4A). Once again it can be emphasized that this modulation amplitude is more sensitive to the tip–substrate distance than the electrochemical current. The fact that the normalized amplitude does not exactly match the variation of the electrochemical current is fairly expected since the ROI where the fluorescence intensity is recorded spreads over the diffusion area between the tip and the substrate. Typically there is a contribution from the lateral diffusion of the regenerated emitting species at the substrate. This is illustrated when looking more carefully at the role played by the substrate potential. Fig. 5 displays the variation of the normalized amplitude against the tip position (fixed substrate) when the same potential is applied at the tip but for various potentials applied at the substrate. Globally it appears that the more efficient the regeneration at the substrate, the lower the maximal amplitude. It is noteworthy that all the curves merge at longer distances (at tip positions higher than 100 μm), showing that the fluorescence modulation is not sensitive at all to the nature of the substrate over this threshold. When the substrate is polarized at more positive potentials, the regeneration of neutral tetrazines leads to the diffusion of emitters that escape from the electrochemical reaction at the tip but their fluorescence is recorded as they are located in the ROI. Thus the modulation amplitude maximum is lower. Changing the electrode material from ITO to Au coated ITO confirms the suggested trend. The faster kinetics on Au (see CVs in Fig. S1†) leads to a normalized amplitude at its maximum which is significantly lower than on ITO, even when the latter is polarized at positive potentials.
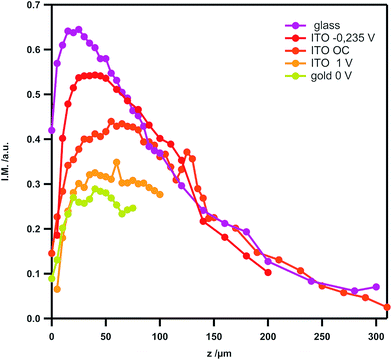 | ||
| Fig. 5 Variation of the amplitude I.M. = (Imax − Imin)/Imax of the fluorescence intensity with the tip position at various substrate potentials (see Fig. 1–4 for the definition of Imax and Imin) on ITO. The tip potential is stepped from 0 to −0.7 V for all curves. For comparison, a similar curve relative to the insulating substrate (glass) is overlaid, as well as the one obtained when the ITO substrate is coated with a very thin layer of gold. | ||
The role of the tip and substrate potentials on the fluorescence is also visible in the fluorescence images recorded in Fig. 3B, which displays similar images to those for the insulating substrate in Fig. 3A. When both the tip and the substrate are polarized at −0.8 V, all the fluorophores are electrochemically converted into their non-emissive form and the whole fluorescence is switched off.§ From that state, if the tip is polarized at 1 V, tetrazine anion radicals are locally reoxidized into their neutral emissive form and the fluorescence is restored. This is clearly visible in image (d) where the tip is brighter than in image (c). Moving the tip potential to −0.8 V again brings the fluorophore back to its non-emissive state and the image (see (e)) becomes darker again. Then it can be visualized that the tip potential at a given position actually controls the fluorescence intensity.
2.2. Generation–collection mode
In this mode, the substrate can be used to electrochemically generate a species that the tip is going to collect and detect (see Scheme 3). Typically, while the substrate is polarized at a fixed potential for a certain time, the tip is positioned at a given distance and a potential sweep (CV) or step (chronoamperometry) is applied for the detection.Fig. S2† shows the CV recorded on the tip when the substrate is polarized at two potential values: 0 V where nothing occurs and −0.8 V where the anion radical of tetrazine is continuously produced at the substrate. In the first case, only a cathodic wave can be seen, indicating that the tip detects an oxidant. Conversely in the second case, an oxidation wave is visible corresponding to the back reaction of the anion radical produced at the substrate which is reoxidized into neutral tetrazine when the potential is scanned on the tip. This confirms that the substrate generation–tip collection mode operates well as expected.
Simultaneous recording of the fluorescence intensity in that mode allows the probing of the sensitivity of the detection by the tip of the compound produced at the substrate. The results are shown in Fig. 6. In these experiments, after a period where both the substrate and the tip are polarized at a sufficiently negative potential to generate the anion radical, the tip is polarized at various potentials allowing to reoxidize the anion radical of tetrazine into the neutral form (see the signal in Fig. 6C), which is expected to switch on the fluorescence. The time period during which the tip is polarized at positive potentials is the collection period. While in Fig. S2† the collection by the tip is probed by CV, here it is probed by chronoamperometry. The corresponding electrochemical current (Fig. 6B) and fluorescence intensity (Fig. 6A) show that collection actually occurs. Indeed, it can be seen that the fluorescence is restored exactly at the time when the tip is polarized at 0 V or more positive values. A very good correlation between the electrochemical current and the fluorescence intensity can be seen since similar currents (between 0 and 0.5 V) give similar fluorescence intensities but a higher current at 1 V also gives enhanced intensity. This demonstrates that the luminescence at the tip is sensitive to probe the species produced at the substrate in the generation–collection mode of SECM. In the far field configuration used presently the sensitivity is quite low but it can be expected to be enhanced by collecting the fluorescence closer to the tip position which can be achieved for example in the confocal configuration.
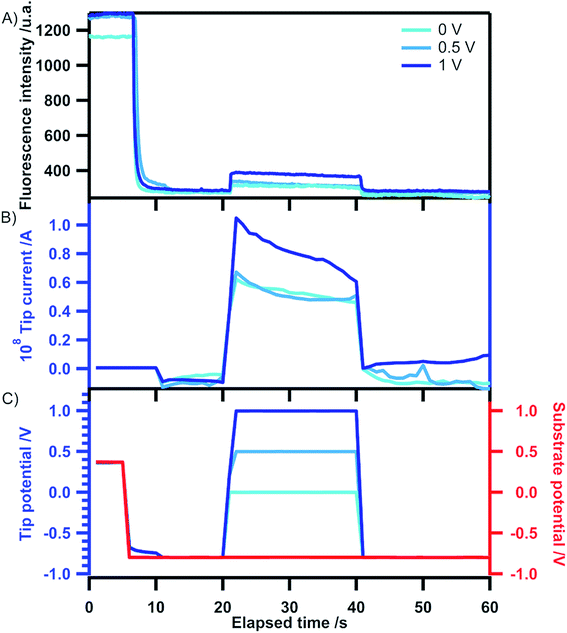 | ||
| Fig. 6 Variation of fluorescence intensity (A), tip current (B) and tip potential (C) with time in the substrate generation–tip collection mode. The tip position is the one selected in the approach curve of Fig. S2.† The ITO substrate potential is stepped from open circuit (5 s) to −0.8 V for the remaining time (55 s). The tip potential is stepped from open circuit (20 s) to the indicated value (20 s) and back to open circuit (20 s). | ||
2.3. Modelling
To further understand the variation of the normalized amplitude (Imax − Imin)/Imaxvs. tip–substrate distance, a modelling using the commercially available Comsol™ software has been performed. The details of the calculations and geometry used can be found in ESI.†Fig. 7 shows the calculated modulation amplitude and integral of concentrations vs. tip–substrate distance on insulating and conducting substrates. It can be noticed that the maximum amplitude at short distance is significantly lower for the conducting substrate as expected. Indeed, the feedback reaction at the substrate generates new fluorescent species in such an amount that the tip cannot fully convert. Therefore, the overall fluorescence intensity in the ROI is greater. This result is also observed in our experimental curves. Moreover, the threshold distance at which the amplitude starts to be sensitive to what happens on the substrate is around 200 μm, which is the order of magnitude of what is observed experimentally. However, the drop in the amplitude at the shortest distances is not observed in the theoretical curves. Clearly this is due to the fact that the minimum intensity at a short distance does not tend toward zero experimentally while it should do based on the simulation. Thus the maximum intensity upon decreasing reaches this minimal value before dropping to zero, leading to the amplitude decrease. It has been checked experimentally that this is not due to any background intensity (electrolyte, solvent, optics, etc.) nor due to the residual excitation coming through the dichroic mirror and filters. One may assign this artefact to the contribution of the reflection on the tip and its possible interference with the incoming light. More precisely it is likely that the collection efficiency of this reflected light varies with the tip–substrate distance. At the shortest distances, this probably contributes to an overestimation of Imin, while in the presence of emitted light this contribution is totally negligible. Another possibility of discrepancy between simulation and experiment might also come from a tiny tilt angle between the tip and the substrate which is not taken into account in the modelling.
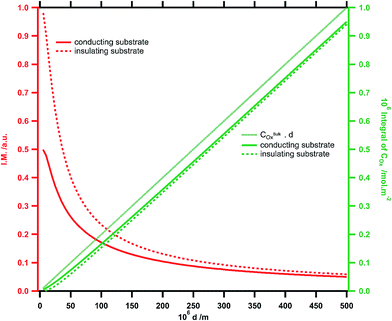 | ||
| Fig. 7 Simulated normalized amplitude of the fluorescence modulation (red trace) and calculated integral of the concentration in oxidized species (green trace) vs. tip–substrate distance d for conducting (full line) and insulating (dashed line) substrates. [20] | ||
3. Conclusions
The combination of electrochemical microscopy (SECM) and fluorescence microscopy using a single redox and fluorescence (electrofluorochromic) compound has been achieved. It shows that the fluorescence intensity of the electrofluorochromic mediator can be controlled by the potential of the tip irrespective of the potential of the substrate and that the amplitude of the fluorescence modulation is very sensitive to the tip–substrate distance. This enables recording approach curves through the optical signal, with a higher sensitivity and an improved signal to noise ratio compared to the classical electrochemical one.In the feedback mode, the maximal fluorescence modulation amplitude is lower when the substrate is conductive. The maximal amplitude is lower when the electrochemical feedback reaction at the substrate is more efficient. The behaviour is confirmed by the results of the theoretical simulation based on diffusion limited current and its integration to evaluate the fluorescence intensity. In the generation–collection mode, the electrochemical current at the tip and the fluorescence intensity are both sensitive to the species produced by the substrate. Fluorescence images and spectra can be also recorded to visualize the modulation induced by the electrochemical reaction at the tip. In the near future pulse excitation will be tested to add luminescence lifetime as an additional output of the set-up, allowing investigation of the quenching mechanisms. Plasmonic substrates will also be used to highlight a possible impact of plasmon on the electrofluorochromic behaviour of the mediator and discriminate their relative influence on luminescence and/or electrochemical properties.
Conflicts of interest
There are no conflicts to declare.Acknowledgements
CHARMMMAT Labex and Region Ile-de-France (C'Nano network) are acknowledged for financial support in the building of the setup.Notes and references
- (a) R. G. Compton and R. G. Wellington, Spectrofluorometric hydrodynamic voltammetry: the investigation of the electrode reaction mechanisms, J. Phys. Chem., 1994, 98, 270–273 CrossRef; (b) M. Dias, P. Hudhomme, E. Levillain, L. Perrin, Y. Sahin, F. X. Sauvage and C. Wartelle, Electrochemistry coupled to fluorescence spectroscopy: a new versatile approach, Electrochem. Commun., 2004, 325–330 CrossRef.
- F. Miomandre, R. Meallet-Renault, J. J. Vachon, R. B. Pansu and P. Audebert, Fluorescence microscopy coupled to electrochemistry: a powerful tool for the controlled electrochemical switch of fluorescent molecules, Chem. Commun., 2008, 1913–1915 RSC.
- L. Bouffier and T. Doneux, Coupling electrochemistry with in situ fluorescence (confocal) microscopy, Curr. Opin. Electrochem., 2017, 6, 31–37 CrossRef.
- A. I. P. Jimenez, L. Challier, E. Ait-Yahiatene, J. Delacotte, E. Labbe and O. Buriez, Selective Electrochemical Bleaching of the Outer Leaflet of Fluorescently Labeled Giant Liposomes, Chem.–Eur. J., 2017, 23, 6781–6787 CrossRef PubMed.
- S. M. Oja and B. Zhang, Imaging Transient Formation of Diffusion Layers with Fluorescence-Enabled Electrochemical Microscopy, Anal. Chem., 2014, 86, 12299–12307 CrossRef PubMed.
- R. Mukhopadhyay, SECM meets fluorescence microscopy, Anal. Chem., 2004, 76, 224A Search PubMed.
- F. M. Boldt, J. Heinze, M. Diez, J. Petersen and M. Borsch, Real-time pH microscopy down to the molecular level by combined scanning electrochemical microscopy/single-molecule fluorescence spectroscopy, Anal. Chem., 2004, 76, 3473–3481 CrossRef PubMed.
- S. E. Salamifar and R. Y. Lai, Use of Combined Scanning Electrochemical and Fluorescence Microscopy for Detection of Reactive Oxygen Species in Prostate Cancer Cells, Anal. Chem., 2013, 85, 9417–9421 CrossRef PubMed.
- J. Kim, A. Izadyar, M. Shen, R. Ishimatsu and S. Amemiya, Ion Permeability of the Nuclear Pore Complex and Ion-Induced Macromolecular Permeation as Studied by Scanning Electrochemical and Fluorescence Microscopy, Anal. Chem., 2014, 86, 2090–2098 CrossRef PubMed.
- S. Y. Ku, K. T. Wong and A. J. Bard, Surface patterning with fluorescent molecules using click chemistry directed by scanning electrochemical microscopy, J. Am. Chem. Soc., 2008, 130, 2392–2393 CrossRef PubMed.
- A. Meunier, O. Jouannot, R. Fulcrand, I. Fanget, M. Bretou, E. Karatekin, S. Arbault, M. Guille, F. Darchen, F. Lemaitre and C. Amatore, Coupling Amperometry and Total Internal Reflection Fluorescence Microscopy at ITO Surfaces for Monitoring Exocytosis of Single Vesicles, Angew. Chem., Int. Ed., 2011, 50, 5081–5084 CrossRef PubMed.
- X. Q. Liu, A. Savy, S. Maurin, L. Grimaud, F. Darchen, D. Quinton, E. Labbe, O. Buriez, J. Delacotte, F. Lemaitre and M. Guille-Collignon, A Dual Functional Electroactive and Fluorescent Probe for Coupled Measurements of Vesicular Exocytosis with High Spatial and Temporal Resolution, Angew. Chem., Int. Ed., 2017, 56, 2366–2370 CrossRef PubMed.
- P. Audebert and F. Miomandre, Electrofluorochromism: from molecular systems to set-up and display, Chem. Sci., 2013, 4, 575–584 RSC.
- G. Clavier and P. Audebert, s-Tetrazines as Building Blocks for New Functional Molecules and Molecular Materials, Chem. Rev., 2010, 110, 3299–3314 CrossRef PubMed.
- F. Miomandre, E. Lepicier, S. Munteanu, O. Galangau, J. F. Audibert, R. Meallet-Renault, P. Audebert and R. B. Pansu, Electrochemical Monitoring of the Fluorescence Emission of Tetrazine and Bodipy Dyes Using Total Internal Reflection Fluorescence Microscopy Coupled to Electrochemistry, ACS Appl. Mater. Interfaces, 2011, 3, 690–696 CrossRef PubMed.
- Y. Kim, E. Kim, G. Clavier and P. Audebert, New tetrazine-based fluoroelectrochromic window: modulation of the fluorescence through applied potential, Chem. Commun., 2006, 3612–3614 RSC.
- (a) J. Kwak and A. J. Bard, Scanning Electrochemical Microscopy. Theory of the feedback mode, Anal. Chem., 1989, 61, 1221–1227 CrossRef; (b) A. J. Bard, M. V. Mirkin, P. R. Unwin and D. O. Wipf, Scanning Electrochemical Microscopy. 12. Theory and experiment of the feedback mode with finite heterogeneous electron transfer kinetics and arbitrary substrate size, J. Phys. Chem., 1992, 96, 1861–1868 CrossRef.
- A. Trache and G. A. Meininger, Total internal reflection fluorescence (TIRF) microscopy, Curr Protoc. Microbiol., 2008 Search PubMed.
- S. Seo and E. Kim, Electrofluorochromic devices with organic dyes and conjugated polymers, in Luminescence in electrochemistry, ed. Miomandre F. and Audebert P., Springer, 2017, pp. 139–174 Search PubMed.
- A. K. Neufeld and A. P. O'Mullane, Effect of the mediator in feedback mode-based SECM interrogation of indium tin-oxide and boron-doped diamond electrodes, J. Solid State Electrochem., 2006, 10, 808–816 CrossRef.
Footnotes |
| † Electronic supplementary information (ESI) available. See DOI: 10.1039/c8sc01814f |
| ‡ This is due to the fact that a conductive substrate allows the reverse reaction to occur at the substrate compared to the tip, simply because accumulation of the reduced form shifts the open circuit potential of the substrate to a value allowing the reoxidation to occur. |
| § Images in the all reduced mode appear clearer in Fig. 3B than in 3A because the luminosity and contrast settings are different. Typically the luminosity is strongly enhanced (compare image (a) and (b) in 3B) to visualize the dark state. |
| This journal is © The Royal Society of Chemistry 2018 |

