 Open Access Article
Creative Commons Attribution 3.0 Unported Licence
Hydrothermal assisted in situ growth of CoSe onto graphene nanosheets as a nanohybrid positive electrode for asymmetric supercapacitors†
Balakrishnan
Kirubasankar
,
Vignesh
Murugadoss
and
Subramania
Angaiah
 *
*
Electrochemical Energy Research Lab, Centre for Nanoscience and Technology, Pondicherry University, Puducherry-605014, India. E-mail: a.subramania@gmail.com
First published on 17th January 2017
Abstract
Cobalt selenide–graphene (CoSe–G) nanohybrid was successfully synthesised by a simple and facile one-pot hydrothermal method and used as a positive electrode for an asymmetric supercapacitor. The CoSe–G nanohybrid electrode exhibits a higher specific capacitance of 1037 F g−1 at 5 mV s−1 than CoSe. The electrochemical impedance studies revealed that the graphene in the nanohybrid not only reduced the contact resistance of the electrode but also significantly increases the electrons transport. The good electrochemical performance of CoSe–G is the synergy between CoSe and graphene. In addition, the asymmetric supercapacitor (ASC) was fabricated using CoSe–G and activated carbon as the positive electrode and negative electrode, respectively, and electrospun PVdF membrane containing 6 M KOH as the separator as well as electrolyte. The fabricated ASC delivered an extended operating voltage window of 1.6 V. It also provides a higher energy density of 45.5 W h kg−1 and a power density of 1.1 kW kg−1 and retains 81% of its initial specific capacitance even after 5000 cycles.
1. Introduction
Supercapacitors are an emerging candidate to accumulate energy in the form of charge and release energy rapidly. They have high power density, long-life cycle, short time charging and discharging, highly reversible charge storage process and better safety tolerances than batteries. The electrode materials directly determine the capability, delivery rates and efficiency of the overall supercapacitor devices.1–3 However, it is necessary to find appropriate electroactive materials with hierarchical pores and tubular or layered structures, that can promote ion diffusion and charge transport thereby enhancing the power density and cycling stability of supercapacitors. The composition and phase of certain pseudocapacitive materials additionally affect energy storage. At present, many nanostructure materials such as graphene and its composites,4,5 metal oxide hybrids,6,7 layered hydroxides and oxides8–10 and layered metal chalcogenides11–14 have been frequently investigated as the supercapacitor electrode materials, because they offer the advantages of more reactive sites, shortened ion diffusion lengths and more efficient electron pathways and provide an improved cycle life. Numerous research studies on electrode materials have been dedicated to increase energy density without compromising their power density or long cycle life with excellent properties. Therefore, numerous works have been reported on the synthesis of novel electrode materials.Recently, transition metal chalcogenides (TMCs) have been extensively investigated by researchers due to their higher electrical conductivity (than the oxides), unique electronic structure, 2D sheet-like morphology stacked together by weak van der Waals forces, high surface area and the multivalent oxidation states of transition metal ions, which is analogous to graphite.15 TMCs can be denoted as ABx (where A is any metal ions of group IV, V and VI transition elements, B is a chalcogen S, Se and Te, and x represents the multivalent oxidation state) and also provides a very unique physical and chemical properties, which have diverse application in catalysis, phototransistors, DSSC, sensors, wastewater treatment, electronic devices and electrochemical energy storage systems.16–20
In this study, the cobalt selenide have been chosen as a typical TMCs because transition metal cobalt (Co) exhibits a variable oxidation state and moreover the cobalt based compounds such as Co3O4, CoS, CoS2, Co3S4 and Co1−xSx, have been investigated widely for high performance supercapacitors due to their excellent intrinsic properties and excellent electrochemical properties. Se has a lower electronegativity with larger ionic radius compared with the other chalcogenides (e.g. O, S). The outermost orbital electrons of cobalt have weak attraction with selenide, hence the weakly bound electrons provide electroactive reaction sites for redox reaction and also improved the overall kinetics of the electrochemical reaction. Moreover, cobalt selenide is semiconducting nature and possess a lower optical band gap. Hence, it has been widely used very recently in many fields such as catalysis, DSSC and electrochemical energy storage system.21–24 Wang et al. reported at the first, the capacitive and catalytic behavior of polycrystalline Co0.85Se nanotubes.25 However, to the best of our knowledge, very few attempts have been made so far to use cobalt selenide as an electrochemical supercapacitor electrode material26,27 and no data has been reported on the use of cobalt selenide–graphene nanohybrid for the asymmetric supercapacitor application.
In this paper, we reported the synthesis of pure cobalt selenide (CoSe) and cobalt selenide–graphene (CoSe–G) nanohybrid by facile one step hydrothermal process. The structure and morphology were characterized by XRD, Raman spectroscopy and FE-SEM. The electrochemical properties of CoSe and CoSe–G nanohybrid electrode materials were measured in 6 M KOH by cyclic voltammogram, galvanostatic charge–discharge and electrochemical impedance studies. In addition, asymmetric supercapacitor (ASC) was fabricated using the CoSe–G nanohybrid as a positive electrode and activated carbon (AC) as a negative electrode. The assembled ASC achieved a wide potential operating voltage of 1.6 V and showed high specific capacitance, outstanding capacitance retention up to 5000 cycles as well as high energy and power densities.
2. Experimental
2.1 Materials used
All chemical reagents are analytical grade and used as received. Cobalt chloride hexahydrate (CoCl2·6H2O), sodium nitrate (NaNO3), hydrazine hydrate (N2H4·H2O) and N-methyl-2-pyrrolidone (NMP) were purchased from Merck. Graphite flakes (99.5%) were purchased from HIMEDIA. Potassium permanganate (KMnO4) was procured from Sisco research laboratories. Selenium powder (Se) size is 100 mesh and poly(vinylidene fluoride) (PVdF) from Sigma-Aldrich. Activated carbon (Black Pearl® 2000) from Cabot corporation. Deionized water is used throughout the process.2.2 Preparation of CoSe–G nanohybrid
Graphene oxide (GO) was prepared by the oxidation of natural graphite flake (400 mesh) according to the modified Hummer's method.28 The CoSe–G nanohybrid was prepared by a simple and facile hydrothermal method using 1![[thin space (1/6-em)]](https://www.rsc.org/images/entities/char_2009.gif) :
:![[thin space (1/6-em)]](https://www.rsc.org/images/entities/char_2009.gif) 1 molar ratio of CoCl2·6H2O, Se powder and 0.02 g of GO in 50 ml of deionized water. They were mixed uniformly under ultrasonication for 45 min and then 10 ml of hydrazine hydrate was added drop by drop under stirring to react with reaction mixture completely. Hence, the addition of hydrazine does not cause any adverse effect at 120 °C due to non-availability of free hydrazine. After 15 min, the reaction mixture was transferred to the stainless steel Teflon-lined autoclave and heated to 120 °C for 12 h, followed by cooling to room temperature. Finally, the obtained product was washed with deionized water for several times and dried under vacuum at 50 °C for 12 h to get CoSe–G nanohybrid. For comparison, the pure CoSe nanoparticles were prepared without the addition graphene oxide under the same reaction condition.
1 molar ratio of CoCl2·6H2O, Se powder and 0.02 g of GO in 50 ml of deionized water. They were mixed uniformly under ultrasonication for 45 min and then 10 ml of hydrazine hydrate was added drop by drop under stirring to react with reaction mixture completely. Hence, the addition of hydrazine does not cause any adverse effect at 120 °C due to non-availability of free hydrazine. After 15 min, the reaction mixture was transferred to the stainless steel Teflon-lined autoclave and heated to 120 °C for 12 h, followed by cooling to room temperature. Finally, the obtained product was washed with deionized water for several times and dried under vacuum at 50 °C for 12 h to get CoSe–G nanohybrid. For comparison, the pure CoSe nanoparticles were prepared without the addition graphene oxide under the same reaction condition.
2.3 Physical characterization
The structural properties of CoSe nanoparticles and CoSe–G nanohybrid were characterized by X-ray diffraction studies (Rigaku, Ultima IV) with nickel-filtered Cu-Kα radiation in the range of 10° to 80° at an increment of 0.05°. The Raman spectra were recorded by using confocal micro-Raman spectrometer (Renishaw RM 2000) under 20 mW Innova Ar ion laser of 514 nm. The morphologies of prepared CoSe nanoparticles and CoSe–G nanohybrid were observed by using field emission scanning electron microscopy (JSM, JEOL 7600F). The chemical elements were acquired by using energy dispersive X-ray spectroscopy attached to with FE-SEM. High resolution transmission electron microscope (Philips, CM 200). The electrical conductivity of the CoSe and CoSe–G were measured by four probe method at room temperature (Keithley, 2420).2.4 Electrochemical measurements
The electrochemical measurements were performed at ambient temperature in a three electrode configuration using an electrochemical analyzer (VSP, Bio-Logic, France). The working electrode was prepared by mixing 85% of the active material, 10% of Black Pearl carbon as conductive additive and 5% polyvinylidene difluoride (PVdF) in N-methyl pyrrolidone (binder) were used to form a slurry. This slurry was coated on 1 × 1 cm2 stainless steel sheet and vacuum dried at 70 °C for 12 h. Active material coated on a stainless steel, a platinum electrode and a saturated calomel electrode (SCE) were served as the working, counter and reference electrodes, respectively. The mass loading of both CoSe and CoSe–G electrodes were about 5.0 mg. All electrochemical measurements were carried out in 6 M KOH aqueous solution. Cyclic voltammetry (CV) was carried out in the potential window of −0.2 to +0.4 V at different scan rates (5, 10, 25, 50 and 100 mV s−1). The galvanostatic charge–discharge studies were carried out in the potential range of −0.2 to +0.4 V at different current densities of 1, 3, 5, 7 and 10 A g−1. Electrochemical impedance studies were carried out in the frequency range of 100 kHz to 1 mHz by imposing a sinusoidal alternating current amplitude of 10 mV. The asymmetric supercapacitor (ASC) was fabricated by using CoSe–G nanohybrid as the positive electrode, an activated carbon as the negative electrode and the electrospun PVdF membrane containing 6 M KOH as the separator as well as the electrolyte. The cyclic voltammetry and galvanostatic charge–discharge studies were performed for CoSe–G∥AC based ASC and the specific capacitance, energy and power densities were calculated based on the mass of cathode and anode materials.3. Results and discussion
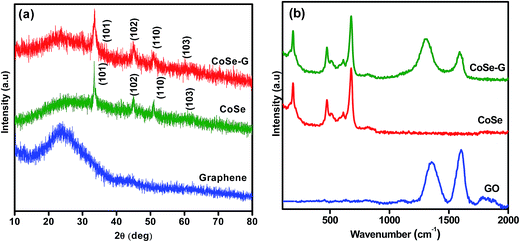
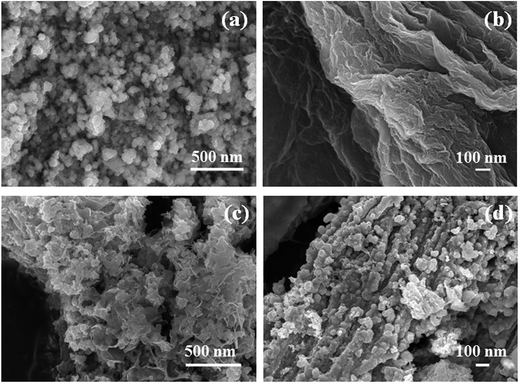
The XRD patterns of as-synthesized CoSe nanoparticles and CoSe–G nanohybrid are shown in Fig. 1a. The XRD pattern of CoSe is in good agreement with the reported literature.29 The major diffraction peaks at around 33.62°, 45.43° and 51.23° correspond to (101), (102) and (110) planes, respectively of hexagonal phase with a space group (P63/mmc). No other impurity peaks appear in the XRD pattern which indicates the absence of metallic cobalt and selenide.30 It revealed that the hydrothermal method is a simple and facile approach to get pure hexagonal cobalt selenide. The broad peak appearing over 2θ = 19–40° is due to disordered graphene in the nanohybrid. From the major peak at 2θ = 33.62°, the mean crystallite size for CoSe and CoSe–G nanohybrid and are found to be 28.16 nm and 13.41 nm, respectively. The CoSe–G with smaller CoSe nanoparticles (∼14 nm) will offer a high assessable surface that enhance the electrocatalytic activity for charge storage. The Raman spectra of graphene oxide (GO), pristine CoSe nanoparticles and CoSe–G are shown in Fig. 1b. In Raman spectra of GO, the D band at around 1340 cm−1 and G band at around 1582 cm−1 are observed and the ID/IG ratio was found to be 0.70. The Raman modes of CoSe are observed at around 160 cm−1, 477 cm−1 and 690.74 cm−1.31,32 In Raman spectra of CoSe–G nanohybrid, the D band at around 1340 cm−1 and G band at around 1582 cm−1 are observed. They are characteristic peaks for graphene. The higher ID/IG ratio for CoSe–G (1.40) than graphene oxide is attributed to its high degree of defects that arises due to the removal of oxygen functional group in the graphene oxide sheets during reduction process.33 It is also observed that there is no shift in the peaks of CoSe in CoSe–G nanohybrid. It indicates that there is no phase change in the CoSe nanoparticles due to the formation of CoSe–G nanohybrid.FE-SEM image of CoSe nanoparticles and CoSe–G nanohybrid are shown in Fig. 2. Fig. 2a shows that CoSe nanoparticles are spherical in shape with an average particles size of ∼47 nm. Fig. 2b shows that GO possesses planar sheet structure with corrugation and scrolling which result bending of 2D structure is thermodynamically more favourable. Therefore, both the nanovoids and nanocavities would exist in the scrolled graphene nanosheets.34 The thickness of the GO sheet is found to be ∼8 to 10 nm. Fig. 2c and d depicts that in CoSe–G nanohybrid, the spherical-shaped CoSe nanoparticles are distributed homogenously on 2D graphene sheets without any aggregation that provides a large active surface for OH− ions diffusion and thereby accelerates its redox reaction.
Energy dispersive X-ray analysis (EDX) of CoSe nanoparticles and CoSe–G nanohybrid is shown in Fig. S1 (ESI†). Fig. S1a† revealed that the Co and Se species are present in the CoSe nanoparticles and the weight percentages of Co and Se are found to be 47.62 and 52.38, respectively and hence its corresponding stoichiometric ratio is found to be Co0.9Se. Fig. S1b† revealed that the C, Co and Se species are present in the CoSe–G nanohybrid and the weight percentages of C, Co and Se are found to be 32.38, 31.69 and 34.72, respectively and hence the corresponding weight ratio of CoSe![[thin space (1/6-em)]](https://www.rsc.org/images/entities/char_2009.gif) :
:![[thin space (1/6-em)]](https://www.rsc.org/images/entities/char_2009.gif) graphene is 1
graphene is 1![[thin space (1/6-em)]](https://www.rsc.org/images/entities/char_2009.gif) :
:![[thin space (1/6-em)]](https://www.rsc.org/images/entities/char_2009.gif) 0.50.
0.50.
Fig. 3 shows the HR-TEM images of CoSe nanoparticles and CoSe–G nanohybrid. It is observed from the Fig. 3a that the pure CoSe nanoparticles get agglomerated and they are spherical in shape with an average diameter of 14 nm. The image of CoSe–G nanohybrid (Fig. 3b) shows that CoSe nanoparticles were homogeneously distributed on the graphene nanosheets. The functional groups in the graphene oxide could serve as active sites for the nucleation of CoSe nanoparticles and these interactions led to homogenous immobilization of CoSe nanoparticles onto the graphene. Thus, during the hydrothermal reaction, CoSe nanoparticles will grow on the surface of graphene oxide without any agglomeration.35Fig. 3c shows the clear lattice fringes that substantiate good crystallinity of CoSe–G nanohybrid. The lattice fringe spacings of 2.69 Å, 2.02 Å, 1.80 Å and 1.53 Å correspond to the (101), (102), (110) and (103) planes of hexagonal CoSe, respectively and interlayer spacing of 3.45 Å ascribed the few layers of graphene sheets (Fig. 3c). The SAED of CoSe–G nanohybrid (Fig. 3d), the rings are indexed as (101), (102), (110) and (103) of the hexagonal CoSe which indicate that the CoSe nanoparticles on the graphene sheets are polycrystalline nature.
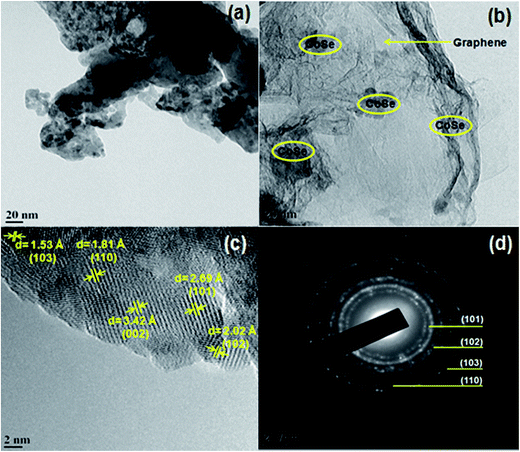 | ||
| Fig. 3 TEM image of (a) CoSe nanoparticles, (b) CoSe–G nanohybrid, (c) CoSe–G nanohybrid; and (d) SAED of the image of CoSe–G nanohybrid. | ||
The electrical conductivities of CoSe and CoSe–G were measured by four probe (Keithley, Model: 2420) resistivity method at room temperature. The measured electrical conductivity values of CoSe and CoSe–G are 0.503 × 10⁻⁴ S cm−1 and 7.024 × 10⁻² S cm−1, respectively. The increase in electrical conductivity of CoSe–G is due to the conductive pathway provided by graphene nanosheets. In the case of pure CoSe nanoparticles, there is no conduction among them, which reduces the charge transport kinetics. The incorporation of graphene nanosheets link the CoSe nanoparticles and thereby improve the electrical conduction among the CoSe nanoparticles and make the CoSe–G nanohybrid as a versatile high performance electrocatalyst for supercapacitors. Thus, CoSe–G nanohybrid with good electrical conductivity, accelerate the electrochemical reaction kinetics for charge storage even at high current density.
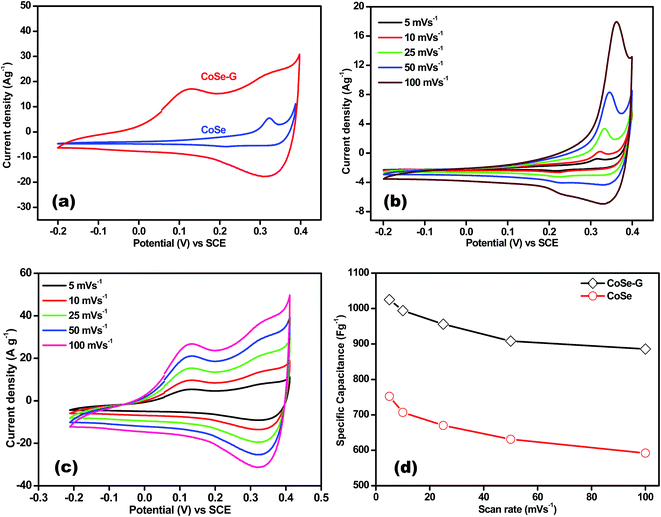
Electrochemical performance of CoSe and CoSe–G nanohybrid electrodes is evaluated in a three-electrode system using 6 M KOH as the electrolyte. Fig. 4a shows the comparison CV curves of CoSe–G and CoSe measured in the potential range of −0.2 to +0.4 V (vs. SCE) at the scan rate of 25 mV s−1. The integral area under the CV curves is directly proportional to the specific capacitance (Csp); therefore the Csp of CoSe–G is larger when compared to pure CoSe electrode. The average specific capacitance of CoSe–G is found to be 949 F g−1 which is a factor of ∼1.7 higher than that of pure CoSe at the scan rate of 25 mV s−1. The CoSe–G electrode shows a much higher current density than that of pure CoSe electrode with a similar mass loading, indicating that the substantial enhancement of Csp is due to the presence of graphene.36 The cyclic voltammetry (CV) curves of graphene electrode at various scan rates (5–100 mV s−1) are shown in Fig. S2 (ESI†) electrical double-layer capacitance behavior is observed. The cyclic voltammetry (CV) curves of CoSe electrode at various scan rates (5–100 mV s−1) are shown in Fig. 4b. Its CV curves clearly reveal a typical pseudocapacitive characteristic which differs from the rectangular shape of CV curve. A symmetrical redox peak is observed in the CV curves at all the scan rates, which attributed to the reversible electron transfer process by OH− ions in KOH electrolyte.37 At increasing scan rate the cathodic/anodic peak current shifts toward higher/lower voltage, which indicate that the faradaic reaction is a hydroxyl-ion diffusion controlled process. The possible reaction mechanism is proposed for the faradaic redox reaction is as follow;38,39
| CoSe + OH− ↔ CoSeOH + e− | (1) |
Fig. 4c shows the CV curve of CoSe–G electrode at various scan rates (5–100 mV s−1). The CoSe–G nanohybrid electrode possesses a non-ideal rectangular shape of CV curve indicating both pseudocapacitance and electrical double-layer capacitance behaviour of CoSe and graphene, respectively. The enhanced current density of CoSe–G electrode is due to the CoSe nanoparticles embedded on the surface of graphene nanosheets which provide more accessible electroactive area and also improve the connection between the CoSe nanoparticles. This peak broadening in the case of CoSe–G electrode ensures more amount of charge storage during cathodic and anodic scans. It also shows that the current density increased with the scan rate implies better electrochemical faradic redox reversibility occurred within the electroactive CoSe–G electrode.40,41 Thus, the CoSe–G electrode shows a good reversibility by maintaining the shape of CV curves even at the higher scan rate.
The specific capacitance (Csp) of CoSe and CoSe–G electrodes with different scan rates are summarized in Fig. 3d, according to the following equation:42
 | (2) |
 (A V) is the integral area under the CV curve gives the charge stored during cathodic and anodic scans, ΔV (V) is the applied potential window, v (mV s−1) is the scan rate and m (g) is the mass of active electrode material. The specific capacitance values for CoSe electrode at different scan rates of 5, 10, 25, 50 and 100 mV s−1 are found to be 723, 626, 558, 507, and 446 F g−1, respectively. Similarly, the specific capacitance values for CoSe–G electrode at different scan rates of 5, 10, 25, 50 and 100 mV s−1 are found to be 1037, 1010, 949, 832 and 764 F g−1, respectively. In comparison, only 26% loss in specific capacitance value for CoSe–G electrode from the scan rate of 5–100 mV s−1 is observed, whereas for the CoSe electrode the specific capacitance loss is 38% high under the same scan rate (Fig. 4d). It revealed that CoSe–G electrode shows a higher performance even at the higher scan rate is due to the CoSe nanoparticles which provide an electroactive surface to OH− ions for the redox reaction as well as an active participation of graphene sheets in the absorption/desorption of the maximum number of OH− ions at electrode–electrolyte interface that decreases the resistance of ions transport. These results suggest efficient charge storage occurs in the CoSe–G electrode rather than the pure CoSe.
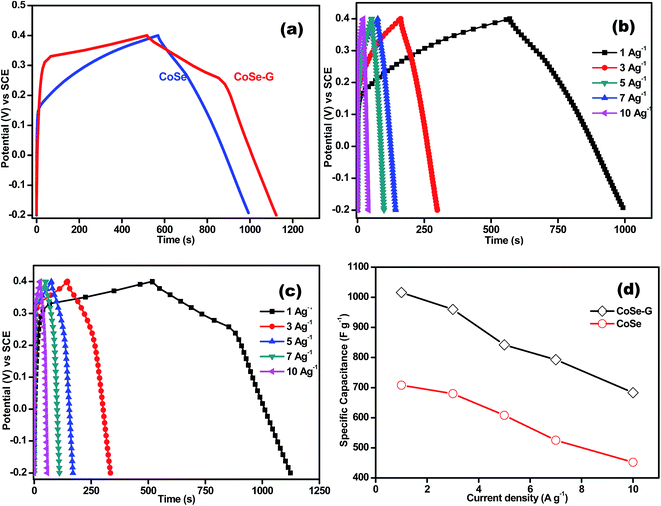
Fig. 5a shows comparative galvanostatic charge–discharge (GCD) curves of CoSe and CoSe–G electrodes in the potential range of −0.2 to +0.4 V (vs. SCE) at a current density of 1 A g−1. Both the discharge curves show a nonlinearity irrespective of the applied current density. But, the CoSe–G electrode shows more prominent potential variation with time and also confirming that the capacitance includes not only EDLC but also pseudocapacitance characteristic of the electrode material which is due to electrochemically reversible redox reaction at the electrode–electrolyte interface. Fig. 5b demonstrates the typical galvanostatic charge–discharge curves of CoSe electrode at various current densities. The shape of discharge curve is almost triangular with symmetrical shape indicating the good pseudocapacitive behaviour of CoSe electrode. The peak in CV curve of CoSe is well consistent with the plateau in the discharge curve implying the existence of faradic processes.43,44 However, the CoSe electrode manifests more prominent potential drop (IR drop) at the initial stage of the discharge process, which is mainly due to the internal resistance of CoSe electrode.45
The galvanostatic charge–discharge curves of CoSe–G electrode at different current densities are shown in Fig. 5c. The discharge curve of CoSe–G consists of two different curvatures in the total potential range, showing dual nature double-layer capacitance and pseudocapacitance behaviour. The potential curve varies linearly with time at the beginning of charging, which is caused by the charge separation taking place between the electrode and electrolyte interface (double-layer capacitance behaviour). The slow discharge rate in the voltage range of 0.40 to 0.25 V attributed by both double-layer and pseudocapacitance, whereas the relatively fast discharge rate in the voltage ranges of 0.25 to −0.20 V originates from the double-layer capacitance.46 During the slow discharge rate, the potential curve slope varies with time (flat nature) which originates from the electrochemical adsorption/desorption or surface redox reactions at the electrode–electrolyte interface (pseudocapacitance behavior). Hence the pseudocapacitance electrode behaves like a non-ideally polarizable electrode, resulting in flat nature of charge–discharge process at certain potential windows. The linearity in potential axis during faster discharge rate from 0.25 V to −0.20 V, which also reflects in the slight narrowing of voltammogram profiles observed in Fig. 4c. In addition, the IR drops on all the curves are not obvious, representing the lower internal resistance and better contact between the electrode materials and the collectors.
The Csp (F g−1) is specific capacitance value at different current densities is calculated by the following equation;47
 | (3) |
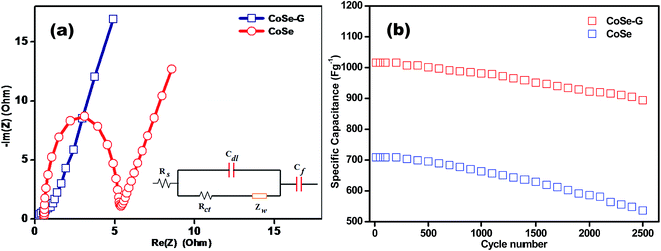
In order to evaluate the internal resistances, kinetics and electrochemical characteristics of CoSe and CoSe–G electrode, the electrochemical impedance measurements are carried and their corresponding Nyquist plots are shown in Fig. 6a. However, the Nyquist plot of CoSe electrode shows a well established semi-circle in the higher frequency region followed by a straight line in the lower frequency region, but the Nyquist plot of CoSe–G electrode mainly consists of depressed semicircle in the high frequency range followed by a straight line in the low frequency range is shown in Fig. S3 (ESI†). At the high frequency, the CoSe electrode shows an incomplete semi-circle, which is responsible for the redox reactions at the electrode–electrolyte interface. However, the CoSe–G electrode exhibits a depressed semi-circle due to the presence of graphene in the hybrids that reduced the internal resistance. The resultant electrochemical impedance data simulated by an equivalent circuit is shown as an inset in Fig. 6a, which can be fitted by the components of resistance, impedance and capacitance such as solution resistance (Rs), charge transfer resistance (Rct), the Warburg impedance (Zw), pseudocapacitance (CF) and double layer capacitance (Cdl). Rs can be obtained by the high frequency intercept on the real axis (Z′) which contains electrolyte resistance, intrinsic resistance of the substrate and contact resistance between electrode/current collector interface. It can be observed that the Rs values are 0.8 Ω and 0.09 Ω for the CoSe and CoSe–G electrodes, respectively. The corresponding Rct value of CoSe and CoSe–G electrodes are 4.60 Ω and 0.98 Ω, respectively. The lower charge-transfer resistance is shown by CoSe–G electrode primarily due to highly ordered CoSe on the graphene sheets, the CoSe–G nanohybrid facilitates a shorter transport and diffusion pathway for the OH− ions between the electrode–electrolyte interface. Hence, CoSe–G nanohybrid electrode can manifest a lower charge transfer resistance and ionic diffusion resistance.
The superior cycle stability and long service life are more important conditions for high performance supercapacitors. In order to evaluate the cycle stability of CoSe and CoSe–G electrodes, a continuous charge–discharge process is carried out under a constant current density of 1 A g−1 for 2500 cycles are shown in Fig. 6b. CoSe electrode shows only 74% capacitance retention after 2500 cycles, but CoSe–G electrode retained 88% of its initial capacitance even after 2500 charge–discharge cycles. The improved cycle stability is derived from the synergistic effect of graphene and CoSe. The ordered CoSe on graphene provides facile strain relaxations, which allow to reducing damage during the continuous charge–discharge process. Therefore, the CoSe–G electrode exhibited an enhanced cycle stability compared to CoSe electrode.
To investigate the capacitive performance of CoSe–G electrode for practical application, ASC have been fabricated by employing CoSe–G as the positive electrode, activated carbon (AC) as the negative electrode and electrospun PVdF membrane containing 6 M KOH as the separator as well as electrolyte (denoted as CoSe–G∥AC) is shown in Fig. S4 (ESI†). To determine the best operating potential of CoSe–G∥AC, Fig. 7a shows the CV curves of CoSe–G and AC at the scan rate of 10 mV s−1, the activated carbon based electrode could be polarized up to −1.2 V and the prepared CoSe–G based electrode could be polarized upto +0.4 V without any interference from the oxygen and hydrogen evolution, implying the maximum operating potential window of 1.6 V. Therefore the fabricated CoSe–G∥AC based ASC can be extended up to 1.6 V. To obtain the maximum performance of ASC, the optimum mass loading of the electrodes have been calculated based on the charge balanced theory.49 Therefore, based on the potential window and the specific capacitance of CoSe–G and AC electrode, the mass loading optimization of ASC depends on the charge conversion equation (q+ = q−);
| (Csp × ΔV × m)c = (Csp × ΔV × m)a | (4) |
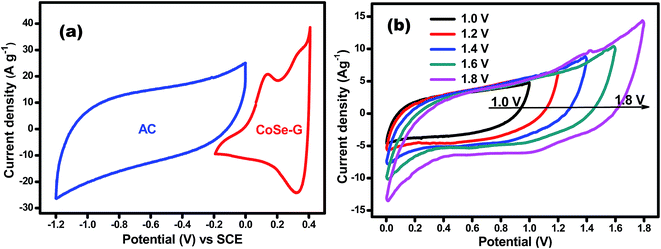 | ||
| Fig. 7 (a) CV curves of AC and CoSe–G electrodes at the scan rate of 10 mV s−1; (b) CV curves of ASC device in different potential windows at 10 mV s−1. | ||
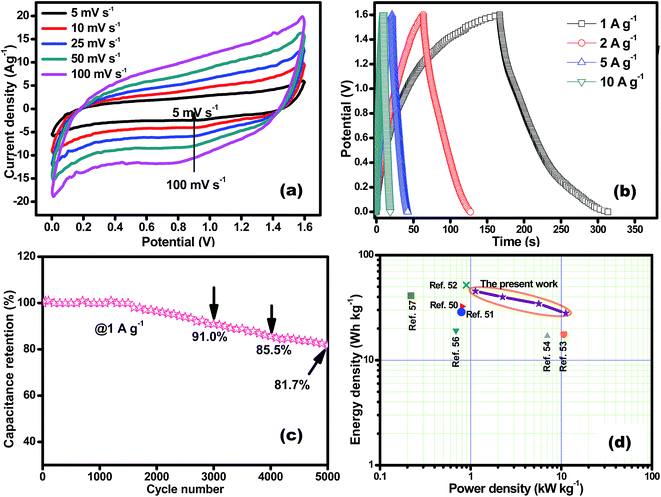
The performance of CoSe–G∥AC ASC is investigated by cyclic voltammetry and galvanostatic charge–discharge. The CV curve of ASC is measured in the potential range of 1.6 V at different scan rates from 5 to 100 mV s−1 are shown in Fig. 8a. The CV profile shows a relatively rectangular shape at a high operating potential indicating a nearly ideal supercapacitor behaviour and moreover the shape of CV curve is maintained even at a higher scan rate of 100 mV s−1, demonstrated the good rate capability of CoSe–G∥AC ASC. Galvanostatic charge–discharge studies are performed at various current densities from 1 to 10 A g−1 within a potential window of 1.6 V are shown in Fig. 8b. The triangular-shaped curve is observed for the GCD profile and the charge–discharge curves are almost symmetrical in nature attributed to the excellent capacitive behaviour of the device. The Csp of ASC is evaluated using the eqn (3) based on the total mass of the active materials of both the electrodes, which are found to be 128, 113, 97 and 79 F g−1 at various current densities 1, 2, 5 and 10 A g−1, respectively. Moreover, the Csp of ASC is retained 61% of the initial value upon 10 times increased the current density. The ASC exhibits very small IR drop is observed for 1 A g−1 is 20 mV, even at high current density 10 A g−1 is 140 mV, which confirms the excellent power performance of CoSe–G∥AC. Fig. 8c shows the cyclic stability test for CoSe–G∥AC ASC is carried out by continuous galvanostatic charge–discharge at a current density of 1 A g−1. The ASC shows 100% of its initial specific capacitance even after 1500 continuous charge–discharge cycles and then a gradual decrease in the specific capacitance is observed after the 3000 cycles and retains 91% of its initial specific capacitance value. After 5000 continuous charge–discharge cycles, the device shows only 81.7% of its retention, indicating the stable cycle life. The energy (E) and power densities (P) of CoSe–G∥AC ASC are calculated according to the eqn (5) and (6) and Fig. 8d shows the Ragone plot (relation between energy and power densities):
 | (5) |
 | (6) |
The CoSe–G∥AC ASC can deliver a maximum energy and power densities of 45.5 W h kg−1 and 11.2 kW kg−1 and a minimum of 28 W h kg−1 and 1.1 kW kg−1, respectively, which indicates that the ASC can provide a maximum energy density without compromising the power density. The CoSe–G∥AC ASC has superior energy and power densities than that of other metal-chalcogenides based ASCs in aqueous electrolyte, such as NiTe∥AC (33.6 W h kg−1 at 807.1 W kg−1),50 3D-CoS/graphene∥AC (29 W h kg−1 at 800 W kg−1),51 NiCo2S4/MWCNT∥r-GO (51.8 W h kg−1 at 865 W kg−1),52 NiS/rGO∥nanoporous carbon (17 W h kg−1 at 10 kW kg−1),53 Mo9Se11∥AC (42 W h kg−1 at 960 W kg−1),54 MWCNT/NiS∥graphene (17 W h kg−1 at 7 kW kg−1),55 Ni3S2/MWCNT∥AC (19.8 W h kg−1 at 798 W kg−1),56 NiCo2S4∥AC (41.4 W h kg−1 at 23.8 W kg−1).57 The high energy and power densities of CoSe–G∥AC ASC could be assigned to (i) a synergistic effect between graphene and CoSe nanoparticles in the hybrid and (ii) a well developed large interfacial contact between the interfaces. Therefore, the newer CoSe–G∥AC based ASC offers a potential energy storage applications.
4. Conclusion
CoSe–G nanohybrid is successfully prepared by a facile one step hydrothermal method. It delivered a higher specific capacitance than CoSe. The CoSe–G has improved cycling stability even after 2500 charge–discharge cycles. The significant improvement in CoSe–G electrode is mainly due to its tailored properties, offers high conductivity, good adhesion between CoSe and the current collector, structural integrity, and good wettability. An asymmetric supercapacitor is fabricated by using CoSe–G and pairing with activated carbon. A potential window of 1.6 V has been achieved with an aqueous electrolyte. The ASCs could deliver a high energy density of 45.5 W h kg−1 at a high power density of 1.1 kW kg−1 and retain 81.7% of its initial specific capacitance even after 5000 continuous charge–discharge cycles. It is concluded that the synergistic effect between graphene and CoSe combines the double layer and faradaic contributions, which in turns improved the overall electrochemical properties of CoSe–G nanohybrid. This CoSe–G nanohybrid could be a promising and an efficient electrode for ASC.Acknowledgements
The authors gratefully acknowledge the Central Instrumentation Facility (CIF), Pondicherry University for providing the instruments facility. One of the authors, Mr BK is grateful to the UGC, New Delhi for providing fellowship under NFOBC scheme.Notes and references
- S. Chen, W. Xing, J. Duan, X. Hu and S. Z. Qiao, J. Mater. Chem. A, 2013, 1, 2941–2954 RSC
.
- D. P. Dubal, O. Ayyad, V. Ruiz and P. Gómez-Romero, Chem. Soc. Rev., 2015, 44, 1777–1790 RSC
.
- S. W. Lee, B. M. Gallant, H. R. Byon, P. T. Hammond and Y. Shao-Horn, Energy Environ. Sci., 2011, 4, 1972 RSC
.
- L. Wang, D. Wang, X. Y. Dong, Z. J. Zhang, X. F. Pei, X. J. Chen, B. Chen and J. Jin, Chem. Commun., 2011, 47, 3556–3558 RSC
.
- S. Li, D. Wu, C. Cheng, J. Wang, F. Zhang, Y. Su and X. Feng, Angew. Chem., 2013, 52, 12105–12109 CrossRef CAS
.
- Y. Liu and I. Zhitomirsky, J. Power Sources, 2015, 284, 377–382 CrossRef CAS
.
- M. Jing, C. Wang, H. Hou, Z. Wu, Y. Zhu, Y. Yang, X. Jia, Y. Zhang and X. Ji, J. Power Sources, 2015, 298, 241–248 CrossRef CAS
.
- F. Shi, L. Li, X. Wang, C. Gu and J. Tu, RSC Adv., 2014, 4, 41910–41921 RSC
.
- H. B. Li, M. H. Yu, F. X. Wang, P. Liu, Y. Liang, J. Xiao, C. X. Wang, Y. X. Tong and G. W. Yang, Nat. Commun., 2013, 4, 1894 CrossRef CAS
.
- Y. Tang, Y. Liu, S. Yu, Y. Zhao, S. Mu and F. Gao, Electrochim. Acta, 2014, 123, 158–166 CrossRef CAS
.
- J. Feng, X. Sun, C. Wu, L. Peng, C. Lin, S. Hu and J. Yang, J. Am. Chem. Soc., 2011, 133, 17832–17838 CrossRef CAS
.
- B. Qu, Y. Chen, M. Zhang, L. Hu, D. Lei, B. Lu, Q. Li, Y. Wang, L. Chen and T. Wang, Nanoscale, 2012, 4, 7810–7816 RSC
.
- L. Zhang, H. Bin Wu and X. W. Lou, Chem. Commun., 2012, 48, 6912–6914 RSC
.
- S. Ratha and C. S. Rout, ACS Appl. Mater. Interfaces, 2013, 5, 11427–11433 CrossRef CAS
.
- H. Wang, H. Feng and J. Li, Small, 2014, 10, 2165–2181 CrossRef CAS
.
- C. Jung, S. M. Kim, H. Moon, G. Han, J. Kwon, Y. K. Hong, I. Omkaram, Y. Yoon, S. Kim and J. Park, Sci. Rep., 2015, 5, 15313 CrossRef CAS
.
- K.-J. Huang, Y.-J. Liu, J.-Z. Zhang, J.-T. Cao and Y.-M. Liu, Biosens. Bioelectron., 2015, 67, 184–191 CrossRef CAS
.
- C. Tsai, K. Chan, J. K. Nørskov and F. Abild-Pedersen, Catal. Sci. Technol., 2015, 5, 246–253 RSC
.
- Z. Wang, H. Xu, Z. Zhang, X. Zhou, S. Pang and G. Cui, Chin. J. Chem., 2014, 32, 491–497 CrossRef CAS
.
- S. K. Balasingam, J. S. Lee and Y. Jun, Dalton Trans., 2015, 44, 15491–15498 RSC
.
- G. Zhang, S. Zang, Z.-A. Lan, C. Huang, G. Li and X. Wang, J. Mater. Chem. A, 2015, 3, 17946–17950 RSC
.
- D. Kong, H. Wang, Z. Lu and Y. Cui, J. Am. Chem. Soc., 2014, 136, 4897–4900 CrossRef CAS PubMed
.
- I.-T. Chiu, C.-T. Li, C.-P. Lee, P.-Y. Chen, Y.-H. Tseng, R. Vittal and K.-C. Ho, Nano Energy, 2016, 22, 594–606 CrossRef CAS
.
- Y. N. Ko, S. H. Choi and Y. C. Kang, ACS Appl. Mater. Interfaces, 2016, 8, 6449–6456 CrossRef CAS
.
- Z. Wang, Q. Sha, F. Zhang, J. Pu and W. Zhang, CrystEngComm, 2013, 15, 5928 RSC
.
- A. Banerjee, S. Bhatnagar, K. K. Upadhyay, P. Yadav and S. Ogale, ACS Appl. Mater. Interfaces, 2014, 6, 18844–18852 CrossRef CAS
.
- H. Peng, G. Ma, K. Sun, Z. Zhang, J. Li, X. Zhou and Z. Lei, J. Power Sources, 2015, 297, 351–358 CrossRef CAS
.
- X. Sun, Z. Liu, K. Welsher, J. T. Robinson, A. Goodwin, S. Zaric and H. Dai, Nano Res., 2008, 1, 203–212 CrossRef CAS
.
- Y. Duan, Q. Tang, B. He, Z. Zhao, L. Zhu and L. Yu, J. Power Sources, 2015, 284, 349–354 CrossRef CAS
.
- Y. H. Shen, Z. P. Zhang, J.-F. Zhao, J.-M. Song, C.-C. Liu, B.-H. Liu, H.-L. Niu, C.-J. Mao and S.-Y. Zhang, CrystEngComm, 2011, 13, 5681–5684 RSC
.
- C. E. M. Campos, J. C. De Lima, T. A. Grandi, K. D. Machado, V. Drago and P. S. Pizani, Solid State Commun., 2004, 131, 265–270 CrossRef CAS
.
- C. E. M. Campos, J. C. De Lima, T. A. Grandi, K. D. Machado and P. S. Pizani, Phys. Rev. B: Condens. Matter Mater. Phys., 2002, 324, 409–418 CrossRef CAS
.
- M. Zhu, X. Li, W. Liu and Y. Cui, J. Power Sources, 2014, 262, 349–355 CrossRef CAS
.
- M. Yeh, L. Lin, L. Chang, Y. Leu and W. Cheng, ChemPhysChem, 2014, 15, 1175–1181 CrossRef CAS
.
- G. Wang, J. Zhang, S. Kuang, S. Liu and S. Zhuo, J. Power Sources, 2014, 269, 473–478 CrossRef CAS
.
- Z. Wu, X.-L. Huang, Z.-L. Wang, J.-J. Xu, H.-G. Wang and X.-B. Zhang, Sci. Rep., 2014, 4, 3669 CrossRef
.
- Z. Wang, X. Li, Y. Yang, Y. Cui, H. Pan, Z. Wang, B. Chen and G. Qian, J. Mater. Chem. A, 2014, 2, 7912–7916 RSC
.
- S.-W. Chou and J.-Y. Lin, J. Electrochem. Soc., 2013, 160, D178–D182 CrossRef CAS
.
- K. Guo, F. Yang, S. Cui, W. Chen and L. Mi, RSC Adv., 2016, 6, 46523–46530 RSC
.
- X. Feng, N. Chen, J. Zhou, Y. Li, Z. Huang, L. Zhang, Y. Ma, L. Wang and X. Yan, New J. Chem., 2015, 39, 2261–2268 RSC
.
- C. Long, T. Wei, J. Yan, L. Jiang and Z. Fan, ACS Nano, 2013, 7, 11325–11332 CrossRef CAS
.
- M. Kumar, A. Subramania and K. Balakrishnan, Electrochim. Acta, 2014, 149, 152–158 CrossRef CAS
.
- X. Xiong, D. Ding, D. Chen, G. Waller, Y. Bu, Z. Wang and M. Liu, Nano Energy, 2015, 11, 154–161 CrossRef CAS
.
- A. Ramadoss, T. Kim, G.-S. Kim and S. J. Kim, New J. Chem., 2014, 38, 2379 RSC
.
- J. Zhang, J. Jiang and X. S. Zhao, J. Phys. Chem. C, 2011, 115, 6448–6454 CrossRef CAS
.
- Y. Liu, Y. Ma, S. Guang, H. Xu and X. Su, J. Mater. Chem. A, 2014, 2, 813–823 RSC
.
- K. Balakrishnan, M. Kumar and A. Subramania, Adv. Mater. Res., 2014, 938, 151–157 CAS
.
- J. Yan, Z. Fan, W. Sun, G. Ning, T. Wei, Q. Zhang, R. Zhang, L. Zhi and F. Wei, Adv. Funct. Mater., 2012, 22, 2632–2641 CrossRef CAS
.
- Z. Tang, C. Tang and H. Gong, Adv. Funct. Mater., 2012, 22, 1272–1278 CrossRef CAS
.
- P. Zhou, L. Fan, J. Wu, C. Gong, J. Zhang and Y. Tu, J. Alloys Compd., 2016, 685, 384–390 CrossRef CAS
.
- J. Shi, X. Li, G. He, L. Zhang and M. Li, J. Mater. Chem. A, 2015, 3, 20619–20626 RSC
.
- P. Wen, M. Fan, D. Yang, Y. Wang, H. Cheng and J. Wang, J. Power Sources, 2016, 320, 28–36 CrossRef CAS
.
- P. R. Jothi, R. R. Salunkhe, M. Pramanik, S. Kannan and Y. Yamauchi, RSC Adv., 2016, 6, 21246–21253 RSC
.
- R. A. Aziz, S. K. Muzakir, I. I. Misnon, J. Ismail and R. Jose, J. Alloys Compd., 2016, 673, 390–398 CrossRef
.
- A. Singh, A. J. Roberts, R. C. T. Slade and A. Chandra, J. Mater. Chem. A, 2014, 2, 16723–16730 RSC
.
- C. Dai, P. Chien, J. Lin, S. Chou, W. Wu, P. Li, K. Wu and T. Lin, ACS Appl. Mater. Interfaces, 2013, 5, 12168–12174 CrossRef CAS
.
- X. Li, Q. Li, Y. Wu, M. Rui and H. Zeng, ACS Appl. Mater. Interfaces, 2015, 7, 19316–19323 CrossRef CAS
.
Footnote |
| † Electronic supplementary information (ESI) available. See DOI: 10.1039/c6ra25078e |
| This journal is © The Royal Society of Chemistry 2017 |

