 Open Access Article
Creative Commons Attribution 3.0 Unported Licence
Combining phosphonic acid-functionalized anchoring ligands with asymmetric ancillary ligands in bis(diimine)copper(I) dyes for dye-sensitized solar cells†
Annika Büttner,
Sven Y. Brauchli,
Raphael Vogt,
Edwin C. Constable and
Catherine E. Housecroft*
Department of Chemistry, University of Basel, Spitalstrasse 51, CH-4056 Basel, Switzerland. E-mail: catherine.housecroft@unibas.ch
First published on 12th January 2016
Abstract
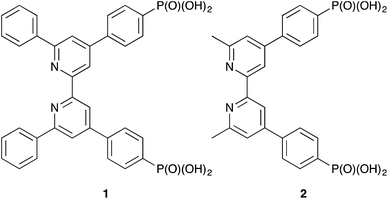
A ‘surfaces-as-ligands’ strategy is used to assemble heteroleptic copper(I) dyes [Cu(Lanchor)(Lancillary)]+ on FTO/TiO2 electrodes for dye-sensitized solar cells (DSCs). The anchoring domain, Lanchor, is either ((6,6′-diphenyl-[2,2′-bipyridine]-4,4′-diyl)bis(4,1-phenylene))bis(phosphonic acid) (1) or ((6,6′-dimethyl-[2,2′-bipyridine]-4,4′-diyl)bis(4,1-phenylene))bis(phosphonic acid) (2). Asymmetric ancillary ligands with a 2,2′-bipyridine metal-binding domain are used to counter the sterically-demanding 6,6′-diphenyl-substitution pattern in anchor 1; Lancillary = 6-methyl-4-phenyl-2,2′-bipyridine (3), 6-methyl-4-(4-bromophenyl)-2,2′-bipyridine (4), 6-methyl-4-(4-methoxyphenyl)-2,2′-bipyridine (5) or 6-methyl-4-(3,4,5-trimethoxyphenyl)-2,2′-bipyridine (6). Solid-state absorption spectra of adsorbed [Cu(1)(Lancillary)]+ and [Cu(2)(Lancillary)]+, and external quantum efficiency (EQE) spectra of DSCs containing these dyes confirm that incorporation of 6,6′-diphenyl-substituted 1 leads to a broadened spectral response at lower energies compared to dyes with anchor 2; dye-loading is higher for [Cu(2)(Lancillary)]+ than for [Cu(1)(Lancillary)]+, and EQEmax is >41% for [Cu(2)(Lancillary)]+ compared to <12% for [Cu(1)(Lancillary)]+. Enhanced values of the short-circuit current density (JSC) are observed on going from anchor 1 to 2, independent of Lancillary. For the series of [Cu(2)(Lancillary)]+ dyes, photoconversion efficiencies (confirmed using four DSCs per dye) vary with Lancillary in the order 3 ∼ 5 > 6 > 4 on the day of DSC assembly, and 5 > 3 ∼ 6 > 4 after a week. The best performing DSCs achieve efficiencies of ∼37% relative to N719 set at 100%.
Introduction
Since the discovery by Sauvage and coworkers1 that copper(I) sensitizers combined with wide band-gap semiconducting metal oxides such as TiO2 or ZnO could be used for photoconversion, significant progress has been made in the development of homoleptic [Cu(N^N)2]+ and heteroleptic [Cu(N^N)(N^N)′]+ sensitizers (N^N = diimine ligand) in dye-sensitized solar cells (DSCs).2–4 The advantages of copper dyes over conventional ruthenium dyes lie in the Earth abundance and lower cost of copper over ruthenium. However, while photon-to-electrical current conversion efficiencies (η) for ruthenium dyes reach ≈12%,5–7 the efficiencies of DSCs containing copper(I) dyes have only recently surpassed 3% (relative to ≈7.5% for the dye N719 used as a reference).8,9 In an n-type DSC, heteroleptic [Cu(N^N)(N^N)′]+ dyes anchored to TiO2 are preferred to homoleptic dyes because their electronic properties are readily tuned to a ‘push–pull’ design to encourage electron transfer from electrolyte, through the dye to the semiconductor. One ligand (Lanchor) in the heteroleptic dye is designed to anchor the dye to the TiO2 surface, and the second (Lancillary) can be variously functionalized. The exceptional global efficiencies of 4.42% and 4.66% reported by Odobel and coworkers9 were achieved using the heteroleptic [Cu(Lanchor)(Lancillary)]+ dyes shown in Scheme 1 in which both anchoring and ancillary ligands contain 6,6′-substituted 2,2′-bipyridine (bpy) metal-binding domains. The use of bulky mesityl groups in one ligand stabilizes the copper(I) complex with respect to ligand dissociation, permitting isolation of the dye9,10 before TiO2-surface functionalization. In contrast, we have applied the lability of bis(diimine) copper(I) complexes to assemble sensitizers on TiO2 in our ‘surfaces-as-ligands’ approach.11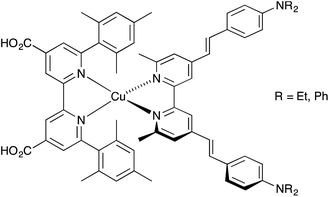 | ||
| Scheme 1 High-efficiency copper(I) dyes in DSCs reported by Odobel and coworkers.9 | ||
As part of our continued efforts to enhance the performance of copper(I) sensitizers, we recently described the use of the phosphonic acid anchor 1 (Scheme 2) which contains phenyl substituents in the 6,6′-positions of the bpy unit.12 We have previously shown that phosphonic acid anchoring groups are preferred over carboxylic acids in copper(I) dyes,13,14 and the 6,6′-diphenyl substituents in 1 not only help to shield the copper(I) centre but also improve light absorption towards the red-end of the visible spectrum.15 One of the major hurdles to overcome with copper(I) dyes is broadening their spectral responses. Comparisons of DSC performances of dyes with anchor 1 or 2 (the 6,6′-dimethyl analogue of 1, Scheme 2) and common ancillary ligands which contained 6,6′-disubstituted bpy units confirmed 2 to be the preferred anchor.12 We observed12 that dyes with anchor 1 bleached in the presence of I−/I3− electrolyte or iodide ion. We have now investigated these observations further using asymmetrical ancillary ligands 3–6 (Scheme 3) to eliminate possible effects of steric crowding in the copper(I) bis(diimine) coordination sphere when both ligands are 6,6′-disubstituted.
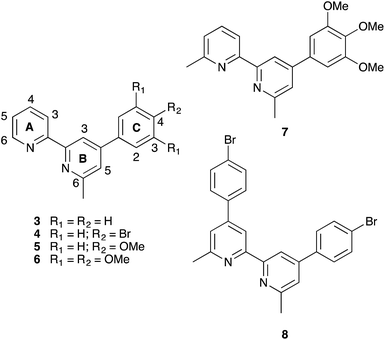 | ||
| Scheme 3 Structures of asymmetrical ancillary ligands 3–6 with atom labelling for NMR assignments, and of related ligands 7 and 8. | ||
Experimental
General
1H and 13C NMR spectra were recorded on a Bruker Avance III-500 or 400 MHz NMR spectrometer; chemical shifts were referenced to residual solvent peaks with respect to δ(TMS) = 0 ppm. Solution and solid state absorption spectra were recorded using a Cary 5000 spectrophotometer. Electrospray ionization (ESI) mass spectra were recorded on a Bruker Daltonics Inc. microflex instrument.Compounds 3a,16 4a,17 5a,16 6a18 and 1-(2-oxopropyl)pyridinium chloride,19 have previously been reported, and [Cu(NCMe)4][PF6] was prepared as described in the literature.20 The dye N719 was purchased from Solaronix. The syntheses of compounds 1, 3–6 are reported in the ESI.†
[Cu(3)2][PF6]
Compound 3 (0.500 g, 2.03 mmol) and [Cu(NCMe)4][PF6] (0.378 g, 1.02 mmol) were dissolved in MeCN (25 mL) and stirred overnight (≈15 h) at room temperature. The solution was concentrated under vacuum and Et2O (25 mL) was added. As no precipitate formed, the solution was filtered solvent removed from the filtrate under vacuum. [Cu(3)2][PF6] was isolated as a dark red-orange solid (1.19 g, 1.70 mmol, 83.7%). 1H NMR (500 MHz, CD2Cl2) δ/ppm 8.55 (dd, J = 5.0, 1.6 Hz, 2H, HA6), 8.45 (d, J = 8.1 Hz, 2H, HA3), 8.38 (d, J = 1.8 Hz, 2H, HB3), 8.13 (td, J = 7.6, 1.6 Hz, 2H, HA4), 7.84 (m, 4H, HC2), 7.71 (d, J = 1.9 Hz, 2H, HB5), 7.59 (m, 8H, HA5+C3+C4), 2.37 (s, 6H, HMe). 13C NMR (126 MHz, CD2Cl2) δ/ppm 158.2 (CB6), 153.0 (CA2/B2), 152.4 (CA2/B2), 151.1 (CB4), 149.2 (CA6), 138.6 (CA4), 137.6 (CC1), 130.5 (CC4), 129.9 (CC3), 127.7 (CC2), 126.8 (CA5), 124.3 (CB5), 122.6 (CA3), 117.7 (CB3), 25.7 (CMe). ESI-MS m/z 555.2 [M − PF6]+ (calc. 555.2). UV-VIS (see text). Found C 58.39, H 4.37, N 8.35; C34H28CuF6N4P requires C 58.24, H 4.03, N 7.99%.[Cu(4)2][PF6]
The method was as for [Cu(3)2][PF6] but starting with ligand 4 (0.350 g, 1.08 mmol) and [Cu(NCMe)4][PF6] (0.201 g, 0.540 mmol). [Cu(4)2][PF6] was isolated as a dark red-orange solid (0.835 g, 0.972 mmol, 90.0%). 1H NMR (500 MHz, CD2Cl2) δ/ppm 8.54 (d, J = 4.6 Hz, 2H, HA6), 8.46 (d, J = 8.1 Hz, 2H, HA3), 8.35 (s, 2H, HB3), 8.14 (t, J = 7.3 Hz, 2H, HA4), 7.71 (m, 8H, HC2+C3), 7.67 (s, 2H, HB5), 7.59 (m, 2H, HA5), 2.35 (s, 6H, HMe). 13C NMR (126 MHz, CD2Cl2) δ/ppm 157.9 (CB6), 152.3 (CA2), 152.0 (CB2), 149.3 (CB4), 148.8 (CA6), 138.1 (CA4), 136.0 (CC1), 132.6 (CC3), 128.8 (CC2), 126.4 (CA5), 124.4 (CC4), 123.6 (CB5), 122.1 (CA3), 116.9 (CB3), 25.2 (CMe). ESI-MS m/z 713.0 [M − PF6]+ (calc. 713.0). UV-VIS (see text). Found C 47.59, H 3.37, N 6.78; C34H26Br2CuF6N4P requires C 47.54, H 3.05, N 6.52%.[Cu(5)2][PF6]
The method was as for [Cu(3)2][PF6] but starting with 5 (0.500 g, 1.81 mmol) and [Cu(NCMe)4][PF6] (0.337 g, 0.905 mmol). [Cu(5)2][PF6] was isolated as a dark red-orange solid (1.16 g, 1.52 mmol, 84.2%). 1H NMR (500 MHz, CD2Cl2) δ/ppm 8.53 (d, J = 4.9 Hz, 2H, HA6), 8.44 (d, J = 8.1 Hz, 2H, HA3), 8.34 (s, 2H, HB3), 8.12 (m, 2H, HA4), 7.80 (d, J = 8.4, 4H, HC2), 7.66 (s, 2H, HB5), 7.57 (m, 2H, HA5), 7.11 (d, J = 8.4 Hz, 4H, HC3), 3.90 (s, 6H, HOMe), 2.33 (s, 6H, HMe). 13C NMR (126 MHz, CD2Cl2) δ/ppm 161.9 (CC4), 158.0 (CB6), 153.2 (CA2), 152.3 (CB2), 150.5 (CB4), 149.2 (CA6), 138.5 (CA4), 129.6 (CC1), 129.0 (CC2), 126.7 (CA5), 123.6 (CB5), 122.5 (CA3), 117.0 (CB3), 115.4 (CC3), 56.1 (COMe), 25.8 (CMe). ESI-MS m/z 615.2 [M − PF6]+ (calc. 615.2). UV-VIS (see text). Found C 55.43, H 4.37, N 7.60; C36H32CuF6N4O2P requires C 55.49, H 4.40, N 7.19%.[Cu(6)2][PF6]
A solution of [Cu(NCMe)4][PF6] (0.716 g, 1.92 mmol) in CH2Cl2 (5–10 mL) was added dropwise to a solution of 6 (1.29 g, 3.84 mmol) in CH2Cl2 (20 mL). The reaction mixture was stirred overnight (15 h) at room temperature. The solution was concentrated under vacuum and Et2O (25 mL) was added; the product did not precipitate, and therefore all the solvent was removed under vacuum and the residue redissolved in MeCN (≈25 mL). Et2O (20 mL) was added, the mixture was filtered and the solvent was removed from the filtrate to yield [Cu(6)2][PF6] as a dark red-orange solid (2.41 g, 2.73 mmol, 71.2%).1H NMR (500 MHz, CD2Cl2) δ/ppm 8.54 (d, J = 4.4 Hz, 2H, HA6), 8.47 (d, J = 8.0 Hz, 2H, HA3), 8.32 (s, 2H, HB3), 8.14 (m, 2H, HA4), 7.66 (s, HB5), 7.58 (m, 2H, HA5), 6.98 (s, 4H, HC2), 3.98 (s, 12H, HOMe–C3), 3.88 (s, 6H, HOMe–C4), 2.36 (s, 6H, HMe). 13C NMR (126 MHz, CD2Cl2) δ/ppm 158.2 (CB6), 154.7 (CC3), 153.0 (CA2), 152.4 (CB2), 151.2 (CB4), 149.3 (CA6), 140.5 (CC4), 138.6 (CA4), 133.2 (CC1), 126.9 (CA5), 124.4 (CB5), 122.7 (CA3), 117.6 (CB3), 105.1 (CC2), 61.1 (COMe–C4), 57.0 (COMe–C3), 25.74 (CMe). ESI-MS m/z 735.2 [M − PF6]+ (calc. 735.2). UV-VIS (see text). Satisfactory elemental analysis was not obtained.DSC fabrication
Commercial TiO2 electrodes (Solaronix Test Cell Titania Electrodes) were washed with miliQ H2O and HPLC grade EtOH, then heated at 450 °C for 30 min; after cooling to ≈80 °C, they were immersed in a DMSO solution of 1 (1.0 mM) and left for 24 h at ambient temperature. The electrodes were then taken out of the solution, washed with DMSO and EtOH and dried in a stream of N2. Each electrode was then soaked in a CH2Cl2 solution of [Cu(Lancillary)2][PF6] (Lancillary = 3–6, 0.1 mM) for 3 days at room temperature. After the electrodes had been taken out of the dye-bath, they were washed with CH2Cl2 and then dried in a stream of N2. N719 (Solaronix) reference electrodes were made by dipping TiO2 electrodes (Solaronix Test Cell Titania Electrodes) in an EtOH solution of N719 (0.3 mM) for 3 days. After removal of the electrodes from the solution, they were washed with EtOH and dried in a stream of N2. Commercial counter electrodes (Solaronix Test Cell Platinum Electrodes) were washed with EtOH, and then heated on a hot plate at 450 °C for 30 min to remove volatile organic impurities.The working and counter-electrodes were combined with thermoplast hot-melt sealing foil (Solaronix Test Cell Gaskets, 60 μm) by heating while pressing them together. The electrolyte (LiI (0.1 M), I2 (0.05 M), 1-methylbenzimidazole (0.5 M), 1-butyl-3-methylimidazolinium iodide (0.6 M) in 3-methoxypropionitrile) was added to the device by vacuum backfilling through a hole in the counter electrode that was then sealed (Solaronix Test Cell Sealings) and covered (Solaronix Test Cell Caps).
Electrodes for solid-state absorption spectroscopy
Dye-functionalized electrodes were assembled as described above replacing the Solaronix Test Cell Titania Electrodes by Solaronix Test Cell Titania Electrodes Transparent.DSC and external quantum efficiency (EQE) measurements
The DSCs were masked for measurements; the mask was made from a black-coloured copper sheet with an aperture of average area 0.06012 cm2 (standard deviation = 1%) placed over the active area of the cell. The area of the aperture in the mask was smaller than the surface area of TiO2 (0.36 cm2). Black tape was used to complete the masking of the cell. Performance measurements were made by irradiating the DSC from behind with a LOT Quantum Design LS0811 instrument (100 mW cm−2 = 1 sun), and the simulated light power was calibrated with a silicon reference cell.The external quantum efficiency (EQE) measurements were made using a Spe-Quest quantum efficiency setup (Rera Systems, Netherlands) operating with a 100 W halogen lamp (QTH) and a lambda 300 grating monochromator (Lot Oriel). The monochromatic light was modulated to 3 Hz using a chopper wheel (ThorLabs), and the cell response was amplified with a large dynamic range IV converter (CVI Melles Griot) and then measured with a SR830 DSP Lock-In amplifier (Stanford Research).
Results and discussion
Ligand syntheses and characterizations
We have previously described the synthesis of the anchoring ligand 1 from the corresponding tetraethyl ester.12 Deprotection of tetraethyl ((6,6′-dimethyl-[2,2′-bipyridine]-4,4′-diyl)bis(4,1-phenylene))bis(phosphonate) is carried out using concentrated aqueous HCl followed by treatment with glacial acetic acid. This reaction takes 3 days, and we present here an alternative route involving treatment of the ester with Me3SiBr which gives acid 1 in 58.6% yield within 24 hours.The Kröhnke strategy21 was used to prepare compounds 3–6, and the synthetic route is summarized in Scheme 4; a stoichiometric amount of 1-(2-oxopropyl)pyridinium chloride was combined with intermediate 3a, 4a, 5a or 6a. Ligand 3 has previously been prepared in 25% yield,22 but by using the Kröhnke method, we were able to isolate 3 in 79.5% yield. The base peak in the electrospray mass spectrum of each of 3–6 arose from the [M + H]+ and the isotope pattern matched that simulated. The 1H and 13C NMR spectra of the ligands are consistent with the asymmetric structures shown in Scheme 2 and were assigned using COSY, NOESY, HMQC and HMBC methods; the spectrum of ligand 5 is shown in Fig. 1a as a representative example. In the NOESY spectrum for 5, cross peaks between HC2 and HB3, and between HC2 and HB5 allowed proton HC2 to be distinguished from HC3; this was confirmed by a NOESY peak between HC3 and HOMe; an HB5–HMe(ring B) NOESY cross peak distinguished HB3 from HB5. Signals in the 1H NMR spectra of 3, 4 and 6 were assigned in a similar manner.
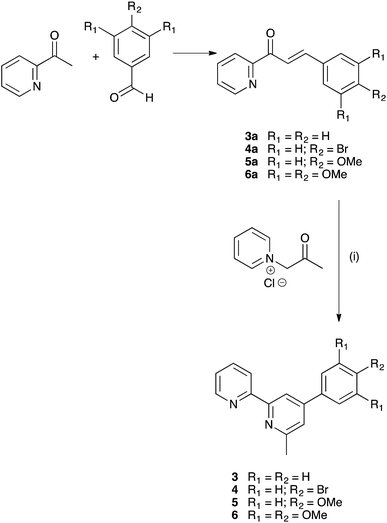 | ||
| Scheme 4 Synthesis of ligands 3–6 from literature precursors 3a–6a.16–18 Reaction conditions: (i) NH4OAc in EtOH, reflux. | ||
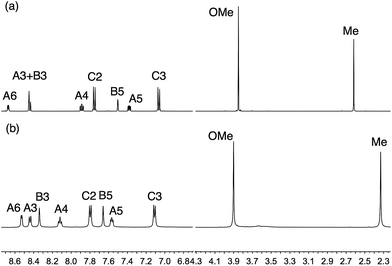 | ||
| Fig. 1 500 MHz NMR spectra of (a) ligand 5 in CD3CN, and (b) [Cu(5)2][PF6] in CD2Cl2 (≈295 K). For atom labelling, see Scheme 2. A common solvent could not be used for ligand and complex. | ||
Copper(I) complexes
The homoleptic complexes [Cu(Lancillary)2][PF6] with Lancillary = 3–6 were prepared by reaction of [Cu(NCMe)4][PF6] with two equivalents of ligand and were isolated as dark red-orange solids in 71.2–90.0% yield. The highest mass peak in the electrospray mass spectrum of each complex corresponded to the [M − PF6]+ ion and showed a characteristic isotope pattern corresponding to the simulated pattern. The 1H and 13C NMR spectra of the complexes were recorded in CD2Cl2, and assigned using 2D methods; NOESY spectra were used to distinguish between pairs of protons HB3/HB5 and HC2/HC3 as described earlier. Fig. 1 shows a comparison of the 1H NMR spectrum of [Cu(5)2][PF6] with that of the free ligand (in CD3CN), and similar changes (e.g. a shift to lower frequency for HA6 and HMe) occur upon coordination of each ligand. Proton signals for the peripheral phenyl substituent are little affected by coordination to copper.The solution absorption spectra of the complexes are compared in Fig. 2. The absorption maxima are summarized in Table 1 and were verified by recording the spectra at different concentrations. The spectra are dominated by high-energy bands assigned to π* ← π transitions and a broad metal-to-ligand charge transfer (MLCT) band with λmax ≈ 470 nm (Table 1). The extinction coefficient of 9300 dm3 mol−1 cm−1 for the MLCT band in [Cu(6)2][PF6] is in good agreement with the value predicted for [Cu(7)2]+ (see Scheme 3 for 7) by McMillin and co-worker23 using a model based on Mulliken's theory of donor–acceptor interactions.
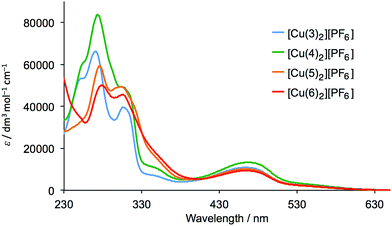 | ||
| Fig. 2 Solution (CH2Cl2) absorption spectra of complexes [Cu(Lancillary)2][PF6] with Lancillary = 3–6 (5 × 10⁻⁵ mol dm−3). | ||
| Complex | λmax/nm (εmax/dm3 mol−1 cm−1) | |
|---|---|---|
| π* ← π | MLCT | |
| a sh = shoulder; ε values are rounded to the nearest 100 dm3 mol−1 cm−1. | ||
| [Cu(3)2][PF6] | 248 (53![[thin space (1/6-em)]](https://www.rsc.org/images/entities/char_2009.gif) 700), 273 (65 700), 273 (65![[thin space (1/6-em)]](https://www.rsc.org/images/entities/char_2009.gif) 000), 311 (38 000), 311 (38![[thin space (1/6-em)]](https://www.rsc.org/images/entities/char_2009.gif) 300), 354 (6300) 300), 354 (6300) |
470 (10![[thin space (1/6-em)]](https://www.rsc.org/images/entities/char_2009.gif) 800) 800) |
| [Cu(4)2][PF6] | 257 sh (61![[thin space (1/6-em)]](https://www.rsc.org/images/entities/char_2009.gif) 700), 276 (82 700), 276 (82![[thin space (1/6-em)]](https://www.rsc.org/images/entities/char_2009.gif) 200), 308 sh (48 200), 308 sh (48![[thin space (1/6-em)]](https://www.rsc.org/images/entities/char_2009.gif) 400), 353 (9800) 400), 353 (9800) |
467 (13![[thin space (1/6-em)]](https://www.rsc.org/images/entities/char_2009.gif) 300) 300) |
| [Cu(5)2][PF6] | 278 (58![[thin space (1/6-em)]](https://www.rsc.org/images/entities/char_2009.gif) 300), 306 (49 300), 306 (49![[thin space (1/6-em)]](https://www.rsc.org/images/entities/char_2009.gif) 000), 354 sh (15 000), 354 sh (15![[thin space (1/6-em)]](https://www.rsc.org/images/entities/char_2009.gif) 400) 400) |
468 (10![[thin space (1/6-em)]](https://www.rsc.org/images/entities/char_2009.gif) 100) 100) |
| [Cu(6)2][PF6] | 282 (49![[thin space (1/6-em)]](https://www.rsc.org/images/entities/char_2009.gif) 200), 309 (44 200), 309 (44![[thin space (1/6-em)]](https://www.rsc.org/images/entities/char_2009.gif) 600), 353 sh (15 600), 353 sh (15![[thin space (1/6-em)]](https://www.rsc.org/images/entities/char_2009.gif) 800) 800) |
470 (9300) |
Solid state absorption spectra of TiO2-adsorbed copper(I)-containing dyes
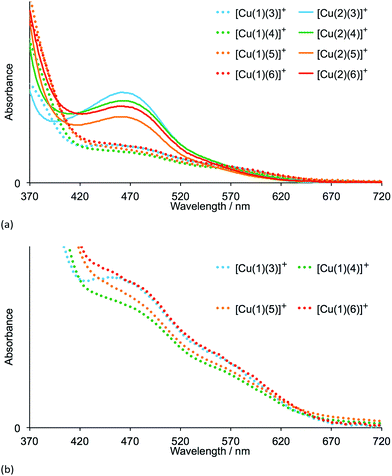
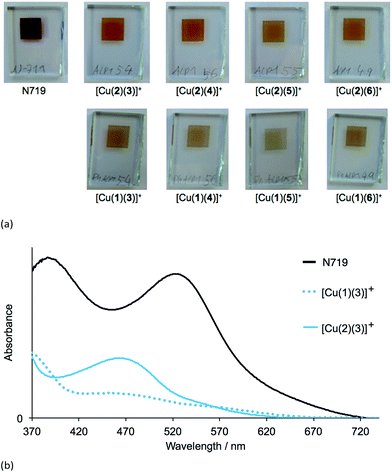
The heteroleptic dyes [Cu(1)(3)]+, [Cu(1)(4)]+, [Cu(1)(5)]+, [Cu(1)(6)]+, [Cu(2)(3)]+, [Cu(2)(4)]+, [Cu(2)(5)]+ and [Cu(2)(6)]+ were assembled in a step-wise manner on transparent TiO2 electrodes. Electrodes were soaked for 24 hours in a DMSO solution of anchoring ligand 1 or 2, followed by immersion for 3 days in a CH2Cl2 solution of the respective homoleptic [Cu(Lancillary)2][PF6] complex (Lancillary = 3–6). After washing and drying, the electrodes were placed in a tailor-made holder in the spectrophotometer and the absorption spectra recorded in transmission mode. Duplicate electrodes were used to validate the data, and Fig. 3a shows the spectra of one set of electrodes.The four dyes with anchoring ligand 2 exhibit MLCT absorptions with λmax = 466–468 nm. Replacing the 6,6′-methyl groups by 6,6′-phenyl substituents on going from anchor 2 to 1 leads to a reduction in the intensity of the MLCT bands while gaining slightly at longer wavelengths (Fig. 3a and b). The data are consistent with a lower dye-loading on increasing the steric requirements of the anchoring ligand. By eye, the electrodes with adsorbed dyes [Cu(2)(3)]+ to [Cu(2)(6)]+ appear a more intense orange colour than those with [Cu(1)(3)]+ to [Cu(1)(6)]+; this is seen in the photographs of the electrodes shown in Fig. 4a. An electrode with N719 is shown in Fig. 4a for comparison. In Fig. 4b, the absorption spectra of TiO2 functionalized with [Cu(1)(3)]+ and [Cu(2)(3)]+ are compared with that of an electrode with adsorbed N719 and underline the fact that light-harvesting by the copper(I) dyes lacks contributions from the red-end of the visible region in particular.
DSC performances
DSCs were made by stepwise assembly of the dyes [Cu(1)(3)]+, [Cu(1)(4)]+, [Cu(1)(5)]+, [Cu(1)(6)]+, [Cu(2)(3)]+, [Cu(2)(4)]+, [Cu(2)(5)]+ and [Cu(2)(6)]+ on the photoanode (see Experimental section); after introduction of the I−/I3− electrolyte, the DSCs were sealed and were completely masked24,25 before measurements were made. To confirm reproducibility of performance parameters, two DSCs were assembled for each dye. Additional cells with anchor 2 were also made and performance parameters were the same within experimental error as those discussed in detail below; Fig. 5 and S1† show J–V curves for multiple DSCs containing [Cu(2)(3)]+, [Cu(2)(4)]+, [Cu(2)(5)]+ and [Cu(2)(6)]+. Measurements of the DSCs were made on the day the cells were made, then again one and seven days later. Tables 2 (for anchor 1) and 3 (for anchor 2) list values of the short-circuit current density (JSC), open-circuit voltage (VOC), fill-factor (ff) and photoconversion efficiency (η). The final column in Tables 2 and 3 gives the photoconversion efficiency relative to a reference DSC containing N719 as the sensitizer; the value of η for this cell was set at 100%. This is a procedure that we use routinely to permit comparisons of data between different light sources (see later).26 Fig. 6 shows current density (J) versus potential (V) plots for the DSCs showing the best performances for each ligand combination in a [Cu(Lanchor)(Lancillary)]+ dye.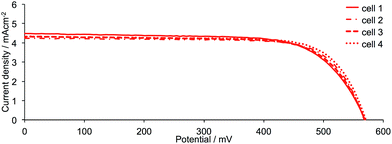 | ||
| Fig. 5 J–V curves for sets of four DSCs containing the dye [Cu(2)(6)]+ measured on the day of cell assembly to confirm performance reproducibility. Analogous sets of data for DSCs containing the dyes [Cu(2)(3)]+, [Cu(2)(4)]+ and [Cu(2)(5)]+ are shown in Fig. S1.† | ||
| Dye | JSC/mA cm−2 | VOC/mV | ff/% | η/% | Relative η/% |
|---|---|---|---|---|---|
| On the day of DSC fabrication | |||||
| [Cu(1)(3)]+ | 1.68 | 511 | 73 | 0.63 | 11.0 |
| [Cu(1)(3)]+ | 1.48 | 502 | 73 | 0.54 | 9.5 |
| [Cu(1)(4)]+ | 0.89 | 447 | 71 | 0.28 | 4.9 |
| [Cu(1)(4)]+ | 0.90 | 444 | 71 | 0.28 | 4.9 |
| [Cu(1)(5)]+ | 1.57 | 508 | 73 | 0.58 | 10.2 |
| [Cu(1)(5)]+ | 1.45 | 507 | 73 | 0.54 | 9.5 |
| [Cu(1)(6)]+ | 1.12 | 496 | 70 | 0.39 | 6.8 |
| [Cu(1)(6)]+ | 1.19 | 474 | 51 | 0.29 | 5.1 |
| N719 | 13.38 | 640 | 67 | 5.71 | 100 |
![[thin space (1/6-em)]](https://www.rsc.org/images/entities/char_2009.gif) |
|||||
| 1 day after DSC fabrication | |||||
| [Cu(1)(3)]+ | 1.12 | 505 | 70 | 0.40 | 6.7 |
| [Cu(1)(3)]+ | 0.77 | 485 | 73 | 0.27 | 4.6 |
| [Cu(1)(4)]+ | 0.94 | 466 | 59 | 0.26 | 4.4 |
| [Cu(1)(4)]+ | 0.69 | 449 | 68 | 0.21 | 3.5 |
| [Cu(1)(5)]+ | 1.01 | 504 | 72 | 0.37 | 6.2 |
| [Cu(1)(5)]+ | 0.85 | 494 | 73 | 0.31 | 5.2 |
| [Cu(1)(6)]+ | 0.64 | 490 | 71 | 0.22 | 3.7 |
| [Cu(1)(6)]+ | 0.55 | 465 | 66 | 0.17 | 2.9 |
| N719 | 13.32 | 652 | 68 | 5.93 | 100 |
![[thin space (1/6-em)]](https://www.rsc.org/images/entities/char_2009.gif) |
|||||
| 7 days after DSC fabrication | |||||
| [Cu(1)(3)]+ | 0.86 | 503 | 62 | 0.27 | 4.4 |
| [Cu(1)(3)]+ | 0.79 | 498 | 66 | 0.26 | 4.2 |
| [Cu(1)(4)]+ | 0.58 | 489 | 26 | 0.07 | 1.1 |
| [Cu(1)(4)]+ | 0.75 | 466 | 56 | 0.20 | 3.3 |
| [Cu(1)(5)]+ | 1.10 | 513 | 70 | 0.40 | 6.5 |
| [Cu(1)(5)]+ | 0.72 | 484 | 73 | 0.26 | 4.2 |
| [Cu(1)(6)]+ | 0.55 | 495 | 69 | 0.19 | 3.1 |
| [Cu(1)(6)]+ | 0.43 | 458 | 68 | 0.13 | 2.1 |
| N719 | 13.10 | 672 | 70 | 6.13 | 100 |
| Dye | JSC/mA cm−2 | VOC/mV | ff/% | η/% | Relative η/% |
|---|---|---|---|---|---|
| On the day of DSC fabrication | |||||
| [Cu(2)(3)]+ | 4.99 | 555 | 69 | 1.92 | 34.8 |
| [Cu(2)(3)]+ | 4.91 | 554 | 73 | 1.99 | 36.1 |
| [Cu(2)(4)]+ | 4.29 | 522 | 71 | 1.58 | 28.6 |
| [Cu(2)(4)]+ | 4.21 | 525 | 70 | 1.54 | 27.9 |
| [Cu(2)(5)]+ | 4.96 | 583 | 73 | 2.12 | 38.4 |
| [Cu(2)(5)]+ | 4.73 | 579 | 72 | 1.98 | 35.9 |
| [Cu(2)(6)]+ | 4.33 | 569 | 72 | 1.77 | 32.1 |
| [Cu(2)(6)]+ | 4.33 | 571 | 74 | 1.83 | 33.2 |
| N719 | 13.61 | 623 | 65 | 5.52 | 100 |
![[thin space (1/6-em)]](https://www.rsc.org/images/entities/char_2009.gif) |
|||||
| 1 day after DSC fabrication | |||||
| [Cu(2)(3)]+ | 4.47 | 572 | 69 | 1.77 | 31.3 |
| [Cu(2)(3)]+ | 4.31 | 561 | 74 | 1.78 | 31.4 |
| [Cu(2)(4)]+ | 4.12 | 539 | 71 | 1.58 | 27.9 |
| [Cu(2)(4)]+ | 3.89 | 537 | 71 | 1.48 | 26.1 |
| [Cu(2)(5)]+ | 4.80 | 585 | 75 | 2.09 | 36.9 |
| [Cu(2)(5)]+ | 5.00 | 581 | 73 | 2.11 | 37.3 |
| [Cu(2)(6)]+ | 3.99 | 594 | 71 | 1.69 | 29.9 |
| [Cu(2)(6)]+ | 4.00 | 598 | 74 | 1.77 | 31.3 |
| N719 | 13.17 | 676 | 64 | 5.66 | 100 |
![[thin space (1/6-em)]](https://www.rsc.org/images/entities/char_2009.gif) |
|||||
| 7 days after DSC fabrication | |||||
| [Cu(2)(3)]+ | 4.29 | 582 | 63 | 1.57 | 26.9 |
| [Cu(2)(3)]+ | 4.22 | 575 | 73 | 1.77 | 30.3 |
| [Cu(2)(4)]+ | 3.88 | 566 | 72 | 1.58 | 27.1 |
| [Cu(2)(4)]+ | 4.13 | 551 | 63 | 1.43 | 24.5 |
| [Cu(2)(5)]+ | 4.65 | 589 | 74 | 2.03 | 34.8 |
| [Cu(2)(5)]+ | 4.93 | 575 | 73 | 2.07 | 35.4 |
| [Cu(2)(6)]+ | 3.77 | 587 | 73 | 1.61 | 27.6 |
| [Cu(2)(6)]+ | 4.07 | 589 | 71 | 1.70 | 29.1 |
| N719 | 13.01 | 705 | 64 | 5.84 | 100 |
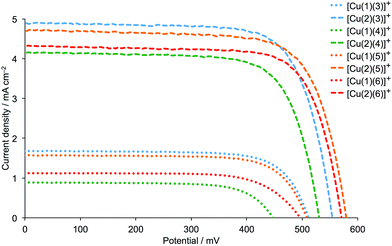 | ||
| Fig. 6 J–V curves for DSCs containing the dyes [Cu(1)(Lancillary)]+ and [Cu(2)(Lancillary)]+ (Lancillary = 3–6) measured on the day the DSCs were assembled. | ||
Firstly, we consider the effect of changing the 6,6′-substituents in the anchoring ligand. The data in Tables 2 and 3, and the J–V curves in Fig. 6 reveal that the dyes containing the 6,6′-diphenyl-substituted anchoring ligand 1 perform poorly with respect to those with the 6,6′-dimethyl-substituted anchor 2, both in terms of values of JSC and VOC. The trend in values of JSC upon changing the anchoring ligand are corroborated by the external quantum efficiency (EQE) spectra shown in Fig. 7. Although use of the 6,6′-diphenyl-substituted 1 leads to a broad spectral response between 420 and 630 nm (Fig. 7), values of EQEmax are <12% for [Cu(1)(Lancillary)]+ (Lancillary = 3–6), compared to EQEmax values in the range 41.8 to 49.4% (λmax = 470–480 nm) for [Cu(2)(Lancillary)]+ (Lancillary = 3–6). The results are consistent with DSC parameters for [Cu(1)(N^N)]+ versus [Cu(2)(N^N)]+ dyes where the bpy-based ancillary ligand contains 4-bromophenyl substituents in both the 4- and 4′-positions.12 On the day of cell fabrication, DSCs containing anchor 2 with ancillary ligands 3–6 achieve overall efficiencies, η, of between 27.9 and 38.4% relative to that of the reference dye N719 set at 100% (Table 3); the efficiencies decrease somewhat over a period of a week, but remain ∼30% that of N719 set at 100%. In contrast, use of the more sterically demanding anchor 1 results in relative efficiencies of ≤11.0%.
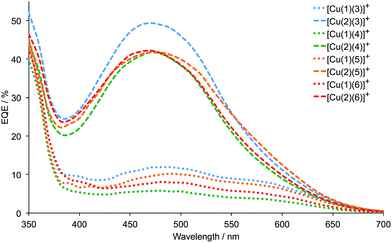 | ||
| Fig. 7 EQE spectra for DSCs containing the dyes [Cu(1)(Lancillary)]+ and [Cu(2)(Lancillary)]+ (Lancillary = 3–6) measured on the day the DSCs were made. | ||
Secondly, we focus on the dyes containing the 6,6′-dimethyl-substituted anchor 2. The performance parameters for DSCs containing [Cu(2)(4)]+ may be compared with those with the dye [Cu(2)(8)]+; ligand 8 is related to 4 as shown in Scheme 3. We have previously demonstrated8,15 that the photoconversion efficiencies of DSCs with [Cu(2)(8)]+ are ≈2.4%. However, because of the use of different light sources (Solaronix SolarSim 150![[thin space (1/6-em)]](https://www.rsc.org/images/entities/char_2009.gif) 8,15 and LOT Quantum Design LS0811 in the present work), efficiencies relative to N719 set at 100%26 are more meaningful than absolute values of η for comparative purposes. DSCs containing [Cu(2)(8)]+ achieve relative efficiencies of 33.0% on the day of cell fabrication, compared with 27.9% and 28.6% for the two cells containing [Cu(2)(4)]+.
8,15 and LOT Quantum Design LS0811 in the present work), efficiencies relative to N719 set at 100%26 are more meaningful than absolute values of η for comparative purposes. DSCs containing [Cu(2)(8)]+ achieve relative efficiencies of 33.0% on the day of cell fabrication, compared with 27.9% and 28.6% for the two cells containing [Cu(2)(4)]+.
The incorporation of the electron-releasing methoxy substituent in the 4-position of the bpy unit in 5 is beneficial, as expected in terms of the desirable ‘push–pull’ characteristics of a dye for an n-type DSC. Use of [Cu(2)(5)]+ leads to enhanced values of VOC with respect to [Cu(2)(4)]+ (Fig. S1† and 6). Overall, the efficiencies of DSCs containing [Cu(2)(5)]+ are higher than those with [Cu(2)(6)]+ and this can be understood in terms of the dominant +M effect of the 4-methoxy substituent being partially countered by the −I effects of the 3,5-dimethoxy groups. Data in Table 3 show that this trend is maintained over a week after the cells were assembled and that the gain in performance originates from enhanced JSC. Although values of EQEmax for DSCs with [Cu(2)(5)]+ and [Cu(2)(6)]+ are the same (Fig. 7), the EQE spectrum for the DSC with [Cu(2)(5)]+ is appreciably extended towards the red-end of the spectrum, consistent with higher JSC values for cells sensitized with [Cu(2)(5)]+. An unexpected observation is that DSCs containing [Cu(2)(3)]+ perform well, especially on the day of cell fabrication. The relatively high values of JSC (Table 3, Fig. S1† and 7) are an important contributing factor, and effective values of VOC are also achieved (Table 3, Fig. S1† and 6). Simple ancillary ligands such as 3 (Scheme 3) are often overlooked in a desire to design ‘push–pull’ dyes for the n-type semiconductor surface.2 However, the present results suggest that such ancillary ligands deserve further exploration.
Bleaching of the dyes and dye regeneration
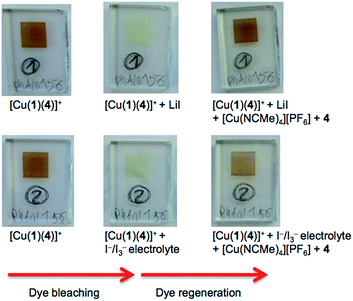
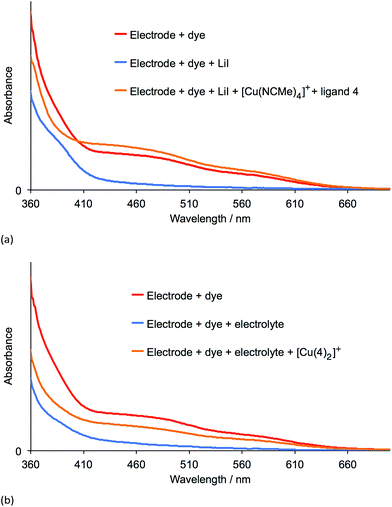
Table 3 shows that over a 7 day period after the DSCs were made, the cells containing [Cu(2)(Lancillary)]+ (Lancillary = 3–6) exhibited stable photoconversion performances, whereas Table 2 reveals that the performances of cells with [Cu(1)(Lancillary)]+ generally decayed. By eye, the red-orange colour of the photoanodes in the DSCs containing anchor 1 bleached. To investigate the process, solid-state absorption spectra of transparent FTO/TiO2 electrodes functionalized with [Cu(1)(4)]+ were recorded and then the electrodes were soaked 15 min in either a 3-methoxypropionitrile solution of LiI or in a solution of the standard I−/I3− electrolyte used for the DSCs. In both cases, the orange colour of the dye bleached (Fig. 8, left) and the MLCT band arising from the adsorbed dye decreased in intensity (Fig. 9), consistent with our previous proposal that bleaching is caused by attack at the copper(I) centre by I− ion.12 The electrodes were then soaked in either MeCN solutions of [Cu(NCMe)4][PF6] followed by ligand 4 (in CH2Cl2), or in a CH2Cl2 of [Cu(4)2][PF6]. After removal from the dye-baths, the electrodes were dried and washed with CH2Cl2 and dried. This dye-bath step regenerated the characteristic orange colour (Fig. 8, right) of a bis(diimine) copper(I) complex. The spectra in Fig. 9 confirm that the anchor 1 remains on the surface during the bleaching process and is able to bind copper(I) and ancillary ligand (Fig. 9a) or undergo ligand exchange with the homoleptic complex (Fig. 9b) to regenerate the surface-bound [Cu(1)(4)]+ dye. These observations indicate that our previous report of copper(I) dye-regeneration on bleached photoanodes12 may be applied more generally.Conclusions
The homoleptic complexes [Cu(3)2][PF6], [Cu(4)2][PF6], [Cu(5)2][PF6] and [Cu(6)2][PF6] containing asymmetric diimine ligands have been prepared and characterized. By use of a ‘surfaces-as-ligands’ strategy, the heteroleptic dyes [Cu(1)(Lancillary)]+ and [Cu(2)(Lancillary)]+ with Lancillary = 3, 4, 5 or 6 were assembled on FTO/TiO2 electrodes. The phosphonic acid anchoring ligands 1 and 2 differ in having phenyl or methyl substituents in the 6- and 6′-positions of the bpy metal-binding domain. The reproducibility of DSC performances was confirmed by using multiple devices for each dye. Solid-state absorption spectra of adsorbed [Cu(1)(Lancillary)]+ and [Cu(2)(Lancillary)]+, and external quantum efficiency (EQE) spectra of DSCs containing these dyes show that use of the diphenyl-substituted 1 results in a broadened spectral response at lower energies compared to dyes with anchor 2. However, dye-loading is higher for [Cu(2)(Lancillary)]+ than for [Cu(1)(Lancillary)]+, and EQEmax is >41% for [Cu(2)(Lancillary)]+ compared to <12% for [Cu(1)(Lancillary)]+. For all four ancillary ligands, use of anchor 2 rather than 1 leads to significantly higher JSC values. For the series of [Cu(2)(Lancillary)]+ dyes, DSC measurements have been validated by using four different cells for each dye, and conclusions upheld by confirming DSC reproducibility. The photoconversion efficiencies of [Cu(2)(Lancillary)]+ dyes vary with Lancillary in the order 3 ∼ 5 > 6 > 4 on the day of DSC assembly, and 5 > 3 ∼ 6 > 4 after a week. The best performing DSCs achieve efficiencies of ∼37% relative to N719 set at 100%. DSCs containing the [Cu(1)(Lancillary)]+ dyes rapidly bleach, but the adsorbed dye can be regenerated on the electrode by reimmersion in dye baths containing [Cu(Lancillary)2][PF6] or [Cu(NCMe)4][PF6] followed by Lancillary. We are currently investigating dyes containing symmetrical analogues of 3, 5 and 6, as well as the effects of isomerization within the methoxyphenyl rings.Acknowledgements
We gratefully acknowledge the financial support of the European Research Council (Advanced Grant 267816 LiLo), the Swiss National Science Foundation (Grant numbers 200020_144500 and 200020_162631) and the University of Basel. Dr Andreas M. Bünzli and Frederik J. Malzner are thanked for recording NMR and mass spectra, respectively.Notes and references
- N. Alonso-Vante, J.-F. Nierengarten and J.-P. Sauvage, J. Chem. Soc., Dalton Trans., 1994, 1649 RSC.
- C. E. Housecroft and E. C. Constable, Chem. Soc. Rev., 2015, 44, 8386 RSC.
- B. Bozic-Weber, E. C. Constable and C. E. Housecroft, Coord. Chem. Rev., 2013, 257, 3089 CrossRef CAS.
- M. S. Lazorski and F. N. Castellano, Polyhedron, 2014, 82, 57 CrossRef CAS.
- C.-Y. Chen, M. Wang, J.-Y. Li, N. Pootrakulchote, L. Alibabaei, C. Ngoc-le, J.-D. Decoppet, H.-H. Tsa, C. Grätzel, C.-G. Wu, S. M. Zakeeruddin and M. Grätzel, ACS Nano, 2009, 3, 3103 CrossRef CAS PubMed.
- Q. Yu, Y. Wang, Z. Yi, N. Zu, J. Zhang, M. Zhang and P. Wang, ACS Nano, 2010, 4, 6032 CrossRef CAS PubMed.
- H. Ozawa, Y. Okuyama and H. Arakawa, ChemPhysChem, 2014, 15, 1201 CrossRef CAS PubMed.
- F. J. Malzner, S. Y. Brauchli, E. C. Constable, C. E. Housecroft and M. Neuburger, RSC Adv., 2014, 4, 48712 RSC.
- M. Sandroni, L. Favereau, A. Planchat, H. Akdas-Kilig, N. Szuwarski, Y. Pellegrin, E. Blart, H. Le Bozec, M. Boujtita and F. Odobel, J. Mater. Chem. A, 2014, 2, 9944 CAS.
- M. Sandroni, M. Kayanuma, A. Planchat, N. Szuwarski, E. Blart, Y. Pellegrin, C. Daniel, M. Boujtita and F. Odobel, Dalton Trans., 2013, 42, 10818 RSC.
- E. Schönhofer, B. Bozic-Weber, C. J. Martin, E. C. Constable, C. E. Housecroft and J. A. Zampese, Dyes Pigm., 2015, 115, 154 CrossRef and references therein.
- S. Y. Brauchli, F. J. Malzner, E. C. Constable and C. E. Housecroft, RSC Adv., 2015, 5, 48516 RSC.
- B. Bozic-Weber, E. C. Constable, C. E. Housecroft, P. Kopecky, M. Neuburger and J. A. Zampese, Dalton Trans., 2011, 40, 12584 RSC.
- B. Bozic-Weber, S. Y. Brauchli, E. C. Constable, S. O. Fürer, C. E. Housecroft and I. A. Wright, Phys. Chem. Chem. Phys., 2013, 15, 4500 RSC.
- B. Bozic-Weber, S. Y. Brauchli, E. C. Constable, S. O. Fürer, C. E. Housecroft, F. J. Malzner, I. A. Wright and J. A. Zampese, Dalton Trans., 2013, 42, 12293 RSC.
- S. Otto, F. Bertoncin and J. B. F. N. Engberts, J. Am. Chem. Soc., 1996, 118, 7702 CrossRef CAS.
- C. Fan, X. Wang, P. Ding, J. Wang, Z. Liang and X. Tao, Dyes Pigm., 2012, 95, 757 CrossRef CAS.
- A. Ciupa, P. A. De Bank, M. F. Mahon, P. J. Wood and L. Caggiano, Med. Chem. Commun., 2013, 4, 956–961 RSC.
- P. Rao, M. Amini, H. Li, A. G. Habeeb and E. E. Knaus, Bioorg. Med. Chem. Lett., 2003, 13, 2205 CrossRef CAS PubMed.
- G. J. Kubas, Inorg. Synth., 1990, 28, 68 CrossRef CAS.
- F. Krönhke, Synthesis, 1976, 1 CrossRef.
- K. Shibata, I. Katsuyama, H. Izoe, M. Matsui and H. Muramatsu, J. Heterocycl. Chem., 1993, 30, 277 CrossRef CAS.
- C. C. Phifer and D. R. McMillin, Inorg. Chem., 1986, 25, 1329 CrossRef CAS.
- H. J. Snaith, Energy Environ. Sci., 2012, 5, 6513 Search PubMed.
- H. J. Snaith, Nat. Photonics, 2012, 6, 337 CrossRef CAS.
- F. J. Malzner, S. Y. Brauchli, E. Schönhofer, E. C. Constable and C. E. Housecroft, Polyhedron, 2014, 82, 116 CrossRef CAS.
Footnote |
| † Electronic supplementary information (ESI) available: Syntheses of compounds 1–6. Fig. S1: J–V curves for sets of four DSCs containing the dyes [Cu(2)(3)]+, [Cu(2)(4)]+ and [Cu(2)(5)]+. See DOI: 10.1039/c5ra25447g |
| This journal is © The Royal Society of Chemistry 2016 |

