Capabilities of radiofrequency pulsed glow discharge-time of flight mass spectrometry for molecular screening in polymeric materials: positive versus negative ion mode
Lara
Lobo
*,
Beatriz
Fernández
,
Rocío
Muñiz
,
Rosario
Pereiro
and
Alfredo
Sanz-Medel
Department of Physical and Analytical Chemistry, University of Oviedo, Julián Clavería 8, 33006 Oviedo, Asturias, Spain. E-mail: lobolara@uniovi.es
First published on 24th September 2015
Abstract
Negative ionization mode in the recent commercialized “PP-TOFMS, Plasma Profiling Spectrometer” instrument from Horiba has been examined in detail for the analysis of different polymeric materials and the results were compared with those of positive ion mode. Three compounds (tetrabromobisphenol A, tris-2-chloroethyl-phosphate and polytetrafluoroethylene) embedded in a polyurethane matrix were employed for such a purpose. Both, elemental information from the heteroatoms (F, Cl, Br and P) and/or molecular information provided, using either Ar or Ar + 4% O2 as discharge gases, were investigated. Also, the analytical potential of the negative ionization mode for integral speciation of polymers was explored, both in Ar and Ar + 4% O2. The screening of polymeric materials with similar elemental composition, in particular, four brominated flame retardants (BFRs), was performed to investigate this point. The results showed that elemental sensitivity for halogens in the negative mode of the instrument was higher as compared to positive detection. Sensitivity was observed to be directly dependent on the electron affinity of the analyte. Polyatomic information measured in negative mode using Ar as the discharge gas has demonstrated to be promising for a successful identification of the four different BFRs investigated. The adverse effects of reactions occurring in the plasma in the presence of oxygen have proved to be a serious drawback to be tackled for polymer characterization using this novel PP-TOFMS glow discharge-based technology.
Introduction
The use of radiofrequency (rf) pulsed glow discharge (PGD) coupled to time-of-flight mass spectrometry (TOFMS) has attracted much attention during the last few years.1 In fact, the first commercial rf-PGD-TOFMS instrument, the Plasma Profiling Spectrometer PP-TOFMS, has been recently launched by Horiba (Longjumeau, France). A combination of a PGD ionization source with the high intrinsic data acquisition rates of the TOFMS has opened new possibilities for further and advantageous analytical uses, including the depth profile analysis of thin layers and polymer identification. Before 2000, few investigations dealing with GDs can be found for polymer analysis, either using optical emission or mass spectrometry,2–4 although the first publication on this topic was published in 1975.5 Optical emission detection is mostly limited to providing elemental data; however, it can offer valuable information as well for the characterization of some polymeric materials, including thin electrodeposited polyaniline films6 or brominated flame retardants (BFRs).7 Mass spectrometry (MS) is in general more suited to give molecular information using GDs.One of the most studied polymeric materials using GD coupled to MS is polytetrafluoroethylene (PTFE).4,8,9 Shick et al. first demonstrated the possibilities of rf-GD coupled to a quadrupole mass spectrometer for characterization of a series of PTFE based polymeric materials.9 Since then, several publications have been focused on the identification and screening of different polymers. The results, measuring the afterglow regime in rf-PGD-TOFMS instruments, proved that chemical characterization of different polymeric layers containing similar elemental composition but different chemical structures is feasible.10–13 For example, rf-PGD-TOFMS has already shown its analytical potential as a screening technique for BFRs12 and conductive polymers.13 Fast and direct identification of BFRs, widely used as chemical flame retardants, is particularly interesting as some BFRs are related to harmful effects on health (e.g. endocrine disruption) and the environment (e.g. bioaccumulative). It should be emphasized that those investigations, as well as most GD-MS applications, deal with the detection of positive ions.
In 2009 Canulescu et al. reported a brief comparison between positive and negative ion detection in rf-PGD-TOFMS using a PTFE sample.14 They showed that negative ions also exhibited their maximum intensity in the afterglow region, being the intensity found for F in negative mode up to three orders of magnitude higher compared to positive mode. Those authors also measured negative ions to study fluorine distribution in a tantalum fluoride layer: F− and TaFO2− ions were used to follow the distribution of incorporated fluorine species all along an anodic film.15 Very recently, González-Gago et al. have reported capabilities of this technique for the in-depth profile analysis of thin film composite membranes.16 In that publication, a normalized Br signal, both in positive and negative modes, was proved to correlate with the oxidation time of the sample. Moreover, it was shown that Br from marine water was incorporated into the whole polyamide layer and not only on the surface of the membrane.
The aim here is to investigate the features and performance of the commercial PP-TOFMS instrument in negative ion mode detection, as compared to positive ion detection, for polymer analysis. A systematic study has been undertaken to investigate the potential of the negative ionization mode both for elemental and molecular analyses. Three different organic compounds contained in a polyurethane matrix as well as a PTFE polymeric layer were investigated. Each of the compounds was chosen to have at least an electronegative heteroatom and so F, Cl, Br and P were studied. The potential of negative ion measurement was also investigated for the screening of different BFRs previously studied with a rf-PGD-TOFMS prototype in positive mode.12 Finally, the addition of 4% oxygen to the discharge gas (Ar) to explore its effect on elemental and molecular signals as well as on polymer identification capabilities has been also investigated in detail.
Experimental
Reagents and polymer preparation
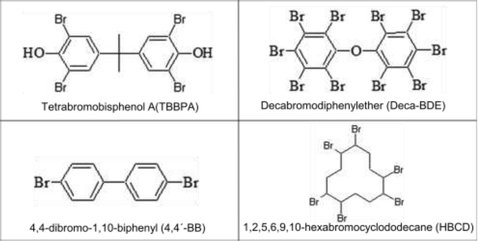
Bisphenol A [2,2-bis(5-hydroxyphenyl)propane], phloroglucinol, 3,30,5,50-tetrabromobisphenol A (TBBPA), tris-2-chloroethyl-phosphate (Tris), decabromodiphenylether (Deca-BDE), 4,4-dibromo-1,10-biphenyl (4,4′-BB), 1,2,5,6,9,10-hexabromocyclododecane (HBCD) and 1 μm particle size poly(tetrafluoroethylene) (PTFE), were purchased from Sigma-Aldrich (Steinheim, Germany). Diphenylmethane-4,40-diisocyanate (MDI) and tetrahydrofuran (THF) were provided by Merck (Darmstadt, Germany) and Chromanorm (Leuven, Belgium), respectively. The chemical structure of the monomers TBBPA, Deca-BDE, 4,4′-BB and HBCD can be seen in Table 1.Polymeric layers were deposited on electronic quality silicon wafers (525 ± 25 μm thickness) from University Wafer (USA). Comparative investigations on positive and negative ion modes were performed using three polymers containing different heteroatoms. Polyurethane polymers from bisphenol A and MDI were prepared containing Tris (ca. 1.9% w/w P and 6.8% w/w Cl), TBBPA (ca. 6.4% w/w Br) or PTFE (ca. 4.9% w/w F). Phloroglucinol was used as a cross-linker and THF as a solvent. Screening studies were tackled using different BFRs containing ca. 27.9% w/w Br. Preparation of these polymers can be found elsewhere.12 Also, a PTFE layer (ca. 75% w/w F) prepared by dissolving PTFE in chloroform and then deposited on top of the silicon wafer was used.
Instrumentation
The recent commercial instrument PP-TOFMS (Horiba, France) was used in this work. The GD ion source is a 4 mm diameter copper based anode with a 20 mm long flow tube. The rf power is supplied to the plasma through the backside of the sample, placed horizontally. The interface consists of a 0.5 mm sampler and 1 mm skimmer. After the skimmer, there is a quadrupole filter that allows attenuation up to four ions at different masses in order to reduce overloading of the detector and thus, to increase its dynamic range. Typically, this “blanking” system is used for Ar species (40Ar+, 40Ar1H+, 40Ar2+) and/or matrix ions. However, just to compare the positive and negative ionization modes, no “blanking” was used in our experiments. In addition, in order to correct for day to day bias, all signals have been normalized using the averaged total ion count, (TIC), i.e. the total number of ions reaching the detector within a single measurement. High purity Ar (99.999% minimum purity) and a mixture of Ar with 4% O2 from Air Liquid (Oviedo, Spain) were employed as discharge gases for the experiments. The selected O2 concentration would be high enough to make important modifications in the plasma electronegativity.25 kHz and 35 kHz extraction frequencies to the flight tube were here compared, providing a complete mass spectra up to m/z = 395 and m/z = 202, respectively. 35 kHz was finally selected since it was observed that no polyatomics were found in negative mode above m/z = 200. 1 ms pulse width and 4 ms pulse period were employed in all experiments. Before analysis, samples were flushed for 180 s at 300 Pa. Comparative investigations between positive and negative modes were performed by analyzing polymers during a total measurement time of 240 s. For all experiments, data shown correspond to the normalized averaged intensity (ion intensities/TIC) in the afterglow region during the whole sputtering time. Polyatomic ion identification was done using TofDaq Viewer software from Tofwerk (Thun, Switzerland) after proper calibration of the mass spectra. All polyatomic ions assigned in this work correspond to the most likely ion given by instrument software. That is, accurate identification cannot be warranted at this stage.
Results and discussion
Optimization of the operating conditions
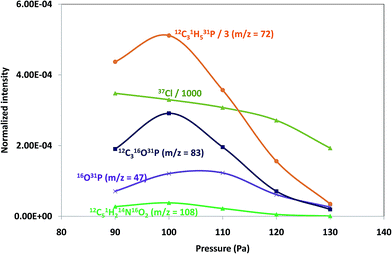
Pressure and power GD operating conditions in negative mode were first optimized to achieve the best sensitivity for polyatomic species within each of the polymeric layers (which contained different halogenated compounds). Fig. 1 shows the intensity variation of different ion species found on tris(polyurethane matrix) when varying the applied pressure (a) and power (b). Both, elemental ions (Cl is plotted as a representative example) and possible polyatomics along the mass spectra were monitored in the search of the best GD operating conditions. It can be seen that ion intensities are lower with increasing pressures (at 25 W). Higher signals are obtained between 90 Pa and 110 Pa and so 100 Pa was selected for this coating, while 110 Pa was found to be optimum for TBBPA and PTFE polymers. On the other hand, normalized intensities increased with a power up to 15 W (pressure fixed at 100 Pa) and then diminished for higher power values, as can be seen in Fig. 1b (thus, 15 W was chosen as the optimum). Final selected optimum conditions were 100 Pa and 15 W for Tris and 110 Pa and 15 W for TBBPA and PTFE.Positive versus negative ion mode
In order to compare the analytical performance features of positive and negative modes, analytical signals observed along the pulse profiles were initially considered. Despite the different ionization processes involved, both positive and negative ions exhibit an enhancement of the ion signals after the end of the GD pulse (i.e. afterglow region). Whereas in positive mode the observed higher intensities in such a temporal region can be explained due to ionization with metastable argon;17 in the negative mode higher intensity occurs because of the drop of electron temperature and density once the pulse is off, favoring the transport of negative ions.18In our experiments it was also noted that the maxima of the ion signal in negative mode appear at similar times (with respect to the end of the pulse) to that in positive mode. However, in positive mode a broader dispersion was obtained. This narrower time spread at which the maximum of the ions appear in the afterglow for negative mode could be attributed to the fast drop of electron temperature after the end of the pulse.18 Conversely, positive ions can still be formed when electrons are already thermalized.19 As an example, the time at which the maximum of the afterglow was registered for 12C, 79Br and 79Br12C31H5 from TBBPA in the polyurethane matrix has been collected in Table 2 both for positive and negative modes. The plotted ions were selected covering different m/z values. It seems that under the selected experimental conditions, a higher m/z gives rise to a delayed detection of the maximum in the afterglow. Similar results have also been observed in previous studies in positive detection mode.20 In fact, Bouza et al.21 have reported that at low pressures, the higher the m/z of the isotope the later its maximum intensity in the afterglow appeared.
| Ion | Positive-Ar (ms) | Negative-Ar (ms) |
|---|---|---|
| 12C | 1.08 | 1.20 |
| 79Br | 1.28 | 1.24 |
| 79Br12C31H5 | 1.36 | 1.28 |
Fig. 2 shows comparative mass spectra (averaged spectrum along the complete pulse profile and during the whole sputtering time) obtained in positive and negative modes for PTFE in the polyurethane matrix under the optimum operational conditions found in negative mode. It can be seen that positive mode gives rise to ions up to about m/z = 200 while in negative mode the highest polyatomic ions observed are at m/z = 125. This is also the case for Tris (positive: m/z = 200; negative: m/z = 100) and TBBPA (positive: m/z = 250; negative: m/z = 125). Previous studies in negative mode using a prototype of the GD-TOFMS have shown negative ions at higher masses14,15 than those obtained in the present work. In particular, Canulescu et al. have reported signals up to m/z = 400 measuring a PTFE polymer.14 From Fig. 2 it can be observed that the background is higher in negative mode due to the fact that the electrons present in the plasma are transferred to the mass spectrometer together with the negative ions. Despite the higher background, it seems that normalized ion intensities of the same order are achieved for both ionization modes. Due to the marked differences found using the prototype14 and the commercial instrument here for negative ion detection, a pure PTFE polymeric layer was also considered in this work. Fig. 3 shows the mass spectra obtained in positive and negative mode for such a polymer. It can be seen that, despite using a similar sample, our commercial instrument detected no polyatomics at the higher masses reported by Canulescu et al., particularly for negative ion detection,14 employing a GD-TOFMS prototype.
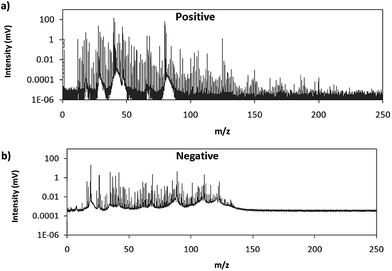 | ||
| Fig. 2 Averaged mass spectra (mV) obtained under the optimum experimental conditions (110 Pa, 15 W) for PTFE embedded in the polyurethane matrix in (a) positive mode and (b) negative mode. | ||
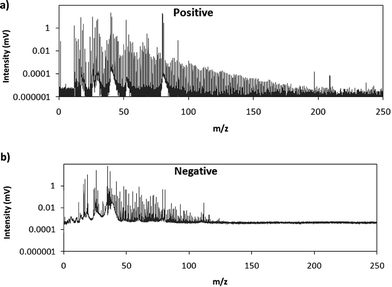 | ||
| Fig. 3 Averaged mass spectra (mV) obtained under the optimum experimental conditions (110 Pa, 15 W) for a PTFE layer in (a) positive mode and (b) negative mode. | ||
Differences found between such GD prototype and our PP-TOFMS commercial instrument can only be explained considering: (i) the sample–sampler distance (the GD chamber design, ion lenses and mass spectrometer are similar) and (ii) the interface sampler–skimmer. In the prototype (EMPA-prototype) used for those preliminary studies in negative mode,14,15 the sample–sampler distance was longer (31.7 mm) compared to the commercial instrument (24.3 mm); larger sample–sampler distances in positive mode have proved to provide better limits of detection of polyatomic ions.13 On the other hand, the interface sampler–skimmer could also have an influence on the negative ions detected. The EMPA-prototype has a quadrupole acting as an ion guide (also allowing mass blanking) between the sampler and skimmer orifice. In the commercial instrument, the quadrupole is placed after the skimmer, the sampler–skimmer distances being shorter (7.8 mm vs. 76.3 mm). Therefore, it seems that the ion guide after the sampler could help to form negative ions in the afterglow plasma downstream of the sampler cone and/or to better extract the negative ions into the mass spectrometer.
Let us consider now the elemental information of the different polyurethane samples (see Table 3). The first two columns containing our experimental data in Table 3 show the average and standard deviation (normalized ion intensities with respect to ppm) obtained for each of the heteroatoms using Ar as the discharge gas. It can be seen that P (ca. 1.9% w/w) was detected in positive mode with a sensitivity nearly one hundred times higher than that observed with the negative mode. F (4.9% w/w), present in PTFE, can only be monitored in negative mode. On the other hand, Br (6.4% w/w) and Cl (6.8% w/w) could be detected in both modes; however, sensitivity achieved for Cl was rather low in the positive mode. Br− was detected with about 10 times enhancement of the MS signal as compared to Br+. The results obtained using the negative mode can be explained in terms of electron affinity of each element/analyte (also collected in Table 3). For instance, P presents comparatively low electron affinity compared to Br, Cl and F and so, its sensitivity turned out to be the lowest out of the investigated analytes in negative mode.
| Electron affinity (kJ mol−1) | Polymer | Positive-Ar | Negative-Ar | Negative-Ar + O2 | |
|---|---|---|---|---|---|
| (cps/TIC × ppm) × 10−6 | |||||
| 31P | 72 | Tris | 0.55 ± 0.06 | 0.0065 ± 0.0005 | Not detected |
| 79Br | 324 | TBBPA | 1.26 ± 0.01 | 9.86 ± 0.15 | 7.10 ± 1.22 |
| 19F | 328 | PTFE | Not detected | 7.24 ± 0.14 | 7.68 ± 1.33 |
| 35Cl | 349 | Tris | 0.0028 ± 0.0002 | 33.1 ± 0.8 | 91.5 ± 1.3 |
Regarding molecular information, the results obtained for some of the polyatomic ions detected in the PTFE (embedded in polyurethane) have been collected in Table 4 (identification of the corresponding ion was done using the TofDaq Viewer software of the instrument). The first observation to be noted is that not the same polyatomic ions should be identified in both modes. For instance, PTFE in positive mode showed more C–H combinations, also with N and/or O, while working in the negative mode, showed more F containing ions. Due to the high electronegativity of fluorine, the negative F-ions would be more likely to be detected in the negative ionization mode of the instrument.
| PTFE | |||
|---|---|---|---|
| m/z | Polyatomic | Positive-Ar (cps/TIC) × 10−3 | Negative-Ar (cps/TIC) × 10−3 |
| 44 | 12C16O2 | 13 ± 3 | Not detected |
| 12C219F1H | Not detected | 2.091 ± 0.005 | |
| 12C21H416O | 2.7 ± 0.3 | Not detected | |
| 74 | 12C61H2 | 0.15 ± 0.02 | Not detected |
| 12C319F2 | Not detected | 2.23 ± 0.01 | |
| 93 | ? | 0.061 ± 005 | Not detected |
| 12C319F3 | Not detected | 0.62 ± 0.02 | |
Ar versus Ar + O2 discharge mixture using the negative ion mode
In an attempt to favor the formation of negative ions and the eventual generation of polyatomics at higher masses, a mixture of 4% O2 in Ar was used to generate the GD. The idea consisted on creating a more electronegative plasma which could be more efficient to produce negative ions. In fact, it has been previously described that increasing oxygen concentrations in the GD plasma gives rise to higher negative ion signals, especially for oxide ions as shown by Mushtaq et al. in a continuous dc-GD-MS.22 It is known that the addition of oxygen in the plasma drastically reduces the sputtering rate of metals, while for nonconductors (e.g. typical glass) this decay in the sputtering rate is much less pronounced (about 2 times lower).23 Thus, in the experiments here for polymers we measured and compared the sputtering rate of pure Ar and the Ar + 4% O2 mixture. It turned out that the addition of oxygen increased the measured sputtering rate of the polymer by a factor of approximately 10 times. These results could be ascribed to the known fact that oxygen plasmas are reactive polymer etchants.24 Nevertheless, since data here presented are normalized with respect to the TIC, variations in the sputtering process are already considered.Sensitivity values measured in the afterglow for elemental ions using the Ar + 4% O2 mixture are collected in Table 3. It can be seen that only the Cl signal is clearly enhanced when adding oxygen into the plasma. Regarding polyatomic information found (see Fig. 4) it can be observed that higher normalized intensities are obtained both for PTFE and Tris (in the next section intensities of TBBPA will be discussed in Ar and Ar + O2 discharges). Despite the higher normalized intensities found when oxygen is added to the discharge gas, from Fig. 4a and b it is not clear that the m/z range of the extracted ions could be extended. This observation further supports the hypothesis suggested above referring to a poorer detection/extraction of high m/z negative ions.
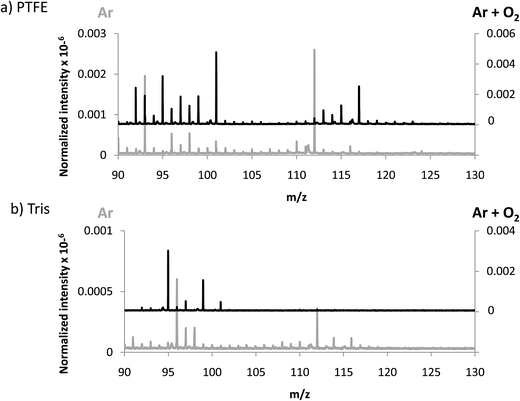 | ||
| Fig. 4 Averaged mass spectra (mV/TIC) obtained in negative mode using Ar and Ar + 4% O2 for (a) PTFE and (b) Tris, both contained in polyurethane matrix. | ||
BFR polymer screening
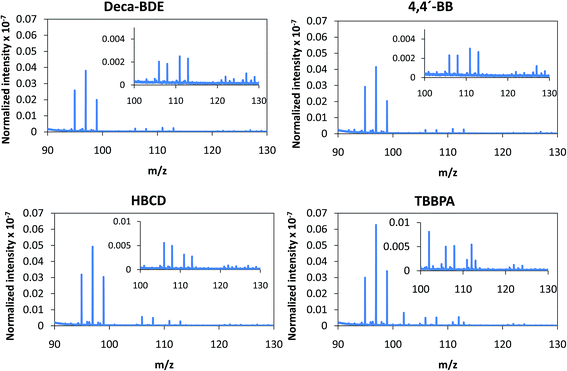
Despite the relatively low m/z of the detected polyatomics, the potential of the negative ion mode of PP-TOFMS for polymer fingerprinting was explored as well. Previous studies in our laboratory using positive ions (in a prototype without the quadrupole as ion guide/“blanking” and a sampler–skimmer distance of 7 mm) showed some characteristic polymer information and, subsequently, a certain degree of discrimination of BFRs was proved to be feasible.12 Thus, polymer discrimination using the negative ion mode was then attempted by analyzing four polyurethane layers each of them containing a different BFR: Deca-BDE, 4,4′-BB, HBCD and TBBPA. The four model samples were prepared containing about 27% w/w Br and were analyzed in negative mode at 110 Pa, 15 W keeping 1 ms pulse duration and 4 ms period (the best operation conditions previously selected for TBBPA). Above m/z = 80 most of the polyatomics appeared in the m/z = 100–130 range, and so this region was scrutinized to assess the capabilities of the negative ion formation for polymer fingerprinting. The results for each BFR studied are shown in Fig. 5. As observed in positive mode,12 relative ion abundances obtained were different from one sample type to another. For instance, Deca-BDE gave rise to a mass spectrum whose most intense peak occurred at m/z = 112 showing the most intense averaged spectra (together with 4,4′-BB). For comparison, this last sample showed the most intense averaged spectrum using the positive ion mode as well. 79Br16O21H3 (m/z = 114) and 81Br16O21H3 (m/z = 116) ions can only be explained as recombination in the plasma; in HBCD, these polyatomics show similar intensities to 79Br12C21H (m/z = 104), 79Br12C21H2 (m/z = 105), 81Br12C21H (m/z = 106) and 81Br12C21H2 (m/z = 107). For 4,4′-BB and TBBPA the ratio 79,81Br16O21H3 with respect to 79,81Br12C21H or to 79,81Br12C21H2 is lower compared to HBCD. Finally, 4,4′-BB and TBBPA can be distinguished from one another because of: (i) the presence of a polyatomic ion at m/z = 112 in the polymer containing 4,4′BB, and (ii) the different relative abundances obtained in the m/z 103–108 range (see Fig. 5). Similar to what has been demonstrated in positive mode,12 by selecting most abundant polyatomics for each of the polymeric layers it was possible to distinguish the different BFRs using LDA statistical analysis. Moreover, negative ion mode has permitted a simpler and faster identification due to the presence of less polyatomic ions as compared to positive mode.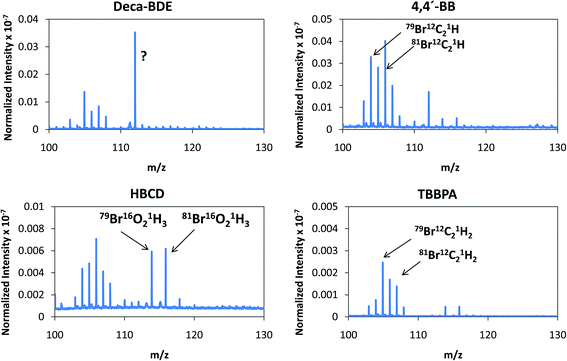 | ||
| Fig. 5 Afterglow averaged mass spectra (mV/TIC) in the m/z = 90–130 interval measured in negative mode (Deca-BDE, 4,4′-BB, HBCD and TBBPA at 110 Pa and 15 W using Ar as the discharge gas). | ||
Further ability of PP-TOFMS for BFR screening was attempted using the mixture Ar + 4% O2 as the discharge gas. Fig. 6 shows the averaged mass spectra obtained for each of the BFRs investigated in the m/z = 90–130 range. As described in the previous section, normalized intensities in negative mode are higher when oxygen is mixed with Ar as the discharge gas. The addition of oxygen not only makes the plasma more electronegative but also more reactive and, thus, more recombinations do occur in the plasma giving rise to the presence of polyatomics that could be different from those detected in the Ar discharge as shown in Fig. 6 (also in Fig. 4 for PTFE and Tris). In this case, it can be seen that oxygen has mined the characteristic polyatomic pattern of the BFRs detected in pure Ar discharge (Fig. 5). Moreover, even the normalized intensities are similar among all the BFRs and so identification of the different BFRs in this mode is made impossible when oxygen is added to the discharge.
Conclusions
A thorough comparison of the positive and negative ion detection mode is presented here for polymeric materials using the new PP-TOFMS instrument. Both elemental and molecular information has been investigated for a series of halogenated compounds embedded in a polyurethane matrix. Each of the polymeric layers studied contained at least one heteroatom: F, Cl, Br and P. As expected, the analytical sensitivity turned out to be higher with increasing analyte electron affinities when measuring the negative ions. Normalized ion intensities in positive and negative modes were about the same (even if polyatomics are not necessarily equal in the two MS modes). Interestingly, high m/z values were not obtained or detected in the negative mode. Using a rf-PGD-TOFMS prototype, polyatomics up to m/z = 400 have been detected for a PTFE layer.14 In other words, it seems that negative ions are either less prone to be formed or extracted in the new PP-TOFMS commercial configuration. It should be stressed, however, that our PP-TOFMS instrument has proved to provide a new way to identify the four BFRs directly in the solid layer. Therefore, it can simplify data treatment for this type of analysis.On the other hand, the addition of oxygen to the Ar plasma gas showed higher sensitivity and sputtering rates as compared to the Ar discharge. Unfortunately, identification of the different polymer compounds investigated turned out to be hindered, most likely due to reactions in the gas phase with the sputtered organic material.
Acknowledgements
This work was supported by project FC-15-GRUPIN14-092 (Principado de Asturias, Spain). Lara Lobo acknowledges financial support through program “Clarín-Cofund Marie Curie”, PA-ACB14-05.References
- J. Pisonero, N. Bordel, C. Gonzalez de Vega, B. Fernández, R. Pereiro and A. Sanz-Medel, Anal. Bioanal. Chem., 2013, 405, 5655–5662 CrossRef CAS PubMed.
- D. G. Jones, R. Payiling, S. A. Gower and E. M. Boge, J. Anal. At. Spectrom., 1994, 9, 369–373 RSC.
- T. E. Gibeau, M. L. Hartenstein and R. K. Marcus, J. Am. Soc. Mass Spectrom., 1997, 8, 1214–1219 CrossRef CAS.
- W. Schelles and R. van Grieken, Anal. Chem., 1997, 69, 2931–2934 CrossRef CAS PubMed.
- J. W. Coburn, E. W. Eckstein and E. Kay, J. Vac. Sci. Technol., 1975, 12, 151–154 CrossRef CAS.
- V. Moutarlier, S. Lakard, T. Patois and B. Lakard, Thin Solid Films, 2014, 550, 27–35 CrossRef CAS PubMed.
- A. Solá-Vázquez, A. Martín, J. M. Costa-Fernámdez, J. R. Encinar, N. Bordel, R. Pereiro and A. Sanz-Medel, Anal. Bioanal. Chem., 2007, 389, 683–690 CrossRef PubMed.
- D. Fliegel and D. Günther, Spectrochim. Acta, Part B, 2009, 64, 399–407 CrossRef PubMed.
- C. R. Shick, P. A. DePalma and R. K. Marcus, Anal. Chem., 1996, 68, 2113–2121 CrossRef CAS PubMed.
- N. Tuccitto, L. Lobo, A. Tempez, I. Delfanti, P. Chapon, S. Canulescu, N. Bordel, J. Michler and A. Licciardello, Rapid Commun. Mass Spectrom., 2009, 23, 549–556 CrossRef CAS PubMed.
- L. Lobo, N. Tuccitto, N. Bordel, R. Pereiro, J. Pisonero, A. Licciardello, A. Tempez, P. Chapon and A. Sanz-Medel, Anal. Bioanal. Chem., 2010, 396, 2863–2869 CrossRef CAS PubMed.
- C. González de Vega, L. Lobo, B. Fernández, N. Bordel, R. Pereiro and A. Sanz-Medel, J. Anal. At. Spectrom., 2012, 27, 318–326 RSC.
- C. González de Vega, B. Fernández, N. Bordel, R. Pereiro and A. Sanz-Medel, J. Anal. At. Spectrom., 2013, 28, 1054–1060 RSC.
- S. Canulescu, J. Whitby, K. Fuhrer, M. Hohl, M. Gonin, T. Horvath and J. Michler, J. Anal. At. Spectrom., 2009, 24, 178–180 RSC.
- S. Canulescu, I. S. Molchan, C. Tauziede, A. Tempez, J. A. Whitby, G. E. Thompson, P. Skeldon, P. Chapon and J. Michler, Anal. Bioanal. Chem., 2010, 396, 2871–2879 CrossRef CAS PubMed.
- C. González-Gago, J. Pisonero, R. Sandín, J. F. Fuertes, A. Sanz-Medel and N. Bordel, J. Anal. At. Spectrom., 2015 10.1039/C5JA00104H.
- C. González-Gago, N. Bordel, R. Pereiro and A. Sanz-Medel, J. Mass Spectrom., 2011, 46, 757–763 CrossRef PubMed.
- G. Lotito and D. Günther, Int. J. Mass Spectrom., 2012, 315, 60–65 CrossRef CAS PubMed.
- A. Bogaerts, J. Anal. At. Spectrom., 2007, 22, 502–512 RSC.
- A. C. Muñiz, J. Pisonero, L. Lobo, C. González, N. Bordel, R. Pereiro, A. Tempez, P. Chapon, N. Tuccito, A. Licciardello and A. Sanz-Medel, J. Anal. At. Spectrom., 2008, 23, 1239–1246 RSC.
- M. Bouza, B. Fernández, C. González-Gago, N. Bordel, R. Pereiro and A. Sanz-Medel, Anal. Chim. Acta, 2012, 756, 30–36 CrossRef CAS PubMed.
- S. Mushtaq, J. C. Pickering, E. B. M. Steers, P. Horvath, J. A. Whitby and J. Michler, J. Anal. At. Spectrom., 2011, 26, 1746–1755 RSC.
- B. Fernández, N. Bordel, R. Pereiro and A. Sanz-Medel, J. Anal. At. Spectrom., 2003, 18, 151–156 RSC.
- F. D. Egitto, Pure Appl. Chem., 1990, 62, 1699–1708 CrossRef CAS.
| This journal is © The Royal Society of Chemistry 2016 |

