 Open Access Article
Ethyl acetate extract of crabapple fruit is the cholesterol-lowering fraction
Dongshan Wang†
,
Yingchun Wu†,
Chuhe Liu,
Yahui Wang,
Yin Li,
Lingling Luo,
Yuanyuan Zhao,
Zunli Ke,
Cheng Huang * and
Shengjie Fan*
School of Pharmacy, Shanghai University of Traditional Chinese Medicine, Shanghai 201203, China. E-mail: chuang@shutcm.edu.cn; Shengjiefan@shutcm.edu.cn
First published on 5th September 2017
Abstract
Hypercholesterolemia is highly associated with cardiovascular diseases (CVDs) such as atherosclerosis. Our previous study showed that extracts of crabapple fruit may decrease serum total cholesterol (TC) and low-density lipoprotein cholesterol (LDL-c) in high-fat diet-induced obese mice. To investigate which bioactive component is responsive for cholesterol-lowering effect in crabapples and whether the component has effects on atherosclerosis, three different chemical fractions were isolated from ethanol extract of crabapples, and obese C57BL/6 mice fed with a high-fat diet and arteriosclerotic low-density lipoprotein receptor deficiency (LDLR−/−) mice fed with a western-diet (WD) were involved in our pharmacological studies. The results showed that ethyl acetate extract of crabapple (EAC) significantly decreased serum TC in both DIO and LDLR−/− mice. EAC also improved obesity, insulin resistance, lipid accumulation in the liver tissue in the DIO mice and prevented atherosclerotic plaque formation in LDLR−/− mice. Mechanistic study showed that EAC increased cholesterol excretion in the feces of DIO and LDLR−/− mice, and elevated CYP7A1 mRNA in HepG2 cell and inhibited cholesterol accumulation in the cell membrane. Our data suggest that EAC may lower serum TC and block atherosclerotic plaque via the inhibition of intestinal cholesterol absorption and TC synthesis in the liver, and EAC may be used as a dietary supplement on hypercholesterolemia and atherosclerosis.
Introduction
The prevalence of hyperlipidemia is increasing worldwide, which is a lifelong chronic metabolic disease.1,2 Epidemiological studies demonstrate that elevated levels of plasma TC and LDL-c are the major risk factors of chronic cardiovascular diseases (CVDs) such as atherosclerosis, myocardial infarction and stroke.3 The World Health Organization (WHO) estimated that approximately one-third of all cardiovascular disease worldwide is caused by high cholesterol.4–6 Consequently, regulation of cholesterol homeostasis is one of significant approaches to prevent atherosclerosis and CVDs development.Statins are one of the mainstay of pharmacotherapy for hypercholesteremia.7 However, some studies showed long-term utility of these anti-hypercholesterolemia drugs may cause serious adverse effects including liver and kidney damage, myopathy, rhabdomyolysis and transaminase elevation.8–10 The newest two FDA-approved PCSK9 inhibitors are well known as the treatment of hyperlipidemia.11 However, they did not meet “generally accepted” cost-benefit thresholds.12
For years, nutraceuticals offer a safe and cost-effective option for long-term treatment of hypercholesteremia.13 Crabapples, belonging to the genus of the family Rosaceae, are important ornamental plants widely distributed throughout the world. The crabapple fruits have been used as food and nutritional supply. Additionally, their fruits, flowers and roots are rich in polyphenols, flavonoids and dihydrochalcones which have managed in prevention and treatment of various diseases including digestive disease, cardiomyopathy, accelerated aging, tumor, and metabolism disorder.14–18 Recently, we have confirmed that the extracts of crabapple fruits could lower serum cholesterol and LDL-c in high-fat diet-induced C57BL/6 obese mice.19 However, the bioactive components for cholesterol lowering are unrevealed. Furthermore, whether the extracts can prevent atherosclerotic plaque formation is unknown.
In the present study, we refined several fractions, including ethyl acetate extract of crabapples (EAC). Pharmacological studies showed EAC decreased serum cholesterol in high-fat diet induced obesity mice and prevented atherosclerotic plaques formation in LDLR−/− mice. Additionally, EAC regulated CYP7A1 mRNA expression in mice livers and cholesterol biosynthesis in HepG2 human liver cell line, indicating that ethyl acetate fraction may be the bioactive component and the cholesterol-lowering effect of EAC may achieve through CYP7A1 pathway.
Materials and methods
Preparation and extractions
Fresh crabapple fruits were obtained from Crabapple R&D Company (Huailai, Hebei, China). The fruits were dried in electrothermal drying oven (DHG-9140A, China). Two kg of dried crabapples were extracted with 8 L ethanol by ultrasonic (KX, China) for 3 times each 1 h. Then, the extract was concentrated at 40 °C with a rotary evaporator (EYELA N-1100S-W, Japan) under reduced pressure. The extracts were dissolved in 2 L water and sequentially partitioned with chloromethane, ethyl acetate and n-butanol (Sinopharm Chemical Reagent Co., Ltd, Beijing, China) for three times, respectively. Finally, different fractions including chloromethane extract of crabapple (CC), ethyl acetate extract of crabapple (EAC) and n-butanol extract of crabapple (BC) were freeze-dried to powder by cryogenic dryer (Christ Alpha 1-2 LD plus, Germany) and stored at −80 °C until use.EAC was isolated through silica gel 60 GF254 (60–100 mesh, Merck) using chloromethane and methanol at ratio of 20![[thin space (1/6-em)]](https://www.rsc.org/images/entities/char_2009.gif) :
:![[thin space (1/6-em)]](https://www.rsc.org/images/entities/char_2009.gif) 1, 15
1, 15![[thin space (1/6-em)]](https://www.rsc.org/images/entities/char_2009.gif) :
:![[thin space (1/6-em)]](https://www.rsc.org/images/entities/char_2009.gif) 1, 10
1, 10![[thin space (1/6-em)]](https://www.rsc.org/images/entities/char_2009.gif) :
:![[thin space (1/6-em)]](https://www.rsc.org/images/entities/char_2009.gif) 1, 5
1, 5![[thin space (1/6-em)]](https://www.rsc.org/images/entities/char_2009.gif) :
:![[thin space (1/6-em)]](https://www.rsc.org/images/entities/char_2009.gif) 1, and 1
1, and 1![[thin space (1/6-em)]](https://www.rsc.org/images/entities/char_2009.gif) :
:![[thin space (1/6-em)]](https://www.rsc.org/images/entities/char_2009.gif) 1. Fractions were obtained from this separation (1–15) by analyzing of the thin-layer chromatography (TLC). Compounds were purified and isolated by with RP-18 reverse phase silica gel (YMC Co., Ltd, Tokyo), Sephadex LH-20 column chromatography (GE Healthcare Bio-Sciences AB, USA) and semi-preparative HPLC (Agilent Technologies, Santa Clara, CA, USA).
1. Fractions were obtained from this separation (1–15) by analyzing of the thin-layer chromatography (TLC). Compounds were purified and isolated by with RP-18 reverse phase silica gel (YMC Co., Ltd, Tokyo), Sephadex LH-20 column chromatography (GE Healthcare Bio-Sciences AB, USA) and semi-preparative HPLC (Agilent Technologies, Santa Clara, CA, USA).
The chemical construction of three compounds separating from EAC were identified by 1H NMR and 13C NMR spectroscopy analysis. Compound 1 was a white powder, 1H NMR (600 MHz, CDCl3) spectroscopic data showed δ 5.34 (1H, brd, J = 5.1 Hz, H-6), 3.54 (1H, m, H-3), 1.01 (3H, s, H-19), 0.91 (3H, d, J = 6.4 Hz, H-21), 0.85 (3H, t, J = 7.5 Hz, H-29), 0.84 (3H, d, J = 6.8 Hz, H-26), 0.81 (3H, d, J = 6.8 Hz, H-27), 0.68 (3H, s, H-18); 13C NMR (150 MHz, CDCl3) spectroscopic data showed δ 141.0 (C-5), 121.9 (C-6), 72.0 (C-3), 57.0 (C-14), 56.3 (C-17), 50.3 (C-9), 46.0 (C-24), 42.4 (C-13), 42.5 (C-4), 40.0 (C-12), 37.9 (C-1), 36.7 (C-10), 36.4 (C-20), 34.2 (C-22), 32.1 (C-7), 32.1 (C-8), 31.8 (C-2), 29.4 (C-25), 28.5 (C-16), 26.3 (C-23), 24.5 (C-15), 23.4 (C-28), 21.4 (C-11), 20.1 (C-26), 19.6 (C-19), 19.3 (C-27), 19.0 (C-21), 12.2 (C-18), 12.1 (C-29). Compound 2 was a white amorphous powder, 1H NMR (600 MHz, CDCl3) spectroscopic data showed δ 5.48 (1H, brs, H-12), 3.59 (1H, d, J = 7.0 Hz, H-3), 1.23 (3H, d, J = 6.5 Hz, H-29), 1.19 (3H, s, H-27), 1.04 (3H, s, H-25), 1.03 (3H, s, H-24), 1.03 (3H, s, H-26), 1.01 (3H, s, H-23), 0.88 (1H, d, J = 6.5 Hz, H-30); 13C NMR (150 MHz, CDCl3) spectroscopic data showed δ 179.7 (C-28), 139.0 (C-13), 125.4 (C-12), 77.9 (C-3), 55.6 (C-5), 53.3 (C-18), 47.8 (C-17), 47.8 (C-9), 42.3 (C-14), 39.7 (C-4), 39.3 (C-19), 39.1 (C-8), 39.1 (C-1), 38.8 (C-20), 37.2 (C-10), 37.0 (C-22), 33.3 (C-7), 30.8 (C-21), 28.5 (C-15), 28.4 (C-23), 27.8 (C-2), 24.6 (C-16), 23.6 (C-27), 23.4 (C-11), 21.1 (C-30), 18.5 (C-6), 17.3 (C-29), 17.2 (C-26), 16.9 (C-25), 15.4 (C-24). Compound 3 was a white amorphous powder, 1H NMR (600 MHz, CD3OD) spectroscopic data showed δ 7.06 (2H, d, J = 8.4 Hz, H-2′, 6′), 6.68 (2H, d, J = 8.4 Hz, H-3′), 6.15 (1H, d, J = 1.4 Hz, H-3′), 5.95 (1H, d, J = 1.4 Hz, H-5′), 5.86 (2H, brs, H-6, 8), 5.03 (1H, d, J = 6.8 Hz, H-1′′), 3.30–3.91 (6H, m, H-2′′–6′′), 3.45 (1H, t, J = 8.0 Hz, H-α), 2.87 (2H, t, J = 8.0 Hz, H-β); 13C NMR (150 MHz, CD3OD) spectroscopic data showed δ 204.2 (C-4), 164.6 (C-7), 164.2 (C-5, 9), 155.4 (C-4′), 131.6 (C-1′), 129.1 (C-2′, 6′), 115.1 (C-3′, 5′), 103.7 (C-10), 94.7 (C-6, 8), 102.1 (C-1′′), 98.1 (C-7), 92.4 (C-5), 78.5 (C-5′′), 77.7 (C-3′′), 74.3 (C-2′′), 71.2 (C-4′′), 62.3 (C-6′′), 45.4 (C-α), 29.5 (C-β).
High-performance liquid chromatography (HPLC) analysis
HPLC analysis was performed on an Agilent 1200 series HPLC system (Agilent Technologies, Santa Clara, CA, USA). Samples were dissolved in a mobile phase acetonitrile–water with the final concentration of 1% (1![[thin space (1/6-em)]](https://www.rsc.org/images/entities/char_2009.gif) :
:![[thin space (1/6-em)]](https://www.rsc.org/images/entities/char_2009.gif) 1, v/v). After filtration by Millipore membrane (0.45 μm) syringe filter, 10 μL samples were taken by with a UV-DAD detector at a λ max of 210 nm. An autoinfection Agilent Extend-C18 of HPLC column (5 μm, 4.6 × 250 mm) was monitored to separate at 30 °C. The samples were analyzed using a solvent system with 0.1% formic acid in water (A) and acetonitrile (B) under the following the method: 0–20 min, 5% B; 20.01 min, 85% B; 30 min, 95% B at a flow rate of 1.0 mL min−1. Retention time of β-sitosterol, ursolic acid, phlorizin was compared to EAC.
1, v/v). After filtration by Millipore membrane (0.45 μm) syringe filter, 10 μL samples were taken by with a UV-DAD detector at a λ max of 210 nm. An autoinfection Agilent Extend-C18 of HPLC column (5 μm, 4.6 × 250 mm) was monitored to separate at 30 °C. The samples were analyzed using a solvent system with 0.1% formic acid in water (A) and acetonitrile (B) under the following the method: 0–20 min, 5% B; 20.01 min, 85% B; 30 min, 95% B at a flow rate of 1.0 mL min−1. Retention time of β-sitosterol, ursolic acid, phlorizin was compared to EAC.
Total polyphenol and flavonoid content analysis in EAC
The contents of total polyphenol and flavonoid in the EAC were tested by using methods of Folin–Ciocalteu and colorimetric respectively as previously reported.20 Results of total polyphenol and total flavonoids contents were presented as milligram of gallic acid of EAC or rutin per gram of EAC.Animal experiments
Animal experiments were conducted in accordance with the guidelines and regulations of the Ethics Committee of Shanghai University of Traditional Chinese Medicine (Approved Number: 2015017). Male C57BL/6 mice were obtained from the SLAC Laboratory (Shanghai, China) at the six-week-old. The mice were housed under controlled temperature (22–23 °C) with a 12 h light/dark cycle. After the adaptation period, the mice were fed with a high-fat (HF) diet (60% of calories derived from fat, 5.24 kcal g−1, Research Diets, D12492) for 3 months to induce obesity.21 For effective fraction screening, the diet-induced obese (DIO) mice were randomly grouped into HF diet or HF diet mixed with (CC, BC and EAC, 0.1%, w/w) and an ethanol extract (EC) group (1%, w/w) and treated for 2 weeks. For EAC study, the DIO mice were randomly grouped and treated with 0.015% atorvastatin (Tianfang Pharmaceuticals, China) as a positive control, or different concentrations of EAC (0.1%, 0.2%, 0.5%) or HF diet continuously along with chow diet (10% of calories derived from fat, Research Diets no. D12450B) as a lean control for 2 weeks. All diet and water were provided freely. Body weight and food intake were recorded every other day.The LDLR−/− mice were purchased from Animal Center, Nanjing University (Nanjing, China). Five-week-old male LDLR−/− mice were randomly divided and fed with a Western diet (HC, 0.21% cholesterol, 41% of calories derived from fat, 4.7 kcal g−1, Research Diets no. D12079B) or a Western diet mixed with atorvastatin (0.015%) or EAC (0.1%, 0.2%, and 0.5%) along with chow diet for 14 weeks.22 Body weight and food intake were measured every other day.
Intraperitoneal glucose tolerance test (IPGTT)
At the end of treatments, the DIO and LDLR−/− mice were fasted overnight. The glucose levels were tested from the tail vein (0 min). Then, glucose (1 g per kg body weight) was intraperitoneally injected and additional blood glucose levels were measured at regular intervals (15, 30, 60, 90 and 120 min).Serum biochemistry analysis
At the end of the experiments, the heart blood samples were collected after anesthesia (urethane, 20%, w/v).23 Blood samples were centrifuged at 3000 rpm for 15 min to separate serum. Serum triglyceride (TG), TC, high-density lipoprotein cholesterol (HDL-c) and LDL-c, alanine aminotransferase (ALT), aspartate transaminase (AST) levels were measured by using an automatic analyzer (Hitachi 7020, Tokyo, Japan) with 150 μL of heart blood serum.Hematoxylin and eosin (H&E) staining
For analysis the morphology of liver tissue, the liver samples were fixed in 4% paraformaldehyde, embedded in paraffin and sliced into 10 μm sections according to a standard procedure. The sections were stained with H&E. Images were then examined under a microscope (Zeiss, Germany).Liver and fecal lipid content analysis
The liver tissues (50 mg) were weighed and suspended with 0.5 mL lysis buffer (20 mM Tris–HCl, pH 7.5, 150 mM NaCl, and 1% Triton) and an equal volume of chloroform to test the lipid concentration of liver. The chloroform layer was separated, dried, and finally dissolved in 100 μL of isopropyl alcohol to measure the TG and TC levels as described.24 The mouse feces were collected over the final 3 days and freeze-dried and then grinded. Fecal lipids was extracted and measured using the same method as liver concentrations.Cell culture
HepG2 cells on the cover slide were grown in DMEM without serum for 24 h. Then the cells were transferred to DMEM containing 10% fetal bovine serum (Hyclone, Logan, UT, USA), and treated with EAC, β-sitosterol, ursolic acid, phlorizin, or pravastatin at the indicated concentrations. After 24 h treatment, the cell fixed in 4% paraformaldehyde for 10 min, and incubated with 100 μL of cholesteryl BODIPY (Life Technologies, Sigma, USA) for 30 min at 37 °C. Then the cell was counterstained with 3.2 μL of Fluoroshield DAPI (Life Science, Sigma, USA). Pictures were taken using a fluorescence microscope (Zeiss, Germany).Quantitative real-time polymerase chain reaction (qRT-PCR)
qRT-PCR was performed as previous described.20 Briefly, total RNA from DIO mouse livers were isolated using the TRIzol (Takara, Tokyo, Japan) according to the protocol of manufacturer.25 The first-strand cDNA was synthesized with a RevertAid First Strand cDNA synthesis kit (Thermo Scientific, Wilmington, Delaware, USA). The gene expression levels were analyzed by the quantitative real-time PCR using an ABI StepOnePlus Real-Time PCR system (Applied Biosystems, CA, USA). The sequences of the primers (Generay Biotech Co., Ltd, Shanghai, China) used in the experiment were shown in Table 1. The mRNA levels were normalized using β-actin as an internal reference.| Gene | Forward primer | Reverse primer |
|---|---|---|
| β-Actin | TGTCCACCTTCCAGCAGATGT | AGCTCAGTAACAGTCCGCCTAGA |
| LXRα | GAGTGTCGACTTCGCAAATGC | CCTCTTCTTGCCGCTTCAGT |
| CYP7A1 | GTGGTAGTGAGCTGTTGCATATGG | CACAGCCCAGGTATGGAATCA |
| APOE | GAACCGCTTCGGGTTGATTCCAAA | TCAGTGCCGTCAGTTCTTGTG |
| LDLR | CTCCACTCTA TGGGATTACCT | ACTGAAAATGGCTTCGTTTATGAC |
| SREBP-2 | ACAACACTGACCAGCACCCATAC | AAGACGCTCAAGACAATCACACC |
Analysis of atherosclerotic plaque
The anatomy of aortic vessels were stained with Sudan IV for 15 min, then destained 10 min using 80% ethanol to quantify atherosclerosis of the aortic arch, which is easy to develop atherosclerotic plaque. Sudanophilic lesions were assessed by microscope (Lecia, German) computer-assisted image analysis and calculated the area of plaque.Statistical analysis
The results are expressed as mean ± SEM. Data analyses were performed using SPSS 21.0 for windows statistical program. Statistical analysis was programmed by one-way analysis of variance (ANOVA). Difference was regarded as significant (*P < 0.05).Results
EAC is cholesterol-lowering faction in crabapples
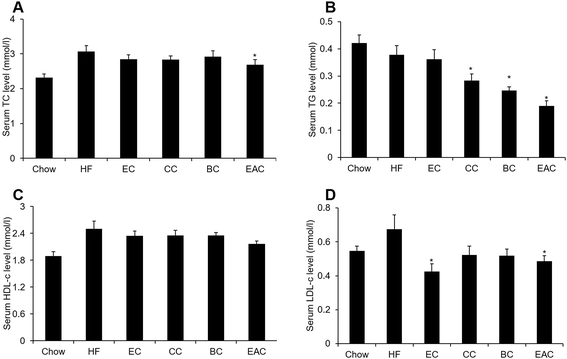
Our pervious study showed that ethanol extract of crabapple fruits had anti-hypercholesteremia effect.19 To identify the bioactive fraction for the treatment of hyperlipidemia, the crabapple extract was refined with chloromethane, n-butanol and ethyl acetate to obtain three fractions: chloromethane extract (CC), n-butanol extract (BC) and ethyl acetate extract (EAC).To assay the cholesterol-lowering bioactive component of crabapples, male C57BL/6 mice were fed with high-fat diet (HF) to induce obesity (DIO) for 3 months. The crabapple fractions CC, BC and EAC were mixed into high-fat diet at 0.1%, w/w. An ethanol extract mixed at 1%, w/w was used for control. After 2 weeks of the treatment on the DIO mice, 0.1% of EAC reduced serum TC, TG and LDL-c remarkably, while EAC did not change HDL-c (Fig. 1A–D), suggesting EAC may have effect on hyperlipidemia than other 2 fractions.
Chemical composition analysis of EAC
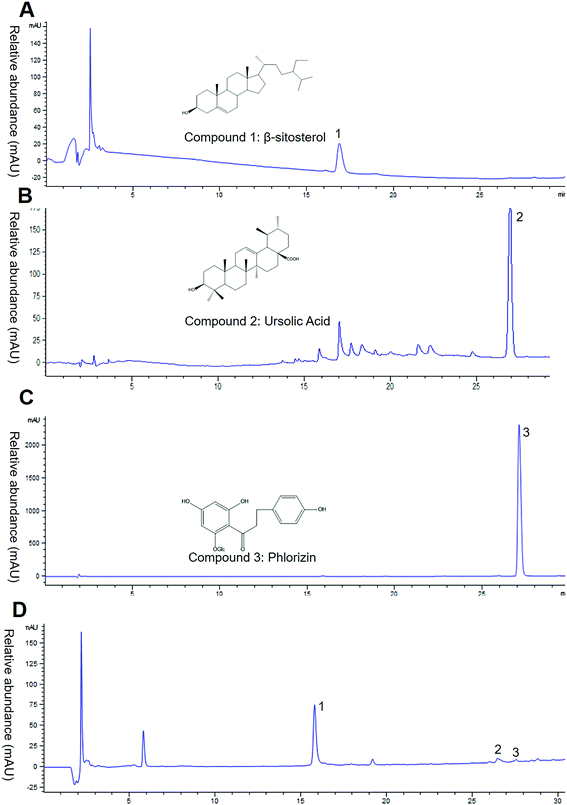
Based on the result above, the EAC seemed the bioactive component of crabapples. To investigate the main components of EAC, we measured total polyphenol and flavonoid with Folin–Ciocalteu and colorimetric assay. The data showed that total polyphenol content was 614.90 ± 15.20 mg gallic acid equivalents per g EAC, total flavonoid was 206.82 ± 8.61 mg rutin equivalents per g EAC, indicating that EAC were rich in flavonoids and polyphenols, which similar to the previous studies.26–28We then analyzed the major three compounds purified from crabapples. Contrasted the NMR spectrum data with literature,29–31 the compound 1, 2, 3 were identified β-sitosterol, ursolic acid and phlorizin (Fig. 2A–C). Then we analyzed EAC components by High Performance Liquid Chromatography (HPLC) with a UV-DAD detector at a λ max of 210 nm. Under this condition, only 3 chromatographic peaks were determined (Fig. 2D), except for the solvent peak. Comparing with the retention times of standard controls, we identified the 3 peaks were same as β-sitosterol, ursolic acid and phlorizin (Fig. 2B–D), suggesting that the major contents in EAC are β-sitosterol, ursolic acid and phlorizin.
EAC improves metabolic disorders in DIO mice
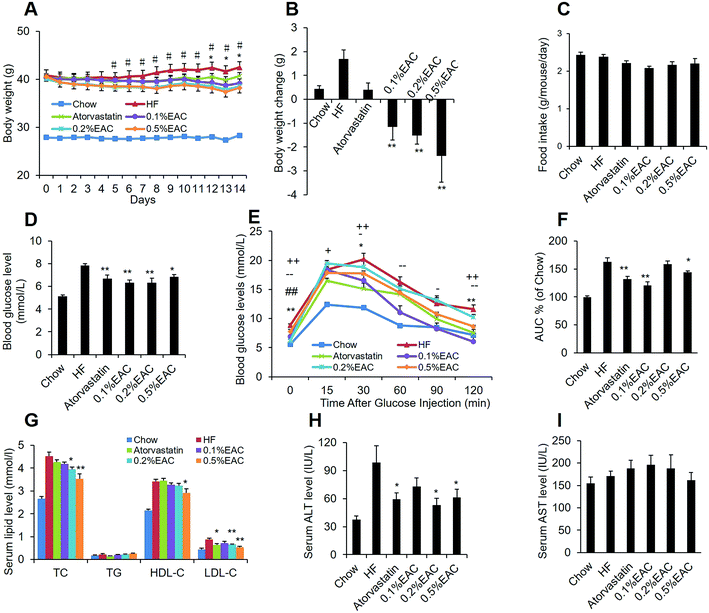
To test the effect of EAC on metabolic disorders, the DIO mice were randomly divided into 5 groups and treated with different dosages of EAC (0.1%, 0.2%, 0.5%, w/w) mixed into a HF diet or with atorvastatin (0.015%, w/w) as a positive control or fed with a high-fat diet alone. After 2 week treatment, high-fat diet increased body weight while atorvastatin increased slimly (Fig. 3A and B). However, EAC decreased body weight dose-dependently without change of food intake (Fig. 3A–C), indicating body weight loss of EAC was not relevant with food intake.Blood glucose homeostasis is closely related to lipid metabolism.32,33 To investigate EAC effect on glucose and lipid balance, fasting blood glucose and short-term effects of EAC on the blood glucose levels of the DIO mice were tested. As expected, high-fat diet induced higher fasting blood glucose levels and impaired glucose tolerance, compared to the chow control mice (Fig. 3D–F). Atorvastatin and three different concentration of EAC decreased fasting blood glucose in DIO mice (Fig. 3D). EAC, especially 0.1% and 0.5% of EAC, also reduced blood glucose at different time point (30 min, 60 min, 120 min) after i.p. injection of glucose comparing with HF in IPGTT (Fig. 3E). The total area under the curve (AUC) of blood glucose levels between 0 and 120 min showed 0.1%, 0.5% of EAC and atorvastatin were significantly lowered than HF group while there was no change on 0.2% of EAC (Fig. 3F). The results indicated that EAC could decrease the fasting blood glucose and improve the glucose tolerance in DIO mice.
Importantly, serum TG, TC, LDL-c and HDL-c levels were increased significantly in HF group comparing with chow group. However, 0.2% and 0.5% of EAC reduced TC and LDL-c markedly with a dose-dependent manner (Fig. 3G). Moreover, high concentration of EAC decreased HDL-c. Interestingly, the positive control, 0.015% of atorvastatin reduced LDL-c, but not TC in DIO mice (Fig. 3G), indicating that 0.2% and 0.5% of EAC had anti-hyperlipidemia effect, especially on cholesterol.
Serum ALT and AST are commonly biomarkers for identification of liver health.34 Fig. 3H showed HF increased obviously indicating that high-fat diet can induce liver tissue damage. However, 0.2% and 0.5% of EAC as well as atorvastatin decreased significantly serum ALT levels dose-dependently (Fig. 3H), but not the serum AST (Fig. 3I), indicating that EAC could improve liver damage.
EAC ameliorates hepatic steatosis in DIO mice
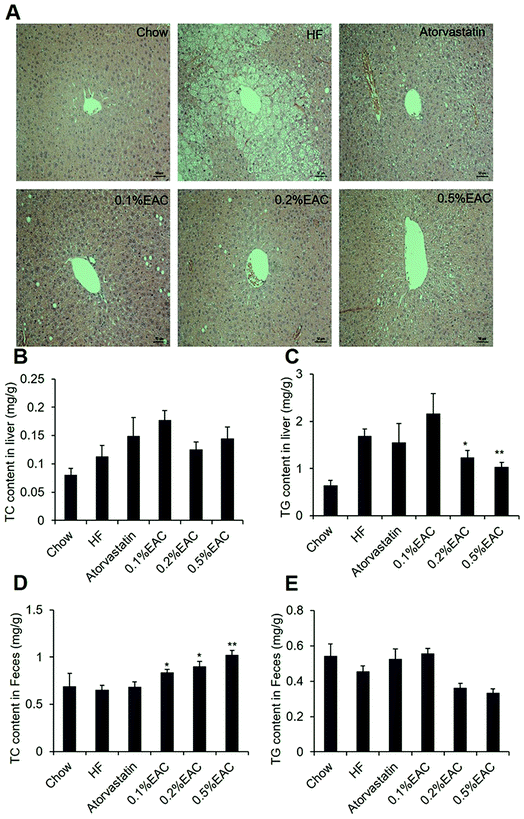
Liver is an important organ for lipid metabolism. Obese mice usually develop fatty liver, even hepatic steatosis, due to excess storage of fat in liver.35 To test whether EAC may alleviate fatty liver, we performed H&E staining to observe liver structure of the mice. As expected, HF group showed obviously lipid droplets in liver compared to Chow group (Fig. 4A). However, different concentrations of EAC-treated and atorvastatin group showed much less lipid droplets comparing with HF group with a dose-dependent manner (Fig. 4A atorvastatin, 0.1% EAC, 0.2% EAC and 0.5% EAC), while lipid accumulation in atorvastatin seemed more effective than high concentration of EAC.As known, accumulation of triglycerides (TG) in hepatocytes is the main cause of fatty liver formation.36 Thus, we measured TG and TC level in liver tissues (Fig. 4B and C). Comparing with Chow group, TG content in HF group was highly increased. In accordance with HE staining, 0.2% and 0.5% of EAC lowered TG dose-dependently, while no change in atorvastatin (Fig. 4B). However, there was no difference among the 6 groups in TC content in liver (Fig. 4C). These data indicate that EAC prevents liver damage and fatty liver formation in DIO mice.
Furthermore, we measured cholesterol and triglyceride contents in mouse feces. Fig. 4D showed that AC increased TC contents in feces with a severe dose-dependent pattern when compared with HF group, suggesting that EAC inhibited the absorption of TC in the intestine. However, EAC treatment had no effect on TG in feces (Fig. 4E).
Taken together, EAC decreased serum TC and LDL-c levels, inhibited lipid accumulation in liver and TC absorption in the intestine in DIO mice.
EAC prevents the hypercholesterolemia in the LDLR−/− mice
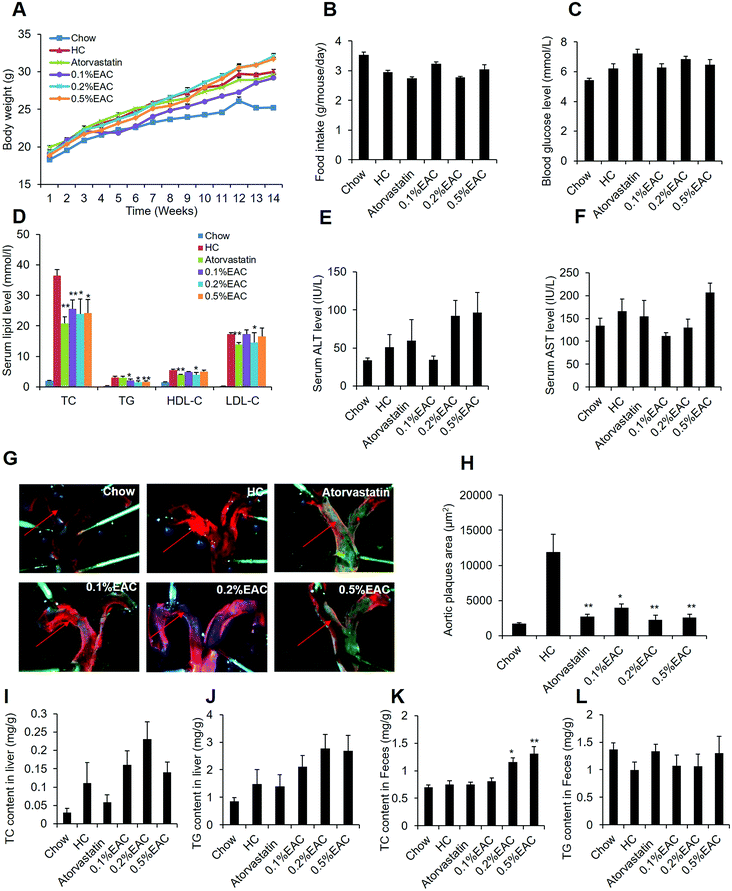
To further confirm the anti-hypercholesterolemia effect of EAC, LDL receptor-knockout (LDLR−/−) mice were involved in our study, which is a proper model for hypercholesterolemia and atherosclerosis.37,38 LDLR−/− mice were fed with Western diet with high-cholesterol for 14 weeks to induce hypercholesterolemia and atherosclerotic plaque. Meanwhile, the mice were treated with different dosage of EAC (0.1%, 0.2%, and 0.5%) or atorvastatin (0.015%) as a positive control with chow diet as the regular control (Chow). After 14 week treatment, EAC had no effect on body weight, food intake or fasting blood glucose in LDLR−/− mice (Fig. 5A–C). However, 3 different concentrations of EAC decreased serum TC and TG levels comparing with HC group in LDLR−/− mice, while atorvastatin decreased TC, but not TG (Fig. 5D). And 0.2% of EAC showed also decreased HDL-c and LDL-c as well as atorvastatin (Fig. 5D). These data confirmed that EAC has anti-hypercholesterolemia effect in vivo.Additionally, the aortic arch were peeled off and stained with Sudan IV to observe the aortic plaque formation (Fig. 5G). Comparing with Chow, HC appeared obvious red aortic plaques and the biggest aortic plaque area (Fig. 5H) among the 6 groups. However, the aortic plaque area was much less in atorvastatin and EAC groups (Fig. 5G and H), suggesting that EAC can inhibit aortic plaque formation in LDLR−/− mice induced by HC diet.
We also measured serum ALT and AST (Fig. 5E and F), TC and TG in the liver tissues (Fig. 5I and J). However, the data showed that EAC could not change any of them. Interestingly, in agreement with the DIO data, EAC increased TC in LDLR−/− mouse feces dose-dependently (Fig. 5K) but not TG in feces (Fig. 5L), which indicated that EAC could inhibit TC absorption in intestines.
EAC and its small molecules inhibit the cholesterol biosynthesis in HepG2 cells
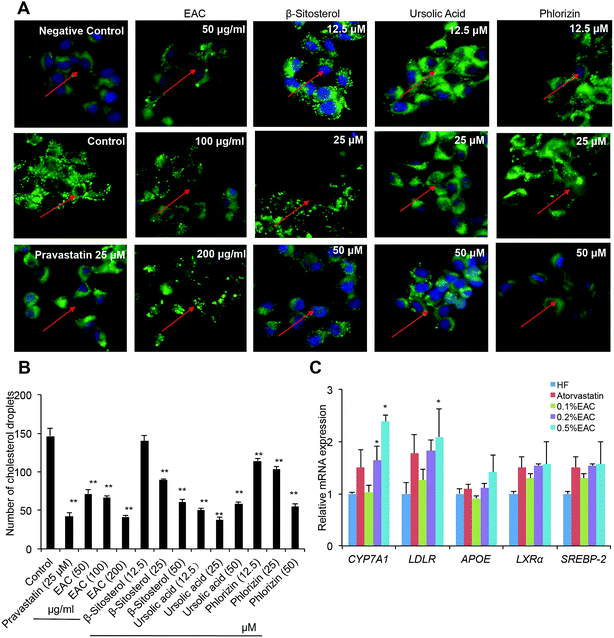
As known, cholesterol-lowering strategies are mainly through reducing the absorption, promoting excretion, and decreasing the synthesis of cholesterol.39 Our results had proved that EAC increased fecal TC to promote cholesterol excretion. Whether EAC could affect cholesterol biosynthesis was unknown. To further investigate the mechanism of EAC effect on cholesterol-lowering, a BODIPY-cholesterol assay was used for visualizing membrane cholesterol accumulation in HepG2 cells.The culture medium induced cholesterol accumulation on cell membrane comparing with non-serum medium (Fig. 6A, negative control). Pravastatin (25 μM) reduced cholesterol fluorescence signal dramatically (Fig. 6A). In addition, three different dose of EAC (50, 100, 200 μg mL−1) decreased cholesterol accumulation on cell membrane in a dose-dependent pattern (Fig. 6A). Interestingly, the 3 small compounds extracted from EAC, β-sitosterol, ursolic acid, phlorizin, also showed significant reduction of cholesterol fluorescence signal dose-dependently (Fig. 6B), indicating that EAC as well as its molecular components could inhibit cholesterol biosynthesis in vitro.
EAC regulates the expression of cholesterol metabolic genes in the liver of DIO mice
It had been confirmed that EAC, the bioactive component refined from crabapples, has a potent effect on lowering TC in different mouse model. However, its anti-hypercholesteremia mechanism required further study. Since our previous data showed crabapples can active CYP7A1 signaling specifically,19 we tested lipid metabolism related gene expression including CYP7A1 in DIO mouse liver. As expected, 0.2% and 0.5% of EAC increased CYP7A1 mRNA expression with a dose-dependent manner while low concentration of EAC (0.1%) showed no effect (Fig. 6C) comparing with HF. 0.5% of EAC also increased LDLR expression. However, there was no change between EAC and HF on APOE, LXRα or SREBP-2 expression (Fig. 6C). Taken together, EAC up-regulated CYP7A1 expression particularly to reducing serum TC, improving fatty liver and preventing atherosclerosis.Discussion
Our previous study showed ethanol extracts (EC) of crabapple fruits have therapeutic effect on hypercholesterolemia though CYP7A1 signaling.19 However, the bioactive component and the potential mechanism of anti-hypercholesterolemia remains further studies. In this study, we used the EAC from crabapples and confirmed that EAC lowered serum cholesterol dose-dependently in DIO mice. Additional, EAC lowered serum TC and blocked atherosclerotic plaque formation in LDLR−/− mice. Further, the mechanism study showed that EAC increased CYP7A1 mRNA level in DIO mouse liver tissue. We identified that β-sitosterol, ursolic acid and phlorizin are three major components in EAC and the compounds inhibited cholesterol biosynthesis in vitro. This result is agreement to the previous reports that show β-sitosterol, ursolic acid and phlorizin have an effect on lipid metabolism.40–42 Thus, it is possible that β-sitosterol, ursolic acid and phlorizin responsible for the cholesterol-lowering effects of crabapple.High-fat diet induced obesity (DIO) mice is one of authority animal model to mimic metabolic syndrome with obesity, diabetes, dyslipidemia and fatty liver.43 Although EAC decreased body weight gain in DIO mice without changing energy input, and decreased fasting blood glucose and improved glucose tolerance (Fig. 3), the reason is unclear. If this beneficial effect on obesity and diabetes relays on EAC anti-hypercholesterolemia effect or some other mechanism required further study. It may also be a concern that EAC inhibited lipid accumulation in liver (Fig. 4A–C) without changing liver TC level. One possibility is that the main component in liver lipid droplets is TG. Although EAC did not change TC content in liver, TG decreased by EAC treatment to improve fatty liver induced by high-fat diet. And both pharmacological study and mechanism study showed that the effective dose of EAC is 0.2% and 0.5%, not 0.1%.
Interestingly, in both DIO and LDLR−/− mice, EAC increased fecal TC significantly and with an obvious dose-dependent manner. It indicated that EAC may inhibit TC absorption to reduce serum TC. β-Sitosterol is structurally similar to cholesterol and may compete with it in the intestine to inhibit absorption of dietary cholesterol.44,45 Therefore, β-sitosterol may be the active element in crabapples for the inhibition of TC absorption.
Another possible mechanism for the TC lowering effects is the EAC increased CYP7A1 expression in the mice. CYP7A1 is an attractive target for cholesterol lowering drug development sense CYP7A1 may increase biotransformation from cholesterol to bile acid in liver. The findings are similar to the results in our previous study that showed 5 different species of crabapple increase CYP7A1 mRNA and protein levels in DIO mouse liver. The data indicated that EAC may inhibit TC synthesis in the liver through the increase of CYP7A1 function.
Conclusion
We identified that crabapple fraction EAC has significant cholesterol-lowering effect in both DIO and LDLR−/− mice. Additionally, EAC may improve obesity, insulin resistance, lipid accumulation in the liver tissue and may prevent atherosclerotic plaque formation in LDLR−/− mice. In vitro study showed that EAC inhibited cholesterol accumulation in HepG2 cell membrane. Mechanistic study found that EAC inhibited TC absorption in the intestine and elevated mRNA of CYP7A1 in the liver of the mice. Our data suggests that EAC is a potential functional dietary supplement on hypercholesterolemia and atherosclerosis.Conflicts of interest
The authors declare no conflict of interest.Acknowledgements
This work was supported by National Natural Science Foundation of China (81703774) and Sailing Plan (16YF1411600) to S. F., and Modernization of Chinese Materia Medica Project (15401902300) to C. H. from Shanghai Science and Technology Committee.References
- U. E. Bauer, P. A. Briss, R. A. Goodman and B. A. Bowman, Lancet, 2014, 384, 45–52 CrossRef.
- M. K. Ito, Ann. Pharmacother., 2012, 46, 1368–1381 CrossRef PubMed.
- N. J. Stone, J. G. Robinson, A. H. Lichtenstein, C. N. B. Merz, C. B. Blum, R. H. Eckel, A. C. Goldberg, D. Gordon, D. Levy and D. M. Lloydjones, J. Am. Coll. Cardiol., 2014, 63, 2889–2934 CrossRef PubMed.
- L. D. Colantonio, V. Bittner, K. Reynolds, E. B. Levitan, R. S. Rosenson, M. Banach, S. T. Kent, S. F. Derose, H. Zhou and M. M. Safford, Circulation, 2016, 133, 256 CAS.
- S. Mitchell, S. Roso, M. Samuel and M. Pladevall-Vila, BMC Cardiovasc. Disord., 2016, 16, 74 CrossRef CAS PubMed.
- R. H. Nelson, Prim. Care Clin. Office Pract., 2013, 40, 195–211 CrossRef PubMed.
- L. I. Xue-Jun and B. Yan, Int. J. Intern. Med., 2009, 96, 106–108 Search PubMed.
- S. G. Mlodinow, M. K. Onysko, J. W. Vandiver, M. L. Hunter and T. D. Mahvan, Clinician Rev., 2014, 24, 41 Search PubMed.
- H. Sinzinger, R. Wolfram and B. A. Peskar, J. Cardiovasc. Pharmacol., 2002, 40, 163–171 CrossRef CAS PubMed.
- S. Ramkumar and A. Wilson, Heart, Lung Circ., 2015, 24, S190 CrossRef.
- M. D. Müller-Wieland and N. Marx, Herz/Kreislauf, 2016, 41, 1–6 Search PubMed.
- J. R. Anderson, Drug Therapeut. Bull., 2016, 54, 18 CrossRef.
- Z. Y. Chen, R. Jiao and K. Y. Ma, J. Agric. Food Chem., 2008, 56, 8761–8773 CrossRef CAS PubMed.
- F. Aladedunye and B. Matthäus, Food Chem., 2014, 159, 273–281 CrossRef CAS PubMed.
- N. P. Seeram, R. H. Cichewicz, A. Chandra and M. G. Nair, J. Agric. Food Chem., 2003, 51, 1948–1951 CrossRef CAS PubMed.
- S. Q. Wang, X. F. Zhu, X. N. Wang, T. Shen, F. Xiang and H. X. Lou, Phytochemistry, 2013, 87, 119–125 CrossRef CAS PubMed.
- X. Wei, R. Zhao, Y. H. Sun, J. P. Cong, F. G. Meng and H. M. Zhou, J. Enzyme Inhib. Med. Chem., 2009, 24, 234–240 CrossRef CAS PubMed.
- Q. Xiaoxiao, X. Yun Feng, Z. Zhiqin and Y. Yuncong, Molecules, 2015, 20, 21193–21203 CrossRef PubMed.
- M. Li, S. Xue, S. Tan, X. Qin, M. Gu, D. Wang, Y. Zhang, L. Guo, F. Huang and Y. Yao, J. Funct. Foods, 2016, 27, 416–428 CrossRef CAS.
- L. Yu, W. Cai, Y. Zhang, L. Feng and C. Huang, J. Funct. Foods, 2015, 14, 278–288 CrossRef CAS.
- Q. Yang, M. Qi, R. Tong, D. Wang, L. Ding, Z. Li, C. Huang, Z. Wang and L. Yang, Int. J. Mol. Sci., 2017, 18, 1393 CrossRef PubMed.
- Y. Zhang, X. Wang, C. Vales, F. Y. Lee, H. Lee, A. J. Lusis and P. A. Edwards, Arterioscler., Thromb., Vasc. Biol., 2006, 26, 2316–2321 CrossRef CAS PubMed.
- K. Inai, K. Arihiro, Y. Takeshima, S. Yonehara, Y. Tachiyama, N. Khatun and T. Nishisaka, Cancer Sci., 1991, 82, 380–385 CrossRef CAS PubMed.
- J. J. Tang, J. G. Li, W. Qi, W. W. Qiu, P. S. Li, B. L. Li and B. L. Song, Cell Metab., 2011, 13, 44–56 CrossRef CAS PubMed.
- A. B. Hummon, S. R. Lim, M. J. Difilippantonio and T. Ried, BioTechniques, 2007, 42, 467–470 CrossRef CAS PubMed.
- E. G. Rudikovskaya, L. V. Dudareva, A. A. Shishparenok, N. B. Mitanova, I. G. Petrova and A. V. Rudikovskii, Chem. Nat. Compd., 2014, 50, 640–641 CrossRef.
- Y. Luo, C. Zhang, C. Xu, S. Zuo and Y. Liu, Asia-Pacific Traditional Medicine, 2014, 10, 20–22 Search PubMed.
- N. Li, J. Shi and K. Wang, J. Agric. Food Chem., 2014, 62, 574–581 CrossRef CAS PubMed.
- P. Zhuang, W. Fu and C. Tan, Res. Dev. Nat. Prod., 2009, 21, 963–965 CAS.
- X. Y. Yu, Chin. Tradit. Herb. Drugs, 2011, 42, 661–663 CAS.
- G. E. Yong-Bin, J. Chin. Med. Mater., 2014, 37, 435–438 Search PubMed.
- G. Hao, D. Wang, Y. Sun, J. Yu, F. Lin and H. Cao, Biomed. Rep., 2017, 6, 339–345 CrossRef PubMed.
- R. Akcılar, F. E. Koçak, H. Şimşek, A. Akcılar, Z. Bayat, E. Ece and H. Kökdaşgil, Iran. J. Basic Med. Sci., 2016, 19, 245–251 Search PubMed.
- G. F. Webster, T. G. Webster and L. R. Grimes, Dermatol. Online J., 2016, 23, 34929 Search PubMed.
- M. Jakobsen, T. Berentzen, T. Sørensen and K. Overvad, Epidemiol. Rev., 2007, 29, 77–87 CrossRef CAS PubMed.
- A. Yoo, V. P. Narayan, E. Y. Hong, W. K. Whang and T. Park, Sci. Rep., 2017, 7, 2251 CrossRef PubMed.
- K. Y. Park, E. Oh, M. K. Kwak, H. S. Jun and T. H. Heo, PLoS One, 2016, 11, e0150791 Search PubMed.
- M. Shibata, E. Shibata, K. Maemura, Y. Kondo and M. Harada-Shiba, Med. Mol. Morphol., 2017, 50, 130–144 CrossRef CAS PubMed.
- Y. Chang and J. Robidoux, Curr. Opin. Pharmacol., 2017, 33, 47–55 CrossRef CAS PubMed.
- Y. Jia, M. J. H. Bhuiyan, H. J. Jun, H. L. Ji, M. H. Hoang, H. J. Lee, N. Kim, D. Lee, K. Y. Hwang and Y. H. Bang, Bioorg. Med. Chem. Lett., 2011, 21, 5876–5880 CrossRef CAS PubMed.
- J. Köhler, D. Teupser, A. Elsässer and O. Weingärtner, Br. J. Pharmacol., 2017, 11, 1281–1289 CrossRef PubMed.
- T. T. Shen, S. W. Liu, J. Zhao, M. C. Wang, Z. Y. Chang and H. Wang, Food Sci., 2014, 35, 192–195 CAS.
- M. B. Schulze and F. B. Hu, Diabetes Care, 2004, 27, 613–614 CrossRef PubMed.
- M. L. Fernandez and S. Vega-López, Cardiovasc. Drug Rev., 2005, 23, 57–70 CrossRef CAS PubMed.
- K. Lu, M. H. Lee and S. B. Patel, Trends Endocrinol. Metab., 2001, 12, 314–320 CrossRef CAS PubMed.
Footnote |
| † Dongshan Wang and Yingchun Wu contributed equally to this work. |
| This journal is © The Royal Society of Chemistry 2017 |

