 Open Access Article
Size-tunable NaGdF4 nanoparticles as T2 contrast agents for high-field magnetic resonance imaging†
Zhigao Luab,
Ruijun Dengab,
Mingming Zhen*ab,
Xue Liab,
Toujun Zoua,
Yue Zhouab,
Mirong Guana,
Ying Zhangab,
Yuqing Wangc,
Tong Yuab,
Chunying Shuab and
Chunru Wang *ab
*ab
aBeijing National Laboratory for Molecular Sciences, Laboratory of Molecular Nanostructure and Nanotechnology, CAS Research/Education Center for Excellence in Molecular Sciences, Institute of Chemistry, Chinese Academy of Sciences, Beijing 100190, China. E-mail: crwang@iccas.ac.cn
bUniversity of Chinese Academy of Sciences, Beijing 100049, China
cCAS Key Laboratory for Biomedical Effects of Nanomaterials and Nanosafety, National Center for Nanoscience and Technology of China, Beijing, 100190, China
First published on 5th September 2017
Abstract
It is important to get high-quality magnetic resonance images at high magnetic field (>3 T) for medical diagnoses. However, the efficiency of the commonly used magnetic resonance imaging (MRI) contrast agents (CAs) always decrease with the increasing of magnetic field intensity. Thus, it is necessary to design MRI CAs with high relaxivity at high magnetic field. In this study, the hydrophilic and biocompatible NaGdF4@SiO2 nanoparticles (NPs) were feasibly synthesized and exhibited highly effective T2 contrast imaging at 7 T magnetic field. Furthermore, the obtained NPs had a higher r2/r1 value than the other typical T2 CAs (such as Dy-based NPs and Fe-based NPs) at high magnetic field. The observed large r2 of the current NaGdF4@SiO2 was mainly ascribed to the increased particle sizes. For in vivo application, 250 nm NaGdF4@SiO2 (with the highest relaxivity) as T2-weighted MRI CAs was further assessed. Toxicity studies demonstrated that NaGdF4@SiO2 NPs exhibited little toxicity both in vitro and in vivo. Therefore, NaGdF4@SiO2 NPs with appropriate size could be used as high-performance T2 CAs in the high magnetic field.
Introduction
Magnetic resonance imaging (MRI) has become one of the most powerful medical diagnostic tools in clinical bioimaging,1,2 due to its non-invasive and non-radiative nature. It can realize the excellent visualization of anatomical details with superb spatial and temporal resolution. To improve the accuracy and specificity of the imaging pathological processes, the MRI CAs are often required in order to better distinguish malignant tumor tissues from normal tissues to diagnosis cancer or other pathological processes.3–5 These CAs selectively shorten the T1 or T2 relaxation time in the region of interest, providing brighter or darker enhancement of the pathology. The efficiency of CAs relies on their r1 (1/T1) and r2 (1/T2) relaxivity values as well as the r2/r1 ratio.6–8 The higher ratio of r2/r1, the better T2 contrast efficiency.6 Furthermore, in some preclinical MRI studies, such as blood vessels or small animal models, must provide the highest possible resolution; hence, they rely heavily on the high field strengths (>3.0 T).9Lanthanide-based nanoparticles can be used as ideal building blocks for CAs because of their unique magnetic properties.10–14 Among the lanthanide elements, paramagnetic gadolinium (Gd), which has seven unpaired electrons, is usually considered as excellent T1-weighted MRI CAs.15 Recently, gadolinium ion-doped nanoparticles (Gd-NPs), such as upconversion nanoparticles (UCNPs),16–19 GdPO4,20,21 GdF3 (ref. 22 and 23) and Gd2O3,24,25 have attracted increasing attention as promising T1 MRI CAs, more and more studies have been performed to describe how Gd-NPs affect the longitudinal relaxation rate (r1) and have demonstrated that the surface-coating and the size of the Gd-NPs are key factors influencing the relaxation rate.26–28 Unfortunately, many previously reported Gd-NPs including Dy-NPs and Fe-NPs have high r1 or r2 values but the r2/r1 value is not so satisfied. Furthermore, one of the major limitation of the present CAs is their decreased efficiency at higher magnetic fields, for example, the T1 imaging ability of Gd ion complexes is optimal at fields below 1 T.6,29,30 The other kind of T2 CAs (superparamagnetic iron oxide nanoparticles) are known to saturate their magnetization at about 1.5 T. Therefore, the development of CAs (with high r2 and high ratio of r2/r1) that are more efficient at high magnetic field is urgently needed to take full advantage of contrast enhanced MRI at ultrahigh fields and to meet the ever-growing performance demand on scientific research and clinical diagnosis.31
In this work, we report a simple and feasible approach to prepare the NaGdF4 NPs by direct nanoprecipitation method for high efficiency T2 MRI CAs. This synthesized method allows for regulating crystal growth by changing the density of chelator to obtain different sizes of NaGdF4 NPs in the range of 100–220 nm. Then NaGdF4 NPs with different size distribution were coated with the same thickness of silica (∼12 nm), forming a highly biocompatible and hydrophilic rigid sphere with the diameter from 120 to 250 nm. The T2 relaxivity measurements were performed at 0.5 T and 7 T. The r2 values were 129–159 mM−1 s−1, and the r2/r1 values were as high as 173–586 (7 T) when the size of the NPs was increased. The magnetization plots (M–H) of the NaGdF4@SiO2 show that NPs are paramagnetic and the observed large r2 of the current NaGdF4@SiO2 was mainly ascribed to the particle sizes increase. The toxicities of these NPs in vitro and in vivo were further evaluated using WST-8 assays and pathology staining methods to demonstrate the non-toxicity with the NaGdF4@SiO2 NPs. The T2-weighted MRI contrast effect in vivo was also investigated. In short, this work will provide a new method for the application of Gd-NPs as high efficiency T2 MRI CAs.
Experiments
Materials
All of the chemicals used were of analytical grade and were used without further purification unless otherwise stated. Gadolinium oxide (Gd2O3, 99.9%) was purchased from China Minmetals Corporation Co. Ltd. Na3-nitrilotriacetic acid (Na-NTA, 99.9%) and sodium fluoride (NaF) were obtained from Aldrich. Tetraethyl orthosilicate (TEOS) was purchased from Alfa-Aesar. Aqueous ammonia solution (25 wt%), perchloric acid (HClO4), and ethanol were purchased from Beijing Chemical Factory (China). Dulbecco's modified Eagle's medium (DMEM, HyClone, United States), Cell Counting Kit-8 (CCK-8), penicillin/streptomycin (PS), and fetal bovine serum (FBS, HyClone, USA) were all purchased from Biodee Co. Ltd., Beijing (China). This study was performed in strict accordance with the NIH guidelines for the care and use of laboratory animals (NIH publication no. 85-23 Rev. 1985) and was approved by IACUC (Institutional Animal Care and Use Committee) of Capital Medical University (Beijing, China).Preparation of NaGdF4 nanoparticles
NaGdF4 NPs were synthesized as follows. In brief, Gadolinium oxide (1 mmol) and a measured amount of perchloride were mixed together in a 50 mL flask heated to 80 °C until a clear solution formed. The gadolinium perchloride solution was cooled to room temperature and concentrated to 5 mL (0.2 mol L−1) by vacuum rotary evaporation. Next, 15 mL of different concentrations of trisodium citrate (0.6 mol L−1 for 120 nm NPs, 0.3 mol L−1 for 190 nm NPs and 0.2 mol L−1 for 250 nm NPs) was quickly injected into the flask, the mixture was stirred for 10 min. Then, NaF (5 mL, 0.5 mol L−1) was quickly injected into the flask with vigorous magnetic stirring at room temperature for 4 h and a milk white solution formed. Subsequently, the milk white solution was centrifuged at 8000 rpm and washed twice with ethanol and water. The NPs were finally dispersed in 15 mL of water.Preparation of silica-coated NaGdF4 nanoparticles
NaGdF4@SiO2 core/shell nanoparticles were prepared by the reverse microemulsion method.15,32 The preparation was typically performed as follows: under vigorous stirring, 1 mL of aqueous NaGdF4 solution was introduced into a liquid system containing 10 mL of ethanol, the volume of aqueous ammonia solutions and TEOS were added differently along with different size of NaGdF4@SiO2 NPs: for 120 nm NaGdF4@SiO2 NPs, 40 μL aqueous ammonia solutions were added dropwise, after about 5 minutes, another 50 μL TEOS were introduced dropwise into the flask, for 190 nm and 250 nm NaGdF4@SiO2 NPs, the procedures were the same as 120 nm NaGdF4@SiO2 NPs, but the volume were that: 60 μL aqueous ammonia solutions and 80 μL TEOS for 190 nm NaGdF4@SiO2 NPs, 80 μL aqueous ammonia solutions and 100 μL TEOS for 250 nm NaGdF4@SiO2 NPs. Then, the reaction system was sealed and kept under stirring in a dark at room temperature for different times (4 h, d = 120 nm; 5 h, d = 190 nm; 6 h, d = 250 nm). Isopropanol was used to terminate the reaction, and the resultant precipitate of NaGdF4@SiO2 composite particles was subsequently washed in sequence with ethanol and water. The particles suspended in liquid media were typically collected by centrifugation and then dispersed in pure water for further characterization.Characterization
Transmission electron microscopy (TEM) images were obtained on a JEM-2100F microscope (JEOL, Japan) at an operating voltage of 100 kV. Samples were prepared by spreading a drop of sample on copper grids, followed by evaporation under vacuum. Powder X-ray diffraction (XRD) measurements were taken with a Rigaku D/MAX-2000 diffractometer (Japan) with a slit of 1/2° at a scanning rate of 2° min−1 using Cu Kα radiation (λ = 0.15406 nm). The dynamic light scattering (DLS, Malvern, UK) measurements were performed at 25 °C. The scattering angle was fixed at 90°. Samples were filtered through a 0.45 μm pore size membrane before DLS measurement.Cell culture
Human lung cancer A549 cells were provided by peking union medical college hospital (Beijing, China). A549 cells were cultured in DMEM supplemented with 10% fetal bovine serum (FBS), streptomycin (100 μg mL−1) and penicillin (100 U mL−1) at 37 °C in a humidified 5% CO2 atmosphere.Cellular toxicity
To investigate the cellular toxicity of NaGdF4@SiO2, the A549 cells were seeded in a 96-well culture plate with DMEM for 24 h. Then, the aged culture medium was replaced with freshly prepared culture medium that contained NaGdF4@SiO2 solution in a series of gradient Gd3+ concentrations and incubated for another 24 h (n = 6). Subsequently, the culture medium was removed, and 100 μL of DMEM without phenol red and 10 μL of Cell Counting Kit-8 (CCK-8; DOJINDO, Kumamoto, Japan) were added to each well. After incubation for another 1 h, the absorbance of each treated well was measured at 450 nm using a microplate reader (iMarkmicroplate reader, Bio-RAD, USA).Relaxivity measurement in vitro
To evaluate the contrast enhancement of the obtained NaGdF4@SiO2, the relaxivities r1 and r2 were measured at 0.5 T and 7 T. For 0.5 T NM120 analyst, using a spin-echo pulse sequence with pulse repetition time D0 = 300 ms. For 7 T analyst, the MR signal intensity in the tubes was ascertained by the average intensity in the defined regions of interests (ROI) using a 7 T (BioSpec70/20USR, Bruker, Germany) in conjunction with a volume coil. Dilutions of NaGdF4@SiO2 in water were placed in a series of 0.5 mL tubes. The T1 WI and T2 WI were acquired with T1-flash and T2-turbo-RARE sequences, respectively. The T1-flash parameters were as follows: TR/TE = 150/1.8 ms, NEX = 3, flap angle = 80°, FOV = 40 × 40 mm, MTX = 256 × 256; T2-turbo-RARE: TR/TE = 2500/53.38 ms, NEX = 1, flap angle = 90°, FOV = 40 × 40 mm, MTX = 256 × 256. The T1 and T2 values were measured with T1 map-RARE and T2 map-MSME sequences, respectively. The T1 map-RARE parameters were as follows: TR/TE = 189, 400, 800, 1200, 2500/6.1 ms, NEX = 1, flap angle = 90°, FOV = 40 × 40 mm, MTX = 128 × 128; T2 map-MSME: TR/TE = 2500/6.67 (16 echo times, the step is 6.67 ms), NEX = 1, flap angle = 90°, FOV = 40 × 40 mm, MTX = 128 × 128.Magnetic resonance imaging in vivo
H22 cells were grown in DMEM medium that was supplemented with 10% FBS and 1% PS at 37 °C in 5% CO2. Balb/c mice (five weeks, 18–22 g) were purchased from Beijing Xing Long Biological Technology Co., Ltd (China). Each mouse was subcutaneously injected in the flank with approximately 8 × 10⁶ H22 cells that were suspended in 100 μL of PBS. Approximately 8 d after inoculation, 200 μL of the complex solution at a dose of 4 mM Gd3+ was intravenously injected via the tail vein and mice were imaged with a rat head coil on a 7 T MRI instrument. The T2 WI was acquired with T2-turbo-RARE sequence. The parameters were as follows: TR/TE = 3000/50 ms, NEX = 2, flap angle = 90°, FOV = 40 × 40 mm, MTX = 256 × 256.H&E stainning
For hematoxylin and eosin (H&E) staining, the heart, liver, spleen, lung, and kidney were harvested from mice after intravenously injected with different sizes of NaGdF4@SiO2 NPs (n = 3, dose = 4 mM, 200 μL, test group) and the un-treated mice as control. The tissues were fixed in 4% paraformaldehyde solution and embedded in paraffin. They were then sectioned and stained with hematoxylin and eosin. The histological sections were tested for in vivo toxicity and observed under a NanoZoomer-SQ slide scanner (Hamamatsu, Japan).Results and discussion
Synthesis and characterization of NaGdF4 NPs
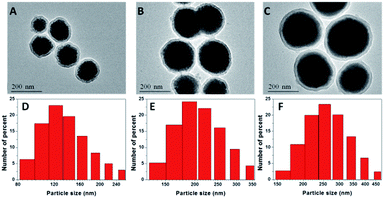
NaGdF4 NPs were first formed by the aggregation model and were prepared in the presence of a chelator (trisodium citrate). By changing the concentration of trisodium citrate from 0.2 M to 0.6 M, the sizes of obtained NaGdF4 NPs were ranged from 100 nm to 220 nm (Fig. S1†). According to the reported literature,33 the formation of the NPs is primarily controlled by the aggregation of the primary Gd ion. Smaller particles were achieved by the presence of the chelator trisodium citrate and its variation ion concentration. This change probably resulted in the adsorption of chelators onto the NaGdF4 nanoparticles and influenced the repulsive force between the primary Gd ions, preventing the primary Gd ions from forming large particles but generating uniform NPs by aggregation. The water-dispersible NaGdF4 NPs were then coated with silicon dioxide, as shown in Fig. 1A–C. The silica-coated NaGdF4 NPs were well dispersed in water. By changing the ratio of TEOS to ammonia, different sizes of NaGdF4 were coated with the same thickness of silica, and the thickness of the silica layer could be easily observed by TEM as approximately 12 nm. The average hydrodynamic diameters of the NaGdF4@SiO2 NPs were ranged from 120 nm to 250 nm measured by dynamic light scattering (DLS, Fig. 1D–F), which was consistent with those observed with TEM. The surface zeta potential of NaGdF4@SiO2 with the size of 250 nm was −30 ± 0.6 mV, −32 ± 0.8 mV for 190 nm NPs and −35 ± 1.1 mV for 120 nm NPs. Thus, three kinds of NaGdF4@SiO2 NPs with different size distribution were prepared and shortened as sample 1 (NaGdF4@SiO2 120 nm), sample 2 (NaGdF4@SiO2 190 nm) and sample 3 (NaGdF4@SiO2 250 nm).The crystalline information on NaGdF4 NPs was provided by powder X-ray diffraction (XRD, Fig. 2). The peak position and relative intensity of all the NaGdF4 NPs were in good agreement with the data of hexagonal-phase NaGdF4 crystals (β-NaGdF4) as reported in the JCPDS standard card (27-0699), and no impurity phase was detected.
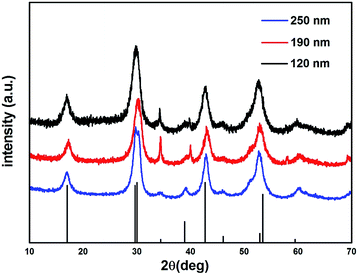 | ||
| Fig. 2 XRD patterns of NaGdF4 sample 1 (120 nm), sample 2 (190 nm), sample 3 (250 nm) and JCPDS #27-0699. | ||
Relaxivity measurements and T2-weighted MRI in vitro
To evaluate the impact of size on MRI relaxivity properties, the r1 and r2 relaxivity of NaGdF4@SiO2 NPs were investigated in water at 0.5 T and 7 T. To calculate the ionic relaxivities, the Gd ion concentration of the NaGdF4@SiO2 NPs dispersions was determined using ICP-MS after digesting the NPs with concentrated nitric acid and hydrochloric acid (v/v = 1![[thin space (1/6-em)]](https://www.rsc.org/images/entities/char_2009.gif) :
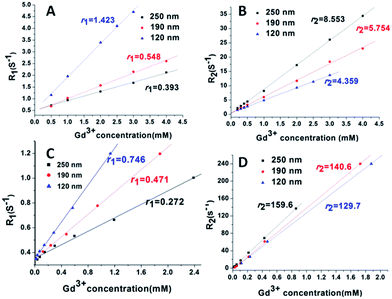
:![[thin space (1/6-em)]](https://www.rsc.org/images/entities/char_2009.gif) 3) at 100 °C overnight. The ionic relaxivity values (r1, r2) with an equivalent Gd ion concentration range of 0–2.5 mM at 0.5 T and 7 T were obtained from the slope of the linear regression fit from the relaxivity plots (Fig. 3). In addition, r1 and r2 relaxivity values of NaGdF4@SiO2 were shown in Table S1.† At 0.5 T, r1 relaxivities decreased with the increase of particle size, from a value of 1.4 mM−1 s−1 (120 nm particles) to 0.39 mM−1 s−1 (250 nm particles). At 7 T, r1 relaxivities decreased from a value of 0.75 mM−1 s−1 (for the 120 nm particles) to 0.27 mM−1 s−1 (for the 250 nm particles). Conversely, at both 0.5 T and 7 T, r2 relaxivities increased dramatically with increasing particle size, from a value of 4.36 mM−1 s−1 for the 120 nm particles to 8.55 mM−1 s−1 for the 250 nm particles at 0.5 T, and from a value of 129.7 mM−1 s−1 for the 120 nm particles to 159.6 mM−1 s−1 for the 250 nm particles at 7 T. Clearly, the r2 values were highly increased at high field strengths. The r2 value is as high as some reported Dy3+-based NPs and some of clinically used T2 CAs6,34–40 (Table 1).
3) at 100 °C overnight. The ionic relaxivity values (r1, r2) with an equivalent Gd ion concentration range of 0–2.5 mM at 0.5 T and 7 T were obtained from the slope of the linear regression fit from the relaxivity plots (Fig. 3). In addition, r1 and r2 relaxivity values of NaGdF4@SiO2 were shown in Table S1.† At 0.5 T, r1 relaxivities decreased with the increase of particle size, from a value of 1.4 mM−1 s−1 (120 nm particles) to 0.39 mM−1 s−1 (250 nm particles). At 7 T, r1 relaxivities decreased from a value of 0.75 mM−1 s−1 (for the 120 nm particles) to 0.27 mM−1 s−1 (for the 250 nm particles). Conversely, at both 0.5 T and 7 T, r2 relaxivities increased dramatically with increasing particle size, from a value of 4.36 mM−1 s−1 for the 120 nm particles to 8.55 mM−1 s−1 for the 250 nm particles at 0.5 T, and from a value of 129.7 mM−1 s−1 for the 120 nm particles to 159.6 mM−1 s−1 for the 250 nm particles at 7 T. Clearly, the r2 values were highly increased at high field strengths. The r2 value is as high as some reported Dy3+-based NPs and some of clinically used T2 CAs6,34–40 (Table 1).
| Contrast agents | Surface coating | Size (nm) | HD (nm) | r2 (mM−1 s−1) | r1 (mM−1 s−1) | r2/r1 | Field (T) | Ref. |
|---|---|---|---|---|---|---|---|---|
| NaGdF4@SiO2 | SiO2 | 100 | 120 | 129.7 | 0.746 | 173.8 | 7 | This work |
| NaGdF4@SiO2 | SiO2 | 160 | 190 | 142.9 | 0.471 | 303.4 | 7 | |
| NaGdF4@SiO2 | SiO2 | 220 | 250 | 159.6 | 0.272 | 586.8 | 7 | |
| NaDyF4 NP | PMAO–PEG | 20.3 | 33.7 | 101 | 0.33 | 306 | 9.4 | 6 |
| Dy-fullerenol [Dy@C82(OH)n] | 20 | 0.95 | 21 | 9.4 | 40 | |||
| Dy-DTPA-PcHexPh2 | 3 | 0.11 | 27 | 7 | 39 | |||
| Dy2O3 | D-glu, acid | 3 | 40.28 | 0.16 | 251 | 3 | 35 | |
| Combidex (Fe3O4) | Dextran | 5.85 | 35 | 60 | 10 | 6 | 1.5 | 37 |
| Feridex (Fe3O4, γ-Fe2O3) | Dextran | 4.96 | 160 | 93 | 4.1 | 22 | 3 | 38 |
| Resovist (Fe3O4) | Carboxydextran | 4 | 60 | 143 | 4.6 | 31 | 3 | 38 |
| α-Fe | PEG | 10 | 129 | 1.4 | 92 | 1.5 | 36 |
According to the r2 relaxivities measured at both 0.5 T and 7 T, larger size of NaGdF4@SiO2 show higher relaxivity than the smaller ones. The magnetic hysteresis loop plot (M–H) obtained by different size of NPs showed that NPs are paramagnetic and the observed high r2 of the current NaGdF4@SiO2 mainly be ascribed to the particle sizes increase (Fig. S2†). To further analyze the observed enhancement of ionic relaxivity with increasing NP size, the relaxivities, based on the mass concentration of NPs (r1/M) and CAs concentration of NPs (r1/NP), were calculated from the ionic relaxivity (r1/[Gd3+]) (Table S2†).26
The r2/NP values correspond to per CA relaxivity, and the relaxivity increases from 1.56 × 10⁹ mM−1 s−1 for the 120 nm particle to 1.73 × 10¹⁰ mM−1 s−1 for the 250 nm particles at 7 T. Because the total number of Gd ions is higher in larger particles, the r2/NP values increase with size. Clinical complexes typically contain one Gd ion per CA, and their unit CA relaxivity is the same as their ionic relaxivity. Thus, the relaxivity offered by each NaGdF4 NP described here is approximately 1 × 10⁹ times that of clinical agents, which allows enhanced local contrast and was highly beneficial for targeted imaging. Moreover, because of the coating of silica on the NaGdF4, bundles of multiple Gd ions in a crystalline NPs are less likely to leak. ICP-MS analysis of the bulk water after dialysis of the NPs showed no appreciable amount of free Gd ions in solution, indicating that no leaking of ions from the NP occurred. Thus, these NPs are good scaffolds for integrating multiple Gd ions without compromising Gd ion binding.
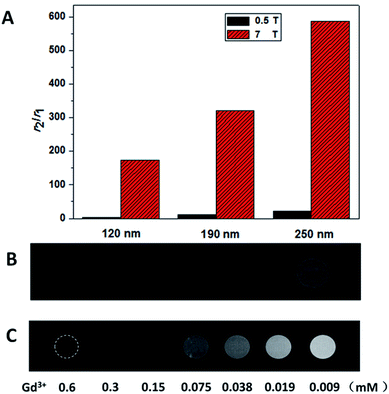
The ability of CAs to be used as T2 agents was also governed by the ratio of their transverse relaxivity to longitudinal relaxivity, high r2/r1 ratios were considered ideal. The r2/r1 ratio for the 120 nm NPs was approximately 157, and the 250 nm NPs was as high as approximately 587 (Fig. 4A), which to the best of our knowledge, was the highest value reported for Gd-based nanoparticle CAs thus far.
For T2-weighted MRI in vitro, the T2-weighted phantom MR images between the three types of NaGdF4@SiO2 NPs were obtained at 7 T. As shown in Fig. 4B, the images of three types NPs (all at a 0.1 mM Gd3+ concentration) became shallow as the size gets smaller (from left to right). The 250 nm NaGdF4@SiO2 NPs, which had shown the highest relaxivity and may suit for biological applications were chosen for concentration-dependent (0.6–0.009 mM Gd3+) phantom images to examine the feasibility of the NPs for in vitro MR imaging.41 As we can easily find that (Fig. 4C), with Gd ion concentrations decreased (from left to right), the T2-weighted.
MRI images became shallow continuously. It is evident that these NPs have excellent T2-weighted MR imaging ability and can easily be tuned by adjusting the size and concentration of the NPs.
T2-weighted MRI in vivo
Due to the excellent T2 magnetic resonance effect of NaGdF4@SiO2 NPs, the applicability as a T2-weighted MRI CAs in vivo was further assessed. Therefore, 250 nm NaGdF4@SiO2 NPs (with the highest r2 relaxivities) were chosen for intravenous injection in tumor-bearing (H22) mouse model. Compared with the MR images of tumor and normal tissue before 7 h and 24 h post-injection, remarkable negative contrast enhancement was observed in the tumor region, whereas hardly any changes appeared in the normal tissue (Fig. 5). According to the MR images, NPs could accumulate in the tumor and decreased in 24 h. It demonstrated silica coated NaGdF4 NPs have good biocompatibility and can be accumulated at the tumor position through the enhanced permeability and retention (EPR) effect.41,42 These result indicated that NaGdF4@SiO2 NPs (250 nm) could act as high-performance T2-weighted MRI CAs on H22 tumor in vivo. Furthermore, NaGdF4@SiO2 NPs (250 nm) in the main organs at different time points post-injection have been investigated. After they were intravenously injected with the NPs, the mice were sacrificed at 2 h, 7 h, 24 h, and 30 day post-injection. The distribution of Gd3+ in each organ was shown in Fig. 6. The results exhibited that 250 nm NaGdF4@SiO2 NPs mainly accumulated in the lung, liver and spleen and reached a maximum at 7 h post-injection in the tumor, which was consistent with the above MRI results. After 30 day post-injection, the Gd3+ residues were nearly undetectable in the organs via ICP-MS, showing that most of the NPs were excreted from the body of the mice. | ||
| Fig. 5 In vivo T2-weighted MR images of H22 tumor-bearing mice obtained before and 7 h, 24 h after tail intravenous injection of sample 3 (200 μL, 4 mM), yellow arrow point to the tumor area. | ||
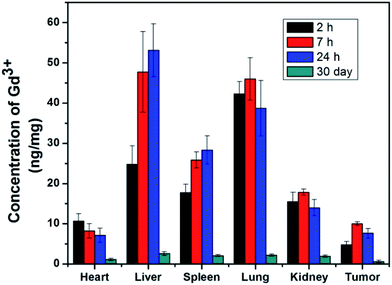 | ||
| Fig. 6 The biodistribution of 250 nm NaGdF4@SiO2 NPs in vivo. NaGdF4@SiO2 (4 mM, 200 μL) was intravenously injected into the mouse (n = 4). | ||
Toxicity of NaGdF4@SiO2
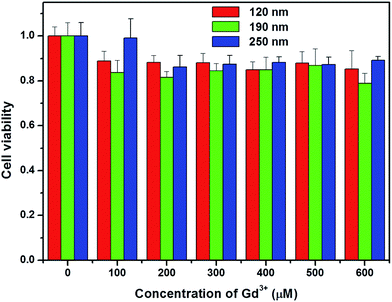
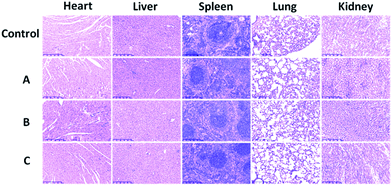
To evaluate the toxicity of silica-coated NaGdF4 NPs, the cell growth and viability of A549 cells incubated with NaGdF4@SiO2 at different Gd3+ concentrations (up to 600 μM) for 24 h were evaluated. The WST-8 assay showed that no significant differences in the proliferation of A549 cells were observed in the absence or presence of NaGdF4@SiO2 within 24 h (Fig. 7). Even at the concentration of 600 μM, the cell viability was estimated to be approximately 80%. The WST-8 assay results demonstrated that NaGdF4@SiO2 NPs showed low cytotoxicity to A549 cells.Toxicity was further investigated by pathology assessments of tissue obtained from the tested mice at 7 days post-injection. The major organs such as heart, liver, spleen, lung and kidney were harvested for histological analysis. Despite the high-concentration injection of water dispersible NaGdF4@SiO2 NPs at an equivalent Gd3+ concentration of 4 mM, no noticeable signs of organ damage or inflammatory lesions were observed in these major organs compared with the control (Fig. 8). This phenomenon has previously been observed in other rare-earth fluoride hosts. However, further long-term study is still needed to evaluate the toxicity of NaGdF4-based MRI probes.
Conclusion
In summary, we have prepared different sizes of NaGdF4@SiO2 NPs (from 120 nm to 250 nm), compared with Dy-based and Fe-based NPs, NaGdF4@SiO2 exhibited excellent high r2 value and ultrahigh r2/r1 values at the high magnetic field (7 T). Furthermore, the results of toxicity studies indicated that NaGdF4@SiO2 NPs showed good compatibility and low cytotoxicity to the living systems. Our study demonstrated that Gd-based NPs with appropriate size could be used as potential T2 CAs in an ultrahigh field.Conflicts of interest
There are no conflicts to declare.Acknowledgements
This work is supported by the National Natural Science Foundation of China (No. 51472248), the Key Research Program of the Chinese Academy of Sciences (QYZDJ-SSW-SLH025, KGZD-EW-T02, XDA09030302).References
- H. B. Na, I. C. Song and T. Hyeon, Adv. Mater., 2009, 21, 2133–2148 CrossRef CAS.
- S. Viswanathan, Z. Kovacs, K. N. Green, S. J. Ratnakar and A. D. Sherry, Chem. Rev., 2010, 110, 2960–3018 CrossRef CAS PubMed.
- M. F. Dumont, C. Baligand, Y. Li, E. S. Knowles, M. W. Meisel, G. A. Walter and D. R. Talham, Bioconjugate Chem., 2012, 23, 951–957 CrossRef CAS PubMed.
- J. W. Bulte and D. L. Kraitchman, NMR Biomed., 2004, 17, 484–499 CrossRef CAS PubMed.
- J. Zeng, L. Jing, Y. Hou, M. Jiao, R. Qiao, Q. Jia, C. Liu, F. Fang, H. Lei and M. Gao, Adv. Mater., 2014, 26, 2694–2698 CrossRef CAS PubMed.
- G. K. Das, N. J. Johnson, J. Cramen, B. Blasiak, P. Latta, B. Tomanek and F. C. van Veggel, J. Phys. Chem. Lett., 2012, 3, 524–529 CrossRef CAS PubMed.
- E. Gultepe, F. J. Reynoso, A. Jhaveri, P. Kulkarni, D. Nagesha, C. Ferris, M. Harisinghani, R. B. Campbell and S. Sridhar, Nanomedicine, 2010, 5, 1173–1182 CrossRef CAS PubMed.
- J. Qin, S. Laurent, Y. S. Jo, A. Roch, M. Mikhaylova, Z. M. Bhujwalla, R. N. Muller and M. Muhammed, Adv. Mater., 2007, 19, 1874–1878 CrossRef CAS.
- R. Weissleder, Science, 2006, 312, 1168–1171 CrossRef CAS PubMed.
- J. Zhou, Y. Sun, X. Du, L. Xiong, H. Hu and F. Li, Biomaterials, 2010, 31, 3287–3295 CrossRef CAS PubMed.
- J. Zhou, M. Yu, Y. Sun, X. Zhang, X. Zhu, Z. Wu, D. Wu and F. Li, Biomaterials, 2011, 32, 1148–1156 CrossRef CAS PubMed.
- J. Zhou, X. Zhu, M. Chen, Y. Sun and F. Li, Biomaterials, 2012, 33, 6201–6210 CrossRef CAS PubMed.
- M. He, P. Huang, C. Zhang, H. Hu, C. Bao, G. Gao, R. He and D. Cui, Adv. Funct. Mater., 2011, 21, 4470–4477 CrossRef CAS.
- J. Zhou, Z. Lu, G. Shan, S. Wang and Y. Liao, Biomaterials, 2014, 35, 368–377 CrossRef CAS PubMed.
- F. Chen, W. Bu, S. Zhang, J. Liu, W. Fan, L. Zhou, W. Peng and J. Shi, Adv. Funct. Mater., 2013, 23, 298–307 CrossRef CAS.
- H. Du, J. Yu, D. Guo, W. Yang, J. Wang and B. Zhang, Langmuir, 2016, 32, 1155–1165 CrossRef CAS PubMed.
- S. Biju, M. Harris, L. V. Elst, M. Wolberg, C. Kirschhock and T. N. Parac-Vogt, RSC Adv., 2016, 6, 61443–61448 RSC.
- Z. Yi, X. Li, Z. Xue, X. Liang, W. Lu, H. Peng, H. Liu, S. Zeng and J. Hao, Adv. Funct. Mater., 2015, 25, 7119–7129 CrossRef CAS.
- M. Guan, H. Dong, J. Ge, D. Chen, L. Sun, S. Li, C. Wang, C. Yan, P. Wang and C. Shu, NPG Asia Mater., 2015, 7, e205 CrossRef CAS.
- Q. Du, Z. Huang, Z. Wu, X. Meng, G. Yin, F. Gao and L. Wang, Dalton Trans., 2015, 44, 3934–3940 RSC.
- W. Ren, G. Tian, L. Zhou, W. Yin, L. Yan, S. Jin, Y. Zu, S. Li, Z. Gu and Y. Zhao, Nanoscale, 2012, 4, 3754–3760 RSC.
- X.-Y. Zheng, L.-D. Sun, T. Zheng, H. Dong, Y. Li, Y.-F. Wang and C.-H. Yan, Sci. Bull., 2015, 60, 1092–1100 CrossRef CAS.
- Y. Tian, H.-Y. Yang, K. Li and X. Jin, J. Mater. Chem., 2012, 22, 22510 RSC.
- T. Shen, Y. Zhang, A. M. Kirillov, H. Cai, K. Huang, W. Liu and Y. Tang, Chem. Commun., 2016, 52, 1447–1450 RSC.
- B. Babić-Stojić, V. Jokanović, D. Milivojević, M. Požek, Z. Jagličić, D. Makovec, K. Arsikin and V. Paunović, J. Magn. Magn. Mater., 2016, 403, 118–126 CrossRef.
- N. J. J. Johnson, W. Oakden, G. J. Stanisz, R. Scott Prosser and F. C. J. M. van Veggel, Chem. Mater., 2011, 23, 3714–3722 CrossRef CAS.
- Y. Zhang, T. Zou, M. Guan, M. Zhen, D. Chen, X. Guan, H. Han, C. Wang and C. Shu, ACS Appl. Mater. Interfaces, 2016, 8, 11246–11254 CAS.
- M. Zhen, J. Zheng, L. Ye, S. Li, C. Jin, K. Li, D. Qiu, H. Han, C. Shu, Y. Yang and C. Wang, ACS Appl. Mater. Interfaces, 2012, 4, 3724–3729 CAS.
- P. Caravan, Chem. Soc. Rev., 2006, 35, 512–523 RSC.
- L. Helm, Future Med. Chem., 2010, 2, 385–396 CrossRef CAS PubMed.
- E. Terreno, D. D. Castelli, A. Viale and S. Aime, Chem. Rev., 2010, 110, 3019–3042 CrossRef CAS PubMed.
- H. S. Qian, H. C. Guo, P. C. Ho, R. Mahendran and Y. Zhang, Small, 2009, 5, 2285–2290 CrossRef CAS PubMed.
- Z. P. Chen, Y. Zhang, K. Xu, R. Z. Xu, J. W. Liu and N. Gu, J. Nanosci. Nanotechnol., 2008, 8, 6260–6265 CrossRef CAS PubMed.
- G. K. Das, Y. Zhang, L. D'Silva, P. Padmanabhan, B. C. Heng, J. S. Chye Loo, S. T. Selvan, K. K. Bhakoo and T. T. Yang Tan, Chem. Mater., 2011, 23, 2439–2446 CrossRef CAS.
- K. Kattel, J. Y. Park, W. Xu, H. G. Kim, E. J. Lee, B. A. Bony, W. C. Heo, J. J. Lee, S. Jin, J. S. Baeck, Y. Chang, T. J. Kim, J. E. Bae, K. S. Chae and G. H. Lee, ACS Appl. Mater. Interfaces, 2011, 3, 3325–3334 CAS.
- C. G. Hadjipanayis, M. J. Bonder, S. Balakrishnan, X. Wang, H. Mao and G. C. Hadjipanayis, Small, 2008, 4, 1925–1929 CrossRef CAS PubMed.
- Y. X. Wang, Quant. Imaging Med. Surg., 2011, 1, 35–40 Search PubMed.
- M. Rohrer, H. Bauer, J. Mintorovitch, M. Requardt and H. J. Weinmann, Invest. Radiol., 2005, 40, 715–724 CrossRef PubMed.
- P. Caravan, M. T. Greenfield and J. W. M. Bulte, Magn. Reson. Med., 2001, 46, 917–922 CrossRef CAS PubMed.
- H. Kato, Y. Kanazawa, M. Okumura, A. Taninaka, T. Yokawa and H. Shinohara, J. Am. Chem. Soc., 2003, 125, 4391–4397 CrossRef CAS PubMed.
- S. D. Perrault, C. Walkey, T. Jennings, H. C. Fischer and W. C. Chan, Nano Lett., 2009, 9, 1909–1915 CrossRef CAS PubMed.
- T. Stylianopoulos and R. K. Jain, Nanomedicine, 2015, 11, 1893–1907 CrossRef PubMed.
Footnote |
| † Electronic supplementary information (ESI) available. See DOI: 10.1039/c7ra08303c |
| This journal is © The Royal Society of Chemistry 2017 |

