
 Open Access Article
 This Open Access Article is licensed under a Creative Commons Attribution-Non Commercial 3.0 Unported Licence
Insights into zero-gap CO2 electrolysis at elevated temperatures†
Carlos A.
Giron Rodriguez
a,
Nishithan C.
Kani
 a,
Asger B.
Moss
a,
Bjørt Oladottir
Joensen
a,
Sahil
Garg
a,
Wanyu
Deng
a,
Terry
Wilson
b,
John R.
Varcoe
b,
Ib
Chorkendorff
a and
Brian
Seger
*a
a,
Asger B.
Moss
a,
Bjørt Oladottir
Joensen
a,
Sahil
Garg
a,
Wanyu
Deng
a,
Terry
Wilson
b,
John R.
Varcoe
b,
Ib
Chorkendorff
a and
Brian
Seger
*a
aSurface Physics and Catalysis (SurfCat) Section, Department of Physics, Technical University of Denmark, 2800 Kgs, Lyngby, Denmark. E-mail: brse@fysik.dtu.dk
bDepartment of Chemistry, School of Chemistry and Chemical Engineering, University of Surrey, Guildford, GU2 7XH, UK
First published on 28th February 2024
Abstract
Renewable-powered CO2 electrolysis (CO2E) is a promising strategy to reduce greenhouse gas emissions by transforming CO2 into valuable feedstocks. While recent studies in this field have focused on developing efficient catalyst materials or electrolyzer engineering, the operating temperature's effect has not been systematically examined for zero-gap electrolyzers. To examine the effects of operating temperature, a systematic investigation was conducted using zero-gap (MEA) Cu-based GDEs across a range from room temperature to 80 °C. Our results indicate that increasing the temperature improves CO2 mass transport, ionic conductivity, and water management, allowing for high catalytic activity toward CO2E. At operating temperatures greater than 50 °C, selectivity shifted substantially towards CO, with surface enhanced infrared absorption spectroscopy (SEIRAS) showing a concomitant decrease in surface CO coverage at and above this temperature. As commercial electrolyzers will operate at elevated temperatures due to ohmic heating, they may produce a significantly different product distribution than the room-temperature electrolysis prevalent in the literature. Experiments at elevated temperatures demonstrated improved results for CO2E with industrially relevant current densities (150 mA cm−2) over an extended operational period (>200 hours). Additionally, we found that the heating method strongly affects product selectivity and the electrolyzer's performance, emphasizing the need to ensure proper heating while working under these reaction systems.
Broader contextElectrochemical CO2 reduction is an effective method of reducing greenhouse gas emissions while creating added-value products. This process has several advantages over thermal processes, including the capability to produce multi-carbon products under ambient conditions. CO2 electrolyzers will benefit from operating at higher temperatures due to a decrease in the activation overpotential, and improved ionic conductivity, reducing ohmic losses and overall cell potential. Through the few non-systematic studies that have investigated the effects of elevated temperature, it is known that higher temperatures are linked with an increased total current density for electrochemical CO2 reduction at a given voltage. However, predicting the role of temperature can be challenging, as operating at higher temperatures typically results in lower CO2 solubility and changes in diffusion coefficients and reaction rates. Additionally, there is still no general agreement on the role of temperature on product distribution, due to the lack of common testing conditions; many factors like electrocatalyst type, operating conditions, membrane stability, and cell configuration can heavily influence such trends. Herein, we conducted a systematic study of the effects of temperature on CO2 electrolysis over Cu-based GDEs in a zero-gap cell configuration. We show that operating at elevated temperatures improved activity and selectivity towards CO2-derived products, lowered product crossover, and enhanced stability by suppressing the hydrogen evolution reaction (HER). Operation at >50 °C constitutes a possible route for operating CO2E cells under industrially-relevant conditions. Finally, we studied the effect of the heating methods showing its importance as a lack of proper heating technique can lead to misleading conclusions on the effect of temperature on mass transport and product distribution. |
Introduction
CO2 electrolysis (CO2E), powered by renewable energy sources, offers a sustainable approach to converting CO2 into chemicals and fuels.1,2 Recently, it has been shown that CO2E using zero-gap electrolyzers, known as membrane electrode assemblies (MEAs), can achieve industrially relevant conditions with high C2+ selectivities, reducing mass-transfer resistances and ohmic losses inherent to liquid-based CO2 electrolyzers.3–5 While most CO2E research has been done under ambient conditions, commercial CO2 electrolyzers will most likely be operated at elevated temperatures (>50 °C) due to the heat generated by overpotentials and resistive losses, especially on an industrial scale.6 Additionally, investigating the temperature dependence on CO2E may provide insights into its role in the mechanism of the electrochemical steps while identifying the optimal conditions for boosting electrocatalytic performance.Although a temperature rise should improve the activity and lower the cell potential, its intrinsic effect has not been thoroughly investigated. The lack of defined trends for electrochemical CO2 reduction (CO2R) relates to the complex interactions between numerous factors. Temperature affects CO2 solubility and diffusion coefficients and influences mass transport.7–9 Furthermore, temperature changes will shift the reaction environment, equilibrium potentials, and the adsorption equilibria of intermediates, which can result in changes in electrocatalytic and homogeneous reactions (associated with the formation of the carbonate species) rates.9,10 Temperature also improves the membrane conductivity (σ), reducing ohmic overpotentials,11,12 and influences the water/liquid transport by modifying the electroosmotic fluxes (JEOD) and evaporation rates.13 A schematic representation of the effect of operating temperature on some reaction parameters and transport properties for CO2R is shown in Fig. 1 and detailed in Fig. S1 and S2 (ESI†).
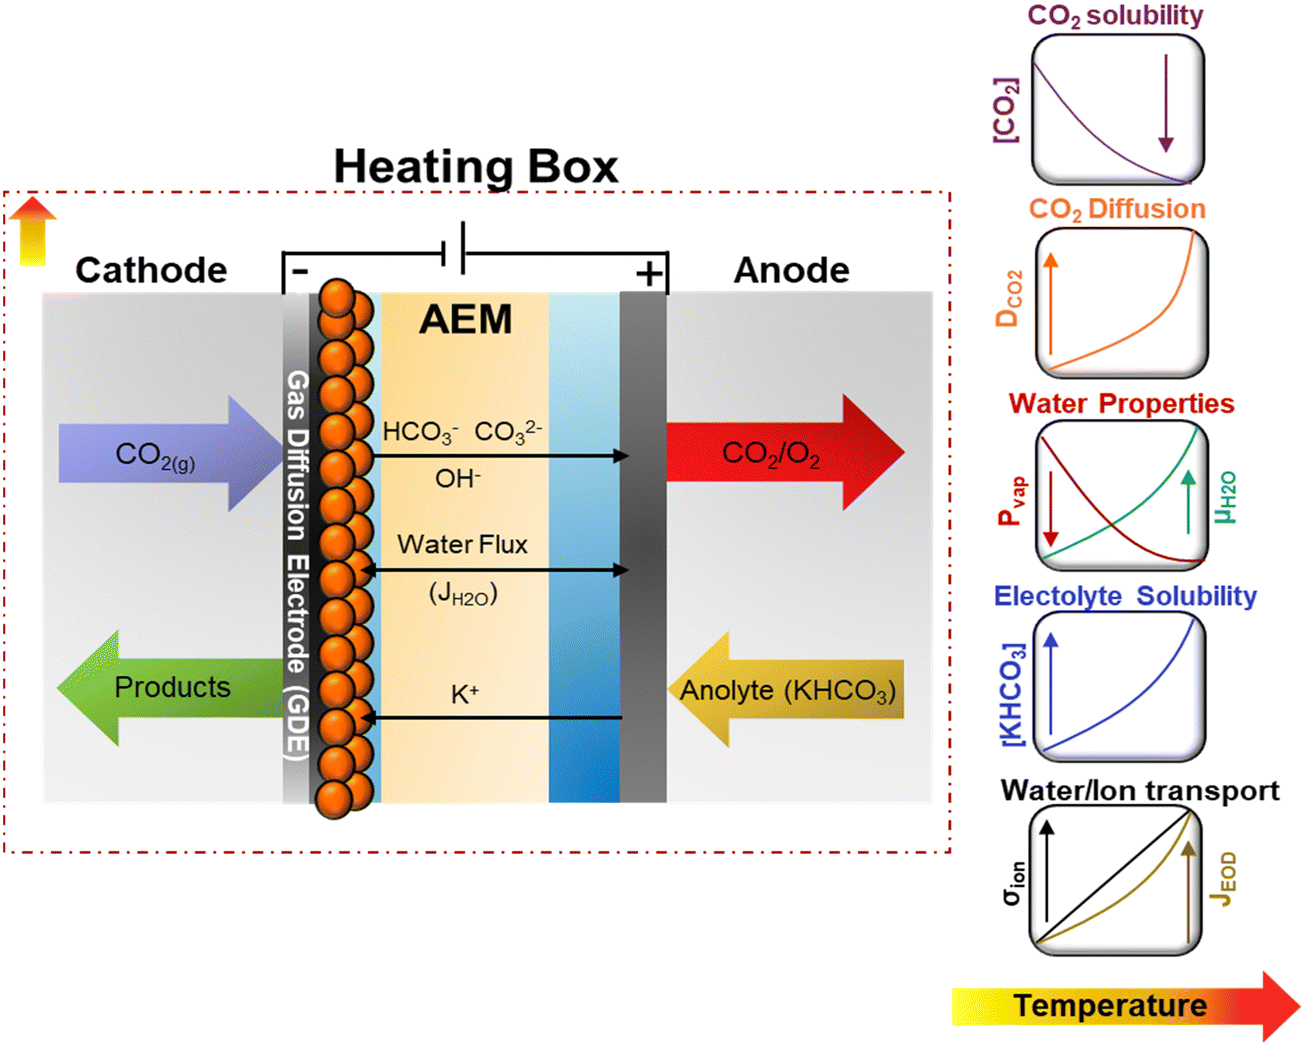 | ||
| Fig. 1 Schematic representation of temperature dependency on transport and kinetics properties on CO2E in zero-gap configuration. Equations for the presented trends for the different properties can be found in the ESI.† | ||
Despite studies incorporating temperature-dependent experiments or computational models,14–16 there have been few systematic investigations of temperature's impact on CO2E. The compiled data for different CO2E studies at elevated temperatures is shown in Fig. S3 and Table S1 (ESI†). One of the first fundamental studies of temperature effects related to electrochemical CO2 reduction (CO2R) was conducted by Hori et al.17 On Cu, they showed that CH4 selectivity is favored at low temperatures (below ambient conditions), while CO, C2H4, and H2 selectivities increase with temperature (up to 40 °C). Ahn et al. reported similar selectivity trends over Cu at −1.60 V vs. Ag/AgCl at the same operating temperatures, which they attributed to changes in CO2 solubility and local pH caused by a higher buffer capacity at these conditions.18 Recently, studies conducted by Vos et al. examined the effects of temperature, cation identity, and electrolyte on Au9 and Cu-electrocatalysts19 and concluded that the interaction between these factors influences the activity, product distribution (mainly towards C1 products), and activation energy of CO2E.
Additionally, the influence of temperature on CO2E has been evaluated using GDEs-based electrolyzers. For example, Lowe et al.7 examined how temperature impacts formate (HCOO−) formation over Sn-GDEs using a flow cell electrolyzer with a catholyte layer. They found an increase in selectivity (FEHCOO− = 80%) and current density (up to 1 A cm−2) by shifting from room temperature to 50 °C, while hydrogen evolution reaction (HER) dominated at 70 °C due to the interplay effects between the solubility and diffusion rates. Jeng and Jiao studied the effects of temperature on CO2 conversion on Ag-GDE.20 At 60 °C, they observed an increase in the CO2 single-pass conversion due to an enhancement of the CO2E and homogeneous reactions at elevated temperatures. Alternatively, a study by Dufek et al. on Ag-electrocatalyst showed a decrease in cell potential at a constant current density by increasing the temperature, with enhanced CO selectivity at 35 °C and a decrease at 70 °C due to limited CO2 mass transport.21 Endrodi et al.15 evaluated the temperature effects on PiperION anion-exchange membrane (AEM) and Garcia de Arquer et al.14 evaluated the temperature effects of different ionomers on the CO2E performance.
When investigating temperature effects on CO2E, it is crucial to ensure uniform heating and temperature control to avoid inaccurate selectivity and water management trends. For example, a lack of uniform heating may lead to a temperature gradient across the cell and reactor components, affecting the water supply, transport, and distribution (from humidified CO2 or the anolyte) into the system.16 Therefore, it is essential to accurately measure and control the temperature at critical locations in the cell to evaluate its actual effect on CO2R.
This work focused on a holistic and systematic study of temperature effects on AEM-zero gap-based CO2E cells containing Cu-cathode GDEs. We conducted electrochemical measurements, partial pressure experiments, and in situ attenuated total reflectance surface enhanced infrared absorption spectra (ATR-SEIRAS) studies to evaluate how diffusion, solubility, kinetics, and mass transport vary with temperature and influence performance. Lastly, we assessed the effects of different heating methods and demonstrated the importance of proper heating control for CO2E evaluations.
Experimental methods
Chemicals and materials
Ultra-pure water (UPW) used throughout this study was generated using a purification system (resistivity = 18.2 MΩ cm). KHCO3 (Sigma-Aldrich 99.995% Trace metal basis) and CsHCO3 (Sigma-Aldrich 99.995% Trace metal basis) were used for the electrolyte preparation or membrane activation before the experimental tests. HAuCl4 (98.0%), NH4Cl (99.0%), Na2SO3·Na2S2O3·5H2O, and NaOH were purchased from Alfa Aesar (China) Chemical Co., Ltd, while HF used to prepare the Au-films for ATR-SEIRAS was purchased from Sigma Aldrich (ACS reagent).Electrode preparation and electrolyzer configuration
The cell and all the reaction components were placed in a heating oven with a PSU/control box interface coupled to Raspberry Pi as a PID controller. Thermocouples were placed in the electrochemical cell (cathode and anode flow fields), the humidifier, inlet, outlet streams, heating plates, and the electrolyte reservoirs. The experiments using alternative heating methods (cell not located in a heating oven) were: (1) preheating the anolyte with a heating plate coupled with a temperature controller or (2) attaching heating rods directly into the electrolyzer, controlled with a homemade PID temperature controller. Schematic representations of these heating systems can be found in ESI† (Fig. S4).
 | (1) |
 | (2) |
![[thin space (1/6-em)]](https://www.rsc.org/images/entities/char_2009.gif) 485 C mol−1), I is the total current, and A is the electrode area. The molar flow rate was estimated by measuring the volumetric outlet flow and the ideal gas equation. The volumetric gas flow at the outlet (both anode and cathode) was measured either by using a volumetric flow meter (MesaLabs, Defender 530+) or (2) by introducing an N2 bleeding flow (Linde, 5N) before the GC with a known concentration.
485 C mol−1), I is the total current, and A is the electrode area. The molar flow rate was estimated by measuring the volumetric outlet flow and the ideal gas equation. The volumetric gas flow at the outlet (both anode and cathode) was measured either by using a volumetric flow meter (MesaLabs, Defender 530+) or (2) by introducing an N2 bleeding flow (Linde, 5N) before the GC with a known concentration.
Our liquid samples were obtained from both reaction compartments. Samples were collected from the cathode after the CO2 outlet line using a condensation unit and cold trap to measure the vapor-phase liquid products. Samples were collected from the anode from the anolyte (crossover products through the AEM). The liquid products were quantified using high-performance liquid chromatography (HPLC, Agilent 1260 Infinity II) with 5 mM H2SO4 as the mobile phase and 0.1 KHCO3 as the reference solution. 1.5 mL aliquots of collected samples were introduced into the sampling valves. Our HPLC included a quaternary pump (up to 400 bars for eluent transport), an auto-sampler, a packed column (Aminex HPX-87X), and two detectors (refractive index detector, RID, and diode array detector, DAD).
Results and discussions
Fundamental studies using ATR-SEIRAS
On Cu-based catalysts, CO2E is well-known to go through a CO-intermediate to C2+ products.23 CO adsorption on Cu was initially investigated using ATR-SEIRAS to determine whether it would provide fundamental insights into the temperature effect before conducting the CO2R in a zero-gap electrolyzer. Fig. 2 represents in situ ATR-SEIRA spectra in 0.1 M KHCO3 for the CO signal (2050 cm−1) at different cathodic potentials and temperatures (the full SEIRAS spectra for each measurement are found in Fig. S5 and S6, ESI†).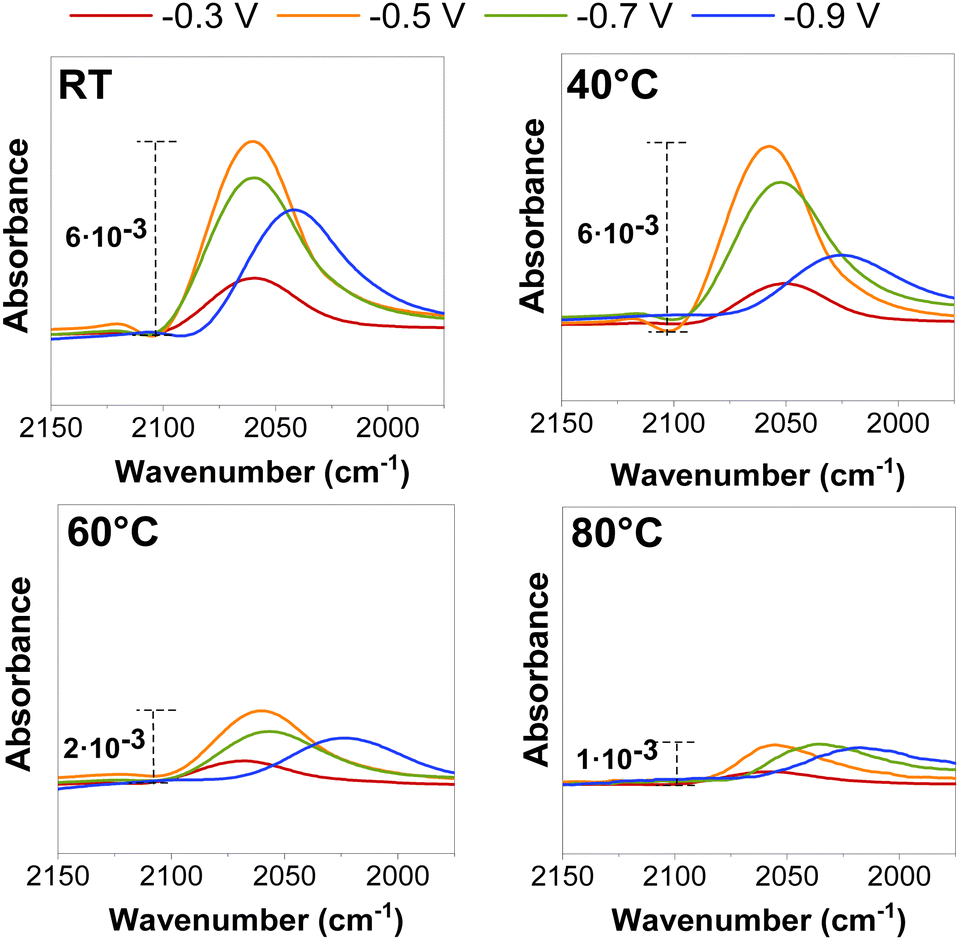 | ||
| Fig. 2 ATR-SEIRAS CO adsorption peak for electrochemical CO reduction at different potentials (vs. RHE) and operating temperatures. The CO partial pressure for each operating temperature is detailed in Fig. S5 and S6 and estimated with eqn (S12) (ESI†). | ||
Independent of the temperature, a decrease in the CO peak position (shifting of the wavelength) and intensity was observed at more cathodic potentials (≥−0.5 V vs. RHE) at potentials where there is substantial CO surface coverage, as previously reported in the literature.24,25 These peak shifts and intensity variations may be related to chemical changes caused by either bonding changes between the adsorbed CO and the surface or to the Stark effect, which occurs when the dipoles interact with the electric field at the interface.26 However, those effects appeared to be enhanced when the temperature was raised, as both the intensity area and stretching frequency of the CO peak decreased at all measured potentials (Fig. S7, ESI†), presumably due to a decrease in the CO coverage at the catalyst surface.
While the precise CO coverage at the surface was not quantified, we estimated the relative concentration using the intensity and area of the CO peak. Our ATR-SEIRAS spectra do not vary significantly between ambient conditions and 40 °C at less reductive potentials (<−0.5 V vs. RHE) as peaks do not decrease their intensity, indicating a near-saturated CO concentration at the surface. We notice a difference at very reductive potentials (>−0.9 V vs. RHE), but this may be on the edge of further reduction to C2+ products. The catalytic benefit of operating at higher temperatures may be influencing this. Interestingly, experiments at 60 °C showed a significant decrease in peak intensity due to lower CO coverages at a higher temperature under equilibrium conditions, assuming the same local partial pressure of CO for all the measured potentials.13 (Variations in adsorption as a function of partial pressure are shown in Fig. S5 and S6, (ESI†)). These results give a preliminary indication that we may observe more CO–CO coupled selectivity (i.e., C2+ products) at temperatures below 60 °C and a higher CO selectivity at temperatures above this magnitude.19
Temperature effects on the cathodic activity
The influence of temperature on the cathode activity was initially assessed by recording polarization curves via linear sweep voltammetry (LSV, 20 mV s−1), as shown in Fig. 3a, and chronoamperometry measurements (Fig. S8, ESI†) using aqueous 0.1 M KHCO3 as an anolyte. Polarization curves show that the temperature has a pronounced effect on the total current density, increasing approximately 3-fold at 80 °C compared to ambient temperature at the same cell potentials; this corroborates with prior observations reported in the Lowe et al.7 and Vos and Koper's studies.9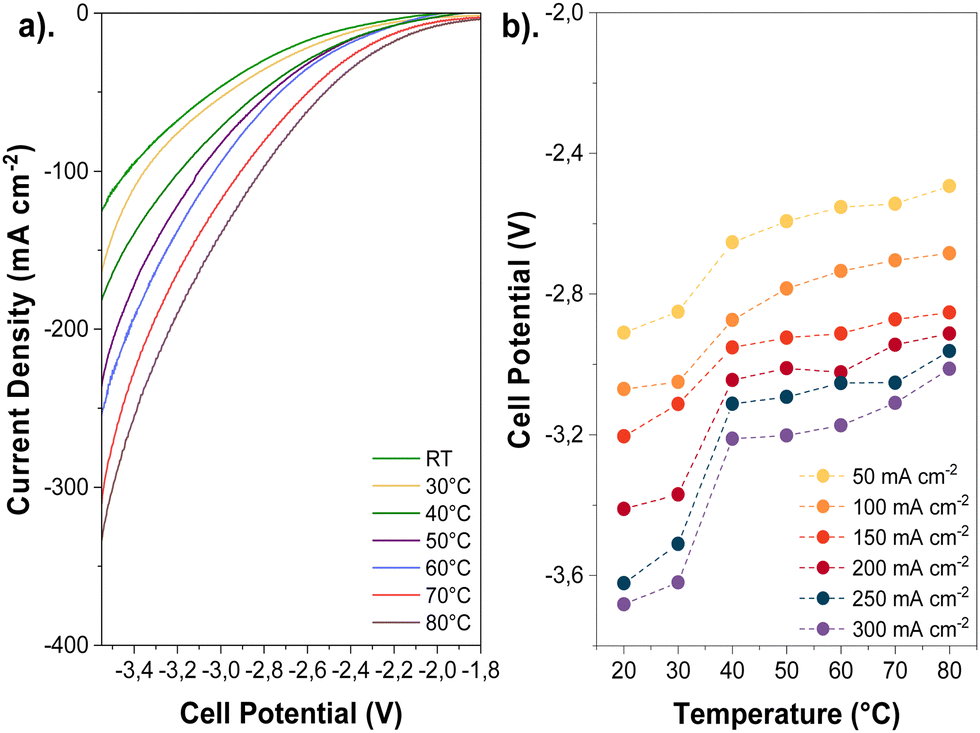 | ||
| Fig. 3 Temperature effects on the cathode activity through changes in total current density and cell potential at different temperatures: (a) LSV measurements at different cell potentials and (b). Cell potential values as a function of total current density. Experimental conditions: Cu-GDE (cathode), MPIP-AEM, IrO2 (anode), CO2 feeding rate: 20 sccm, 0.1 M KHCO3 as anolyte. | ||
Although the polarization curves are too short to detect products, longer-term experiments at similar temperatures and high current densities initially show a dominant selectivity towards CO2R over H2 evolution (HER) before the onset of any degradation or flooding mechanism during electrolysis (Fig. S9, ESI†). The exact time for flooding can be inconsistent, especially near the mass transport limit of a given electrode. (See Fig. S9 versus Fig. S29, ESI†). Thus, linear sweep data can be used as a proxy for CO2 reduction activity. Moreover, we calculated the thermodynamic equilibrium potential for multiple CO2R products, which revealed a slight negative shift at higher temperatures (−20 mV and −37 mV shifts for CO2R to CO and C2H4, respectively, when rising from 20 to 80 °C). This suggests that temperature affects overpotentials linked to kinetics and mass transport more significantly than the thermodynamic potentials (Tables S2 and S3, ESI†).
The enhanced gas diffusivity and ion conductivity at high temperatures may reduce the ohmic resistances associated with the electrode and AEM. Overall, elevating the temperature lessened the cell potential (Fig. 3b) and ohmic resistances (Fig. S10, ESI†) during CO2E. Furthermore, the cell potential decreased for all tested current densities as the temperature was increased (e.g., 500 mV reduction from ambient to 80 °C at 200 mA cm−2). Such voltage and ohmic resistance drops can be correlated with a higher cathode activity and ionic conductivity across the AEM (Fig. S11, ESI†).27 However, comparing our results of the current interrupt (Fig. S10, ESI†) and recorded impedance spectra (Fig. S12, ESI†), we determined that the high-frequency resistance (HFR) decreased by less than 0.6 Ω cm2 when the temperature was elevated, resulting in only 120 mV voltage reduction at 80 °C and 200 mA cm−2. Thus, the overall cell potential change was primarily caused by improved reaction kinetics rather than changes in ionic conductivity.
Temperature effects on selectivity and product distribution
We conducted detailed chronopotentiometry (Fig. 4 and 5) and chronoamperometry (Fig. S13, ESI†) measurements to explore how temperature affects product selectivity in zero-gap configuration. Fig. S14 (ESI†) shows pre- and post-test SEM images for both room temperature and 60 °C tests from Fig. 5, whereas Fig. S15 (ESI†) shows the corresponding XPS analysis of these samples. Our experiments showed that at operating temperatures below 50 °C, there were no notable changes in the faradaic efficiencies for CO and C2+ products compared to those at ambient conditions (e.g., 15 ± 2% and 43 ± 3% at room temperature at 200 mA cm−2, for CO and C2+ respectively compared to 17 ± 3% and 47 ± 5% at 40 °C). However, when the temperature was raised to 50 °C, there was a drastic increase in CO selectivity with faradaic efficiencies above 40% for all the measured current densities. These results are consistent with our observations from the ATR-SEIRAS CO desorption studies at elevated temperatures (Fig. 2). The shift in selectivity is believed to occur as CO more rapidly desorbs from the electrode surface at elevated temperatures, leading to lower CO coverages rather than forming C2+ products.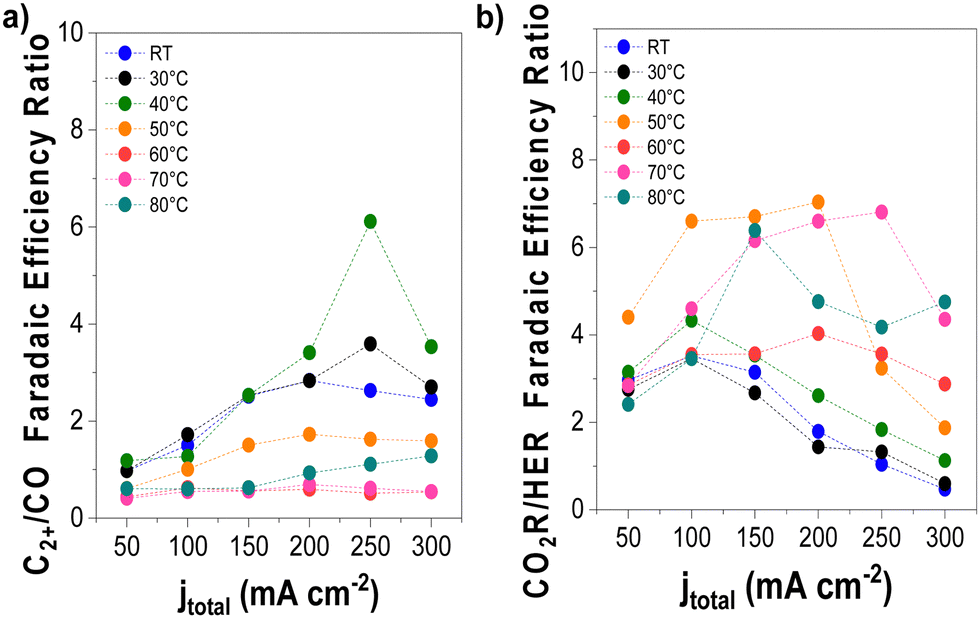 | ||
| Fig. 4 Selectivity trends as a function of operating temperature and applied current density. (a) C2+/CO and (b) CO2-derived products/H2 FE ratio. Experimental conditions: Cu-GDE (cathode), MPIP-AEM, IrO2 (anode), CO2 feeding rate 20 sccm, 0.1 M KHCO3 as anolyte. Results are paired with those presented in Fig. 5. | ||
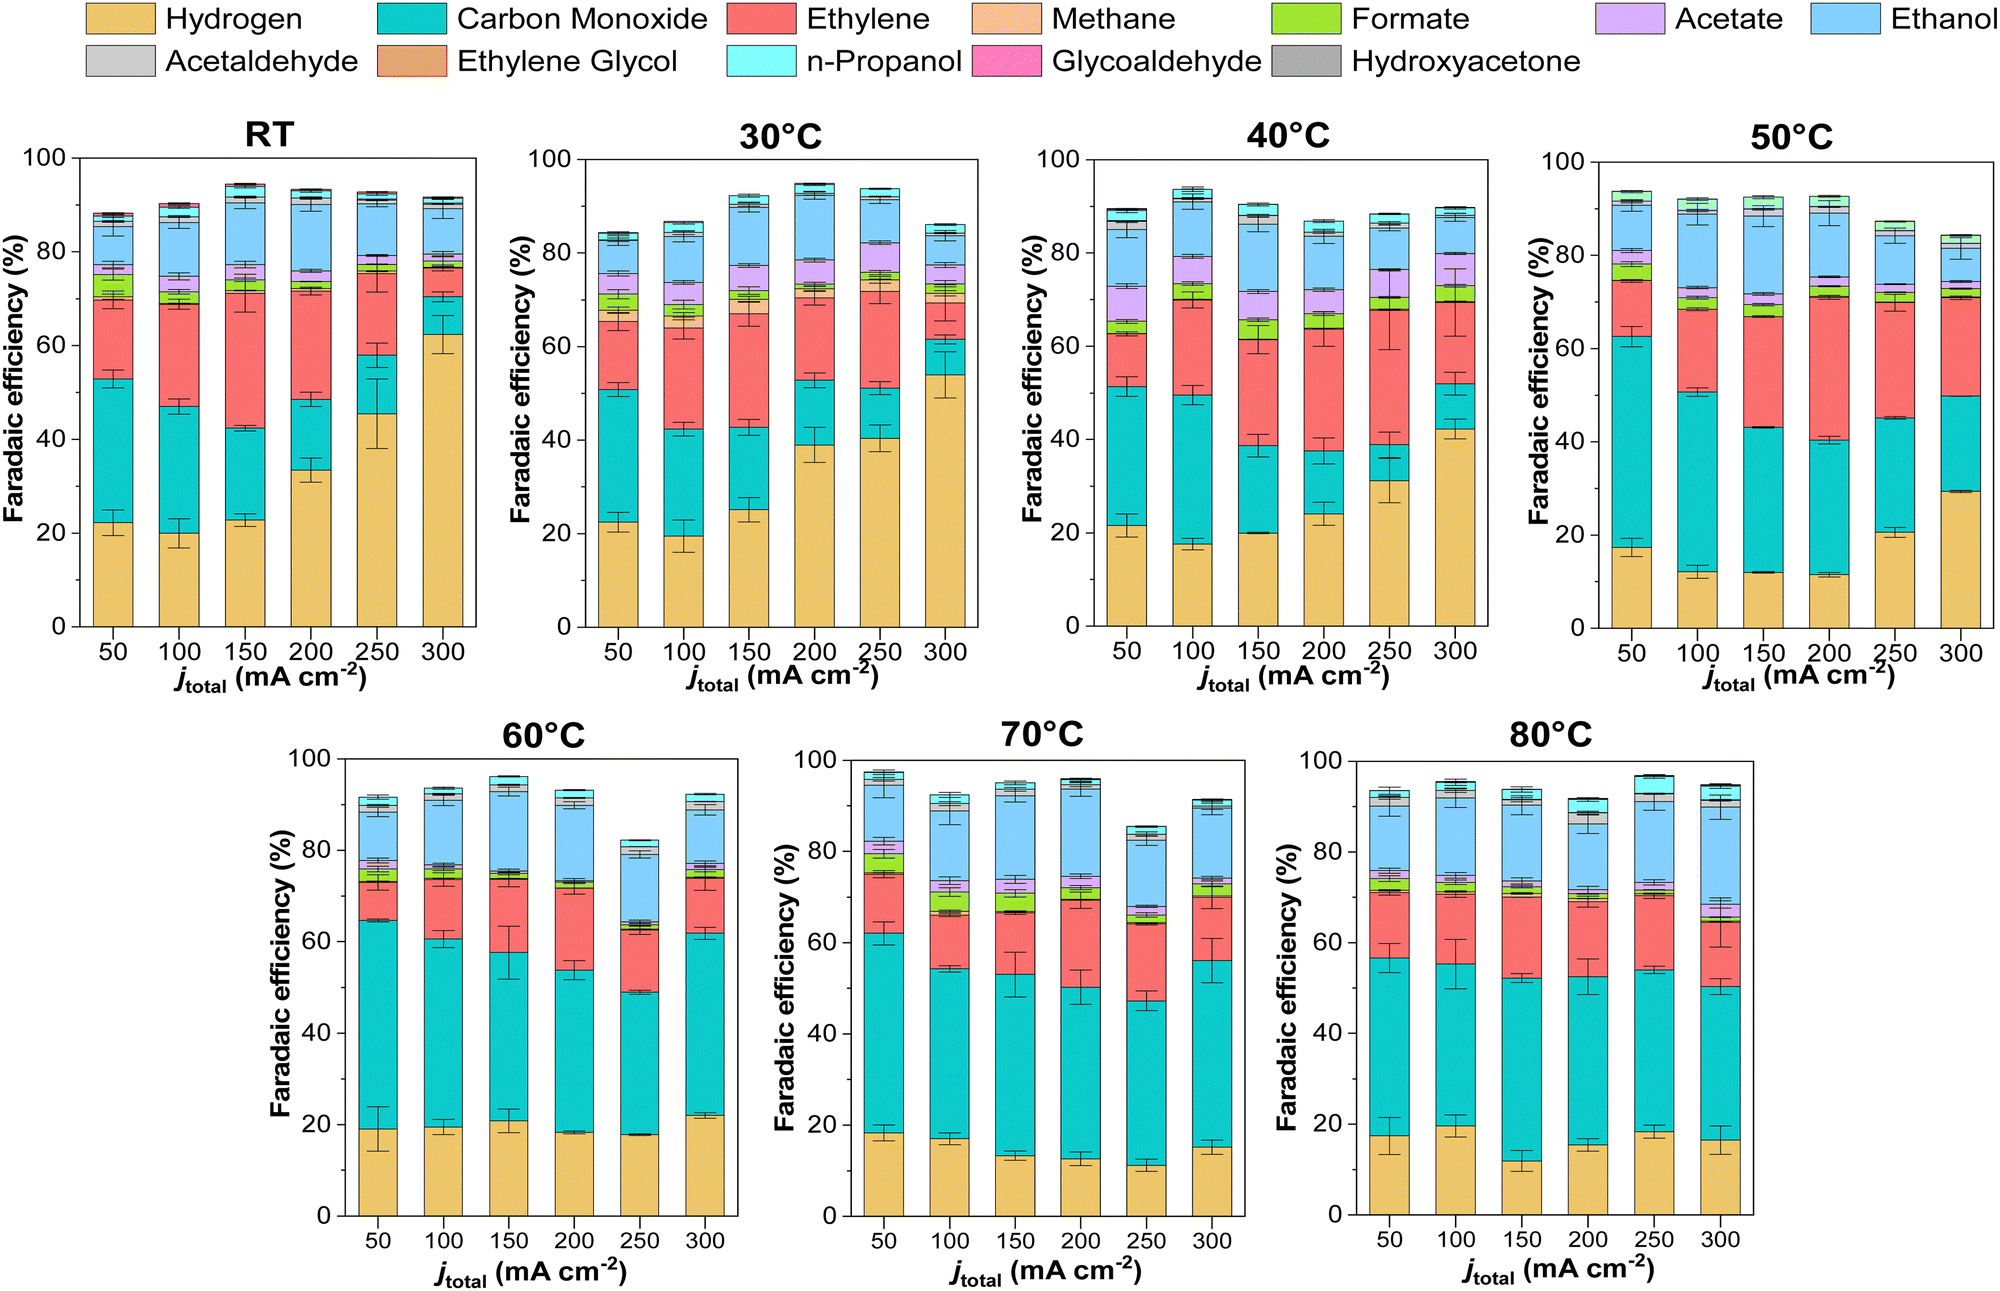 | ||
| Fig. 5 Temperature effects on the product distribution for CO2R over Cu-based electrocatalysts using zero-gap configuration at different temperatures and current densities. Experimental conditions: Cu-GDE (Cathode), MPIP-AEM, IrO2 (Anode), CO2 feeding rate 20 sccm, 0.1 M KHCO3 as anolyte. Error bars represent the standard error of the independent measurements at each different reaction condition. | ||
The high CO selectivity at increasing temperatures could be resolved by designing a system that produces a high local CO pressure. However, the catalyst-adsorbate binding free energy scales linearly with temperature and logarithmically with pressure, which could lead to the need for excessively high CO partial pressures. As CO can form carbonyls with Ni or Fe from steel and the reaction equilibrium scales with CO pressure by a factor of 4 and 5, respectively (since it produces Ni(CO)4 or Fe(CO)5), this could make practical issues complicated. Alternatively, a catalyst with a slightly higher CO binding strength, such as Ni or Pd, may be more viable. However, pure Ni would struggle due to Ni(CO)4, and the concomitant evaporation of the catalyst and Pd may have H-intercalation issues.28 Although there are ways to increase CO selectivity at higher temperatures, it is uncertain if the added complexities are worthwhile.
To analyze the catalysis at the cathode in MEA devices further, we used a 5-electrode configuration pioneered by the Jiao group.29 Using this approach, we measured potentials at 100 mA cm−2 and found that the cathode potential drops from −1.6 V vs. SHE to −1.1 V vs. SHE as the temperature increases from 30–80 °C (Fig. S16, ESI†). With the complexity of this method and inherent imprecisions, it is best to take these values as qualitative rather than quantitative. There was a slight increase in potential between 70–80 °C, which could be an indicator of the onset of gas diffusion layer or membrane degradation and concomitant contamination of catalysts.
Fig. 4 illustrates the selectivity trends as a function of the operating temperature in relation to C2+/CO and CO2R products/HER ratios. This allows us to see that the overall trend entails that the C2+/CO ratio continues to increase as a function of total current density. Chronopotentiometry experiments are advantageous because the fixed current is accompanied by constant mass transfer and local pH despite the varying potential during electrolysis (simple Tafel analysis has shown that operating at high current densities led to higher cathodic overpotentials).30 It is well known that the selectivity towards CO dominates over the C2+ products at low overpotentials; however, at higher overpotentials, the potential is reductive enough to bind CO strongly to the surface, versus the time needed for C–C coupling. This explains why the C2+/CO ratio increases with the current density. Chronoamperometry tests also showed such trends, exhibiting a higher C2+/CO ratio at larger cell potentials (Fig. S17, ESI†). The abrupt shift at 300 mA cm−2 at lower temperatures is attributed to the electrode flooding, thus significantly enhancing the selectivity towards HER.
Temperature also impacts the C2+/CO ratio, which generally increases to 40 °C at a constant current density before decreasing above this temperature. A shrinking C2+/CO ratio at temperatures above 40 °C can easily be ascribed to the aforementioned CO desorption trends shown in Fig. 2. However, at temperatures at and below 40 °C, Fig. 2 implies a relatively constant, near-saturated CO coverage, thus the increase in the C2+/CO ratio cannot be solely attributed to this phenomenon.23 As the C–C coupling is an electrocatalytic reaction (though not a faradaic reaction), the temperature should influence its rate. Although we cannot definitively say which factor has a more significant impact on the C2+/CO ratio under 40 °C, based on these results, it does appear that high CO coverage/binding strength and CO diffusion plays a role.19
In terms of selectivity towards specific CO2-derived products, interestingly, as the CO selectivity increases, this seems to disproportionately decrease the ethylene selectivity compared to ethanol, possibly indicating a parameter to vary the ethylene/ethanol ratio (Fig. S17–S19, ESI†). A decrease in ethylene is observed at high temperatures, where *CO coverage is low, suggesting that *CO coverage may influence ethylene selectivity.31 Additionally, CH4 (Fig. S17, ESI†) was observed to be entirely suppressed at higher temperatures, in agreement with previous studies and DFT calculations, attributed to the adverse effect of temperature on proton shuttling and the stabilization of its intermediates.10,18
Regarding the ethanol selectivity, no major changes were observed by increasing the operation temperature (Fig. 5 and Fig. S18, ESI†). However, as expected, an increase in temperature resulted in increased evaporation of ethanol at the cathode (Fig. S18, ESI†). In general, most liquid products in our experiments were detected at the anode, with only 20–30% of products being detected by condensation in the wash stream after the cathode outlet. As the temperature increased, volatile products were transported through the GDE due to enhanced evaporation. However, at 80 °C there was still 35–50% of the total ethanol produced being extracted from the anode compartment.
It should be noted that diffusion will also increase as a function of temperature. Literature has shown that ethanol's diffusion coefficient in water will increase by a factor of ∼3 going from 25 °C to 85 °C. However, at the same temperature range, the vapor pressure will increase by a factor of 16, entailing that improved evaporation at higher temperatures will be the dominant factor in whether ethanol stays on the cathode or migrates to the anode.32 Hence, a temperature rise may represent a strategy to concentrate ethanol at the cathode compartment, thereby reducing the separation costs of CO2 derived products.5,33 Negatively charged compounds do not experience a change in their crossover rate due to electromigration across the AEM and lack of a vapor pressure. Traces of formate and acetate were found in the cathode wash, suggesting that these non-volatile products had been transferred via microbubbles during gas stripping.34
H2 selectivity shows an exciting trend with temperature. We observed that a low-temperature regime (< 40 °C) has a marked increase in the H2 faradaic efficiency; however, when increasing the temperature, the selectivity unexpectedly drops. Excessive selectivity towards HER is usually a result of cathode flooding, often accompanied by mass transfer issues at higher current densities. In our system, however, HER selectivity decreased at temperatures beyond 50 °C, indicating that CO2 mass transport limitations are not the primary determinant of HER selectivity under these operating conditions, but rather the water management. Water management and flooding issues are complex in CO2 electrolysis devices and depend on multiple factors, including the membrane. In MEA-cell configurations, AEMs do not directly influence catalytic activity. Still, they can modify the local reaction environment and water transport and indirectly influence product selectivity, especially when comparing CO2-reduced products versus H2.35 A temperature rise will increase the electroosmotic drag coefficient due to greater ion mobility and diffusion-driven transport processes across the membrane. Further, the membrane's water content is intrinsically influenced by temperature, which may alter AEM hydration, water uptake, and thus the overall water flux in the system.30,31
Using an AEM entails electroosmotic drag (EOD) of ions to the anion (9H2O/CO32−, 1.5H2O/OH−),36 which provides a mechanism beyond evaporation for water to be removed from the cathode. To our knowledge, the temperature dependency of EOD in AEMs has not been analyzed. In cation exchange membranes, which should follow a similar trend, temperature effects are unclear, with reports noting that EOD is either temperature-independent37 or increases electroosmotic drag slightly.38 Furthermore, it should be noted that even if the cathode is 100% humidified (even locally near the catalyst/membrane interface), the chemical potential difference between the cathode and membrane is negligible, thus not providing sufficient driving force (water flux) to flood the cathode-GDE.39,40
Even though the water concentration at the interface of the catalyst-membrane remains stable, regardless of the relative humidity at the inlet feed, there is still a small hydrostatic pressure from the anodic water (5 mbar), which is typically negligible. However, previous works have shown salt deposition can occur deeper in the GDE layer which restricts gas flow.41,42 If our catalysts are consuming CO2 into liquid products, C2+ gas products, and carbonates, this will decrease the local CO2 pressure at the cathode. In this case, the hydrostatic pressure difference may become substantial dragging water to the cathode and flooding it. As we are incapable of measuring local pressure in the plane of the catalyst, it is hard to determine if this is a substantial effect or negligible.
Additionally, from a pure reaction stoichiometry standpoint operating at elevated temperatures with fully humidified cathodes inlet streams will mean higher absolute water contents in the CO2 supply gas (e.g., at 100% relative humidity, H2O content is 3 mol% and 43 mol% at 25 and 80 °C, respectively).43 As a result, both water and CO2 concentrations in humidified gases are affected by temperature. Our exploratory experiments showed negligible differences when the relative humidity (RH) was varied, except for high temperatures and low RHs, where we observed a slight increase in HER selectivity (Fig. S20, ESI†), which supports some of the selectivity trends reported in the literature.40
Under high temperatures and low RH conditions, degradations in AEM chemistry are more visible. Higher temperatures may reduce membrane overpotential, but this also facilitates performance degradation.44 To demonstrate this we operated at 90 °C (Fig. S21, ESI†) for 1 hour in fully humidified gas. In these tests, we used a porous silver membrane catalyst/gas diffusion layers (Sterlitech Inc., purity 99.97%)22 as this is an excellent benchmark catalyst and eliminates any issues related to a carbon-based gas diffusion layer degradation. This allowed us to see that while commercial membranes Sustainion and PiperION were unstable, the RG-MPIP did show better stability (though still with some issues- see Fig. S21, ESI†). However, the RG-MPIP AEM did show substantial stability issues when operating at low RH levels (Fig. S22, ESI†) even at a slightly reduced temperature (80 °C instead of 90 °C). Thus, any H2 selectivity issues at low RH may be strongly influenced by membrane degradation and, therefore, unreliable. At least partially because of this, it was found that fully humidified CO2 inlets had the optimal performance at mitigating HER and ensuring more stable operation.
Another factor that could affect H2 selectivity is the salt solubility in the electrolyte. A well-known fact is that cathodically produced OH− forms carbonates, resulting in salt precipitation of carbonates such as KHCO3, in our case.42 Salt deposition blocks the flow field and GDE, which restricts CO2 mass transfer, thus favouring hydrogen selectivity.41 As salt solubility increases with temperature, the higher operating CO2 electrolysis should have fewer issues with salt deposition and concomitantly less HER.42 Reducing the salt concentration from 100 mM to 50 mM slightly diminished the H2 selectivity (Fig. S23, ESI†). However, further decreasing this to 10 mM increased the HER selectivity, though this lower electrolyte boosted the voltage significantly (−3.4 with 50 mM vs. −3.8 V at 10 mM). One potential reason could be that the salt concentration may not provide a substantial enough electric field in the Helmholtz plane to allow sufficient CO2 reduction. Another approach to mitigate salt deposition is using a more soluble salt such as Cs.42 Switching to CsHCO3 as an electrolyte showed minimal changes in H2 selectivity (from 21% to 17% at 0.1 M CsHCO3, Fig. S23, ESI†).
Temperature effects on CO2 utilization and mass transport
Temperature directly impacts CO2 mass transport since the CO2 solubility in aqueous solutions decreases at higher temperatures. Therefore, we varied the CO2 partial pressure (pCO2) using Ar at different temperatures. We adjusted the CO2/Ar ratio for all experiments at the measured temperatures to ensure the same local CO2 concentration during the experiments based on Henry's law (eqn (S.1)–(S.3) in ESI†). 13.5 mM was used as this coincided with the CO2 concentration in an aqueous solution at 1 bar and 80 °C, beyond which higher concentrations would entail using a pressurized reactor. The results of the variation in partial pressure tests are shown in Fig. 6.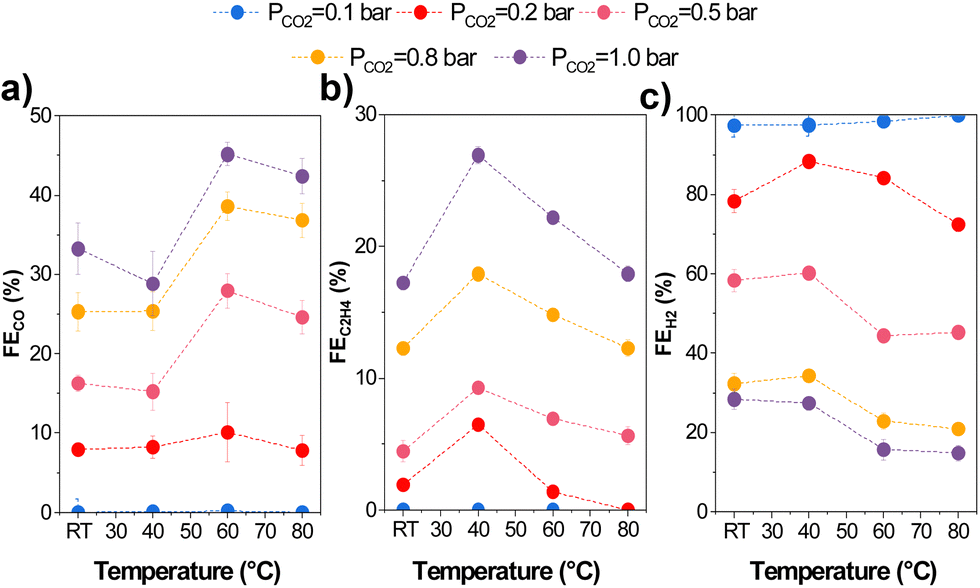 | ||
| Fig. 6 Product distribution and faradaic efficiencies of gas products at different operating temperatures and partial pressures of CO2 (diluted with Ar): (a) CO, (b) C2H4, and (c) H2. Experiments were conducted at 200 mA cm−2. Error bars represent the standard error of three independent measurements at each different condition. | ||
We found increased selectivity towards carbon-derived products and lower HER at pCO2 and temperatures above 0.5 bar and 60 °C. Specifically, gas product selectivity (both CO and C2H4) decreased with a reduction in pCO2 (e.g., FEC2H4 = 26% at pCO2 = 1 bar vs. 4% at pCO2 = 0.2 bar), as previously reported in the literature.45 The only significant change when varying partial pressures is a change in the CO2R/HER ratio, which increases with an increasing pCO2. This can be explained by CO2 being mass transport limited at low partial pressures, enhancing H2 selectivity. Interestingly, while the C2+/CO ratio varied quite substantially with temperature transitioning between 40–50 °C, the partial pressure had minimal effect on the C2+/CO ratio as observed.
In addition, we investigated the effect of temperature on electrode flooding by investigating changes in electroactive surface area. In most cases, this can be accomplished by measuring double-layer capacitance (DLC). Still, since the dielectric constant (κ) varies with temperature (for water, it decreases 22% when the temperature increases from 25 °C to 80 °C),46 we must also consider this. Thus, we measured the (DLC/κ) ratio after electrolysis at each current density and temperature (Fig. 7 and Fig. S24, ESI†). Since this work used a two-electrode cell, capacitance depends on the anode and cathode. Due to the fact that the gas diffusion electrode anode is immersed in an electrolyte that does not change with temperature or current density, we can qualitatively attribute the change in capacitance to the cathode.
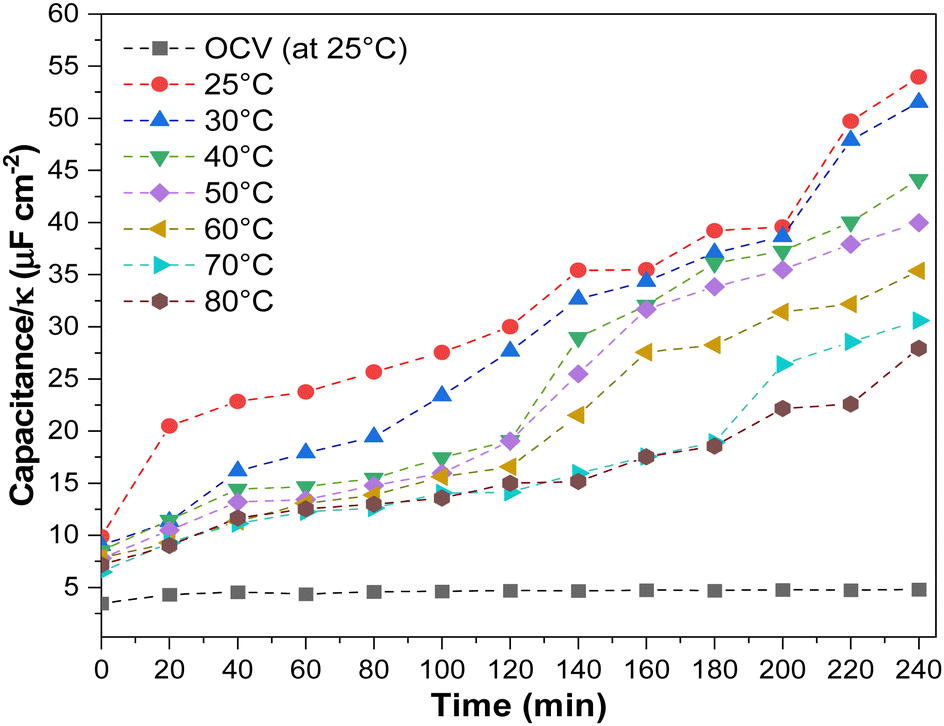 | ||
| Fig. 7 Tracking the electrode flooding by DLC measurements as a function of the operating temperature at 200 mA cm−2. OCV was conducted at room temperature. Experimental conditions: Cu-GDE (Cathode), MPIP-AEM, IrO2 (Anode), CO2 flow rate: 20 sccm, 0.1 M KHCO3 as anolyte. | ||
We observed variations in the DLC/κ as a function of operating temperature and experimental time. Before electrolysis, DLC/κ measurements at OCV revealed steady DLC/κ and no apparent changes at constant current density (200 mA cm−2). After 100 minutes of operation at lower temperatures, the DLC/κ increased, directly related to the spike in the HER. Generally, electrolyte penetration into the GDE increases gradually, causing progressive electrowetting at the electrode and influencing CO2 diffusion at the electrode.42,47 This is most evident at low temperatures. Higher operating temperatures resulted in a lower DLC/κ increment, which may have resulted in lower GDE electrowetting (Table S4, ESI†).47,48
Effect of the heating method on the CO2E performance
The lack of a standardized protocol for CO2E electrolyzer heat control makes comparing studies at high temperatures challenging. Therefore, we decided to analyze the impact of the cell heating methods to see how this impacted our results. In addition to having the cell in a temperature-controlled heating box, we also implemented two additional heating methods for heating the reaction. The first method only heated the anolyte reservoir (60 mL) to a given temperature with all other elements of the reactor system kept at room temperature. This was to test if the anolyte (a liquid with a high heat capacity) would be enough to maintain the electrolyzer at a uniform temperature. The second method was using heating rods that were directly connected to both the cathode and anode flow fields with a thermocouple inserted into the reactor to allow the reactor to operate at a given temperature. In all methods, we waited until the temperature was equilibrated before starting the electrolysis experiments to guarantee the desired operating conditions. The results of these measurements are shown in Fig. 8. The experiments were only performed at >60 °C as variations due to different heating methods would be most apparent at these higher temperatures.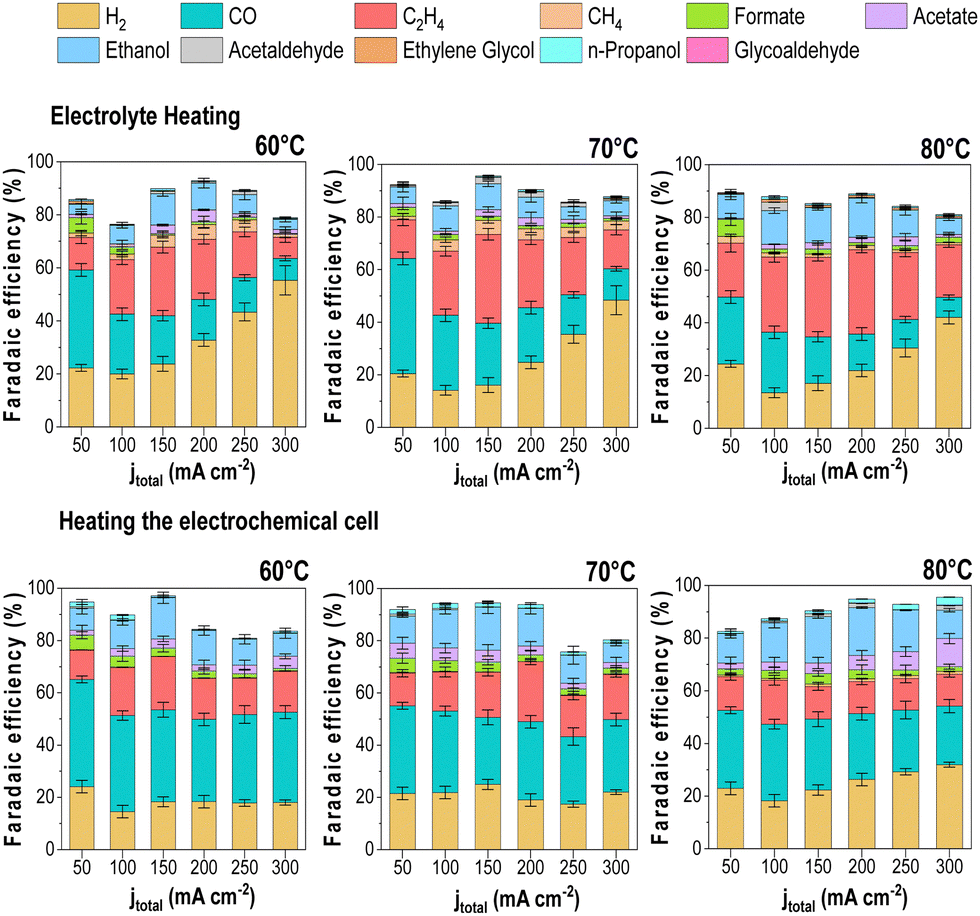 | ||
| Fig. 8 Effect of the cell heating in the product distribution using two different methods at different operating temperatures experimental conditions: Cu-GDE (Cathode), MPIP-AEM, IrO2 (Anode), CO2 flow rate: 20 sccm, 0.1 M KHCO3 as anolyte. Error bars represent the standard error of the independent measurements at each different condition. | ||
The results showed a few notable differences in the product distribution between the three heating methods. While only slight differences can be seen between the direct cell heating method and the use of the heating box (i.e., Fig. 5 results), significant variations were found when heating the electrolyte only, mainly regarding increased H2 selectivity. When we measured the cell temperature during these experiments, we found that heating the anolyte to 60 °C only led to a cell temperature of 28 °C, while a 70 °C anolyte led to a cell temperature of 32 °C, and 80 °C anolyte led to 35 °C.
When the cell temperatures are compared to Fig. 5, the results align more consistently with the observed trends. Such discrepancies between the electrolyte and the cell temperature's measured temperature might explain the variation in the overall product distribution trend for the three heating scenarios, thus demonstrating the importance of ensuring accurate cell operating temperature. Variations in faradaic efficiency between the “cell heating” method and our heating box may be due to differences in the CO2-humidified cell and the anolyte feed. These parameters were not heated under the cell heating scenario, which likely caused temperature gradients that impacted water management and selectivity.
We must also consider that CO2 electrolyzers generate heat from efficiency losses. Corral et al. described that temperature changes inside the electrolyzer alter the CO2 concentration at the gas–liquid interface, leading to CO2 mass transport limitations.49 By measuring the temperature near the cathode surface, they observed a temperature increase of 7 °C under 300 mA cm−2 (Ecell = −8.7 V) and 24 °C at 500 mA cm−2 (Ecell = −14 V) for CO2R and attributed these changes to the released heat by exothermic reactions at the surface. Considering the possible effects of resistive heating on our performance, we used a customized MEA cell that allows the placement of a thermocouple close to the GDE for more precise temperature measurement in the cell. Our room temperature experiments at 300 mA cm−2 had a cell potential of −3.58 V. The thermoneutral potential is approximately 1.4 V at this current density (determined via averaging products and their corresponding selectivity). As the electrode is 2.25 cm2, operating at 300 mA cm−2 resulted in ohmic heat production of 1.5 W. This, in turn, led to a temperature rise of 3 °C at the cathode (Fig. S25 shows temperature rise for current densities between 50 to 300 mA cm−2, ESI†). While this temperature rise is reactor-dependent, the slight change in our reactor entails that any temperature changes by resistive heating will not be significant in the system but may be significant when scaling these electrolyzers up to industrial levels.
Long-term stability of CO2E at elevated temperatures
We performed long-term experiments (50 h) at high temperatures to track product distribution and stability (using the RG-MPIP AEM). Fig. 9 shows cell potential and product distribution of electrolysis at 60 °C (using our heating box) and 150 mA cm−2. The temperature of the anode, cathode, humidifier, and electrolyte were all measured are are shown in Fig. S27 (ESI†), though all temperatures are very stable at 60 °C. The FE of gas products was calculated using the average of the simultaneous injections in the GC, and the liquid products were measured by periodically collecting anolyte and cathode samples. To avoid possible evaporation of the anolyte, we used a more extensive reservoir (400 mL vs. 60 mL in all other experiments) and maintained continuous operation to maximize GDE durability.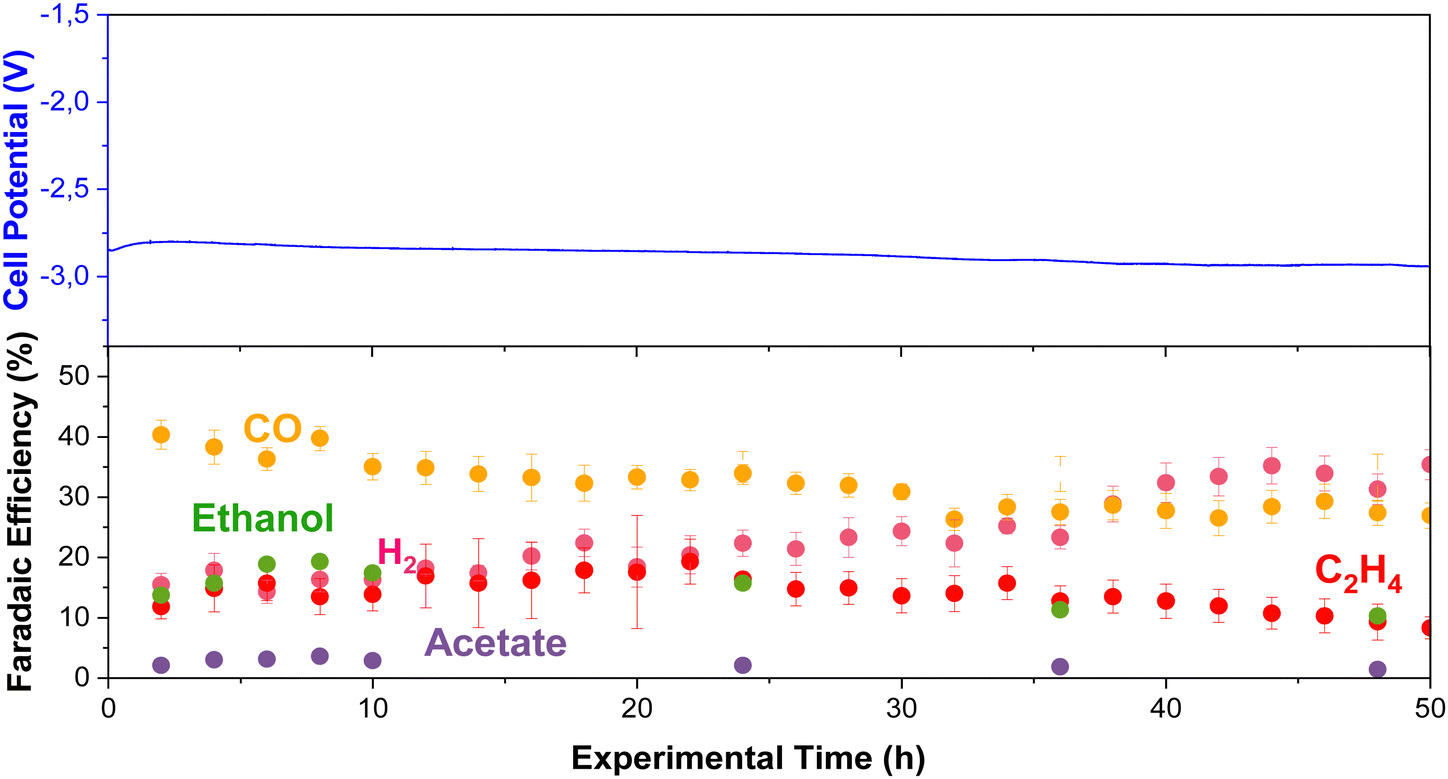 | ||
| Fig. 9 Long-term stability test at 60 °C and 150 mA cm−2 using Cu-electrocatalyst. Experimental conditions: Cu-GDE (Cathode), MPIP-AEM, IrO2 (Anode), CO2 feeding rate 20 sccm, 0.1 M KHCO3 as anolyte. Error bars represent the standard error of different injections and measured samples. | ||
The experiment stayed relatively constant in operating potential with an initial potential of −2.8 V and a final potential of −2.9 V. Initially, CO was the primary product (FE = 39%), but this slowly decreased over the 50 h test (FE = 25%). The selectivity towards ethylene fluctuated between 10–20%, possibly with slightly lower selectivity after 50 h. Initially, the FE for ethanol was relatively high with FE = 20%, although this decayed quickly to a stable plateau of FE = 10%. From the knowledge gained from earlier in this work (Fig. S18, ESI†), we know that under the CO2E conditions of Fig. 9, ca. 50% of the ethanol will evaporate off the cathode and be collected in the cold trap, and 50% will crossover to the anode. The longer the ethanol stays in the anode, the greater its chance of oxidizing. While this is unlikely to be the only cause for the measured ethanol selectivity to drop, it is potentially one significant factor. The acetate selectivity was lower at the beginning of the experiment, matching the trend presented in Fig. 3, but it was slightly higher after 24 h. This may be related to ethanol oxidation towards acetate at the anode, as complete oxidation to CO2 is not that facile.34 Furthermore, H2 continually increased from 15% to 38% at the end of the experiment, showing that flooding issues were slowly worsening.
Using an Ag membrane as a catalyst/gas diffusion layer allowed us to analyse whether the drop in performance could be due to membrane issues; however Fig. S26 (ESI†) shows constant selectivity over 50 hours, suggesting the Fig. 9 changes are probably not membrane related. Another long-term issue that needs to be considered is the anode. In this work, we used IrO2 deposited on carbon paper, and while studies in the literature show stable operations for 3000 hours,50 thermodynamically, carbon should oxidize quite readily. Thus, for more robust stability, a mixed metal oxide (e.g., Ti/IrO2) that is the standard for water electrolysis may be a better route moving forward.
To probe the stability at high temperatures a little deeper, we did durability studies at 80 °C (see Fig. S28, ESI†), and saw substantial degradation in selectivity even using a humidified cathode over a 50-hour test. We also tested at 400 mA cm−2 at 60 °C, 70 °C, 80 °C and 90 °C for 4 hours while measuring gas products (see Fig. S29, ESI†). The higher current densities are derived from higher voltages, which typically favor C2+ products over CO. However, similar to Fig. 5, an increased potential/current density does not particulary lead to higher C2+ products and as the temperature increased CO selectivity increases.
As temperatures above 60 °C seem troublesome for many reasons, we reverted back to 60 °C and looked how other parameters could affect performance stability. As mentioned earlier, salt deposition can be a notable issue, contributing to performance degradation. While operating at higher temperatures increases the solubility of salts used for the electrolyte, this can be increased even more by switching from KHCO3 to CsHCO3, as it is three times more soluble than KHCO3.42 Thus, by using a more soluble salt in Cs, a slight backpressure of 100 mbar on the cathode, and a 10% by-weight MPIP ionomer, we were able to slow the H2 selectivity increase over time such that we were able to operate at 200 mA cm−2 for 290 hours at which point the H2 reached 45% as shown in Fig. 10. This shows the importance of small details in optimizing performance.
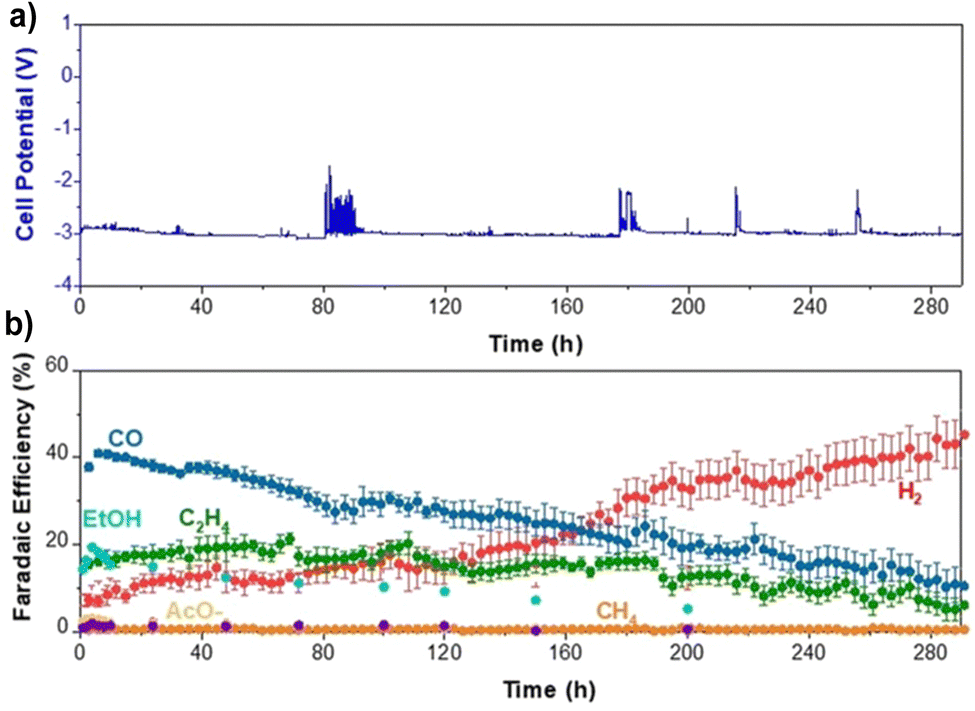 | ||
| Fig. 10 290 hour CO2 electrolysis stability test at 60 °C and 200 mA cm−2. (a) Potential profile. (b) Faradaic efficiency. Operating parameters were sputtered Cu cathode with 10% be weight MPIP ionomer, MPIP membrane, IrO2 on carbon anode and 0.1 M CsHCO3 as an electrolyte. 100 mbar back pressure on the cathode was used as well. Error bars represent the standard error of different injections and measured samples. | ||
Conclusions
We conducted a systematic study to investigate the effects of temperature on zero-gap CO2 electrolysis to understand how this parameter influences selectivity, activity, and overall performance. We found that raising the cell temperature both increased the selectivity towards CO2R over HER and concomitantly decreased the cell potentials due to enhanced kinetics. Additionally, we observed a significant shift of selectivity toward CO at temperatures above 50 °C (FE > 40%), which we associated with weakening the binding strength of intermediate CO to the Cu surface, favoring its desorption over C–C coupling reactions. Importantly, operation at elevated temperatures suppressed concomitant H2 evolution (only 15% at 300 mA cm−2 at 80 °C) by mitigating against GDE flooding at high current densities to facilitate increased CO2R durability. As a final point, we emphasize the importance of proper heating control and measurement when conducting such experiments, as differences in the heating methods might mislead the evaluation of the temperature effects during CO2E cell testing. The insights obtained in this work highlight the benefits of conducting CO2R at elevated temperatures under industrially relevant conditions. Strategies to optimize selective electrocatalysts, effective GDEs, and durable AEMs are needed to ensure that future enhancements can assist in overcoming the current limitations in the field. Such tests can only be conducted when an AEM is available that has both facile water dynamics and alkali stability at temperatures above 60 °C.Author contributions
Carlos A. Giron Rodriguez carried out most of the electrochemical measurements, conducted data analysis, and was the lead writer of the manuscript with the input of all the other co-authors. Nishithan C. Kani did long-term stability and concomitant analysis. Asger Moss built the reaction set-up (heating oven) and contributed to conceiving and designing the research. Bjørt Oladottir Joensen did measurements to determine cathode potential and wrote the corresponding part. Sahil Garg helped with data analysis and performed experiments on CO reduction at elevated temperatures. Wanyu Deng conducted the ATR-SEIRAS experiments. From the University of Surrey Terry Wilson synthesized the AEMS that John Varcoe conceived and John contributed during the revision of the manuscript. Finally, Ib Chorkendorff and Brian Seger conceived the project, oversaw its development, and helped edit the overall manuscript.Conflicts of interest
There are no conflicts to declare.Acknowledgements
This research was primarily funded by the European Union's Horizon 2020 research and innovation program under grant agreement No. 851441 (project SELECTCO2) and Villum Center for the Science of Sustainable Fuels and Chemicals (V-Sustain No. 9455) at DTU.References
- E. A. Quadrelli, G. Centi, J. L. Duplan and S. Perathoner, ChemSusChem, 2011, 4, 1194–1215 CrossRef CAS PubMed.
- P. De Luna, C. Hahn, D. Higgins, S. A. Jaffer, T. F. Jaramillo and E. H. Sargent, Science, 1979, 364, 6438 Search PubMed.
- T. Burdyny and W. A. Smith, Energy Environ. Sci., 2019, 12, 1442–1453 RSC.
- C. M. Gabardo, C. P. O'Brien, J. P. Edwards, C. McCallum, Y. Xu, C. T. Dinh, J. Li, E. H. Sargent and D. Sinton, Joule, 2019, 3, 2777–2791 CrossRef CAS.
- C. McCallum, C. M. Gabardo, C. P. O'Brien, J. P. Edwards, J. Wicks, Y. Xu, E. H. Sargent and D. Sinton, Cell Rep. Phys. Sci., 2021, 2(8), 100522 CrossRef CAS.
- R. Küngas, J. Electrochem. Soc., 2020, 167, 044508 CrossRef.
- A. Löwe, C. Rieg, T. Hierlemann, N. Salas, D. Kopljar, N. Wagner and E. Klemm, ChemElectroChem, 2019, 6, 4497–4506 CrossRef.
- H. W. Shafaque, J. K. Lee, K. Krause, C. H. Lee, K. F. Fahy, P. Shrestha, M. Balakrishnan and A. Bazylak, Energy Convers. Manage., 2021, 243(1), 114302 CrossRef CAS.
- R. E. Vos and M. T. M. Koper, ChemElectroChem, 2022, 9(13), 202200239 CrossRef.
- Y. Zong, P. Chakthranont and J. Suntivich, J. Electrochem. Energy Convers. Storage, 2020, 17(4), 041007 CrossRef.
- E. Abouzari-Lotf, M. v Jacob, H. Ghassemi, M. Zakeri, M. M. Nasef, Y. Abdolahi, A. Abbasi and A. Ahmad, Sci. Rep., 2021, 11, 3764 CrossRef CAS PubMed.
- L. C. Weng, A. T. Bell and A. Z. Weber, Energy Environ. Sci., 2019, 12, 1950–1968 RSC.
- L. C. Weng, A. T. Bell and A. Z. Weber, Energy Environ. Sci., 2020, 13, 3592–3606 RSC.
- F. Pelayo García de Arquer, C.-T. Dinh, A. Ozden, J. Wicks, C. McCallum, A. R. Kirmani, D.-H. Nam, C. Gabardo, A. Seifitokaldani, X. Wang, Y. C. Li, F. Li, J. Edwards, L. J. Richter, S. J. Thorpe, D. Sinton and E. H. Sargent, Science, 2020, 367(6478), 661–666 CrossRef PubMed.
- B. Endrdi, E. Kecsenovity, A. Samu, T. Halmágyi, S. Rojas-Carbonell, L. Wang, Y. Yan and C. Janáky, Energy Environ. Sci., 2020, 13, 4098–4105 RSC.
- L. C. Weng, A. T. Bell and A. Z. Weber, Energy Environ. Sci., 2020, 13, 3592–3606 RSC.
- Y. K. Kikuchi, A. Murata and S. Suzuki, Chem. Lett., 1986, 897–898 Search PubMed.
- S. T. Ahn, I. Abu-Baker and G. T. R. Palmore, Catal. Today, 2017, 288, 24–29 CrossRef CAS.
- R. E. E. Vos, K. E. Kolmeijer, T. S. Jacobs, W. van der Stam, B. M. Weckhuysen and M. T. M. Koper, ACS Catal., 2023, 13(12), 8080–8091 CrossRef CAS PubMed.
- E. Jeng and F. Jiao, React. Chem. Eng., 2020, 5, 1768–1775 RSC.
- E. J. Dufek, T. E. Lister and M. E. McIlwain, J. Appl. Electrochem., 2011, 41, 623–631 CrossRef CAS.
- C. A. Giron Rodriguez, B. Ó. Joensen, A. B. Moss, G. O. Larrazábal, D. K. Whelligan, B. Seger, J. R. Varcoe and T. R. Willson, ACS Sustainable Chem. Eng., 2023, 11(4), 1508–1517 CrossRef CAS PubMed.
- S. Nitopi, E. Bertheussen, S. B. Scott, X. Liu, A. K. Engstfeld, S. Horch, B. Seger, I. E. L. Stephens, K. Chan, C. Hahn, J. K. Nørskov, T. F. Jaramillo and I. Chorkendorff, Chem. Rev., 2019, 119, 7610–7672 CrossRef CAS PubMed.
- C. M. Gunathunge, J. Li, X. Li, J. J. Hong and M. M. Waegele, ACS Catal., 2020, 10, 6908–6923 CrossRef CAS.
- D. P. Woodruff, B. E. Hayden, K. Prince and A. M. Bradshaw, Surf. Sci., 1982, 123(2–3), 397–412 CrossRef CAS.
- C. M. Gunathunge, J. Li, X. Li and M. M. Waegele, ACS Catal., 2020, 10, 11700–11711 CrossRef CAS.
- J. C. Douglin, R. K. Singh, S. Haj-Bsoul, S. Li, J. Biemolt, N. Yan, J. R. Varcoe, G. Rothenberg and D. R. Dekel, Chem. Eng. J. Adv., 2021, 8(15), 100153 CrossRef CAS.
- C.-W. Yi and J. Szanyi, Surf. Sci., 2015, 641, 154–158 CrossRef CAS.
- K. U. Hansen, L. H. Cherniack and F. Jiao, ACS Energy Lett., 2022, 7, 4504–4511 CrossRef CAS.
- W. Deng, P. Zhang, B. Seger and J. Gong, Nat. Commun., 2022, 13, 803 CrossRef CAS PubMed.
- B. Sahin, J. J. Leung, E. Magori, S. Laumen, A. Tawil, E. Simon and O. Hinrichsen, Energy Technol., 2022, 10(12), 2200972 CrossRef CAS.
- B. Tabah, I. N. Pulidindi, V. R. Chitturi, L. M. R. Arava and A. Gedanken, ChemSusChem, 2015, 8, 3497–3503 CrossRef CAS PubMed.
- R. K. Miao, Y. Xu, A. Ozden, A. Robb, C. P. O'Brien, C. M. Gabardo, G. Lee, J. P. Edwards, J. E. Huang, M. Fan, X. Wang, S. Liu, Y. Yan, E. H. Sargent and D. Sinton, Joule, 2021, 5, 2742–2753 CrossRef CAS.
- Q. Xu, S. Garg, A. B. Moss, M. Mirolo, I. Chorkendorff, J. Drnec and B. Seger, Nat. Catal., 2023, 6, 1042–1051 CrossRef CAS.
- M. Ma, S. Kim, I. Chorkendorff and B. Seger, Chem. Sci., 2020, 11, 8854–8861 RSC.
- M. Ma, Z. Zheng, W. Yan, C. Hu and B. Seger, ACS Energy Lett., 2022, 7, 2595–2601 CrossRef CAS.
- A. Rahbari, R. Hartkamp, O. A. Moultos, A. Bos, L. J. P. van den Broeke, M. Ramdin, D. Dubbeldam, A. V. Lyulin and T. J. H. Vlugt, J. Phys. Chem. C, 2022, 126, 8121–8133 CrossRef CAS PubMed.
- R. C. Sellin, K. Mozet, A. Ménage, J. Dillet, S. Didierjean and G. Maranzana, Int. J. Hydrogen Energy, 2019, 44, 24905–24912 CrossRef CAS.
- L. Ge, H. Rabiee, M. Li, S. Subramanian, Y. Zheng, J. H. Lee, T. Burdyny and H. Wang, Chem, 2022, 8, 663–692 CAS.
- D. G. Wheeler, B. A. W. Mowbray, A. Reyes, F. Habibzadeh, J. He and C. P. Berlinguette, Energy Environ. Sci., 2020, 13, 5126–5134 RSC.
- A. B. Moss, S. Garg, M. Mirolo, C. A. Giron Rodriguez, R. Ilvonen, I. Chorkendorff, J. Drnec and B. Seger, Joule, 2023, 7, 350–365 CrossRef CAS.
- S. Garg, Q. Xu, A. B. Moss, M. Mirolo, W. Deng, I. Chorkendorff, J. Drnec and B. J. Seger, Energy Environ. Sci., 2023, 16, 1631–1643 RSC.
- S. Garg, C. A. Giron Rodriguez, T. E. Rufford, J. R. Varcoe and B. Seger, Energy Environ. Sci., 2023, 15, 4440–4469 RSC.
- A. M. I. Noor Azam, T. Ragunathan, N. N. Zulkefli, M. S. Masdar, E. H. Majlan, R. Mohamad Yunus, N. S. Shamsul, T. Husaini and S. N. A. Shaffee, Polymers, 2023, 15(5), 1301 CrossRef CAS PubMed.
- M. Sassenburg, M. Kelly, S. Subramanian, W. A. Smith and T. Burdyny, ACS Energy Lett., 2022, 321–331 Search PubMed.
- M. Moradzaman, C. S. Martínez and G. Mul, Sustainable Energy Fuels, 2020, 4, 5195–5202 RSC; D. R. Lide, CRC Handbook of Chemistry and Physics, 84th edn, 2004, pp. 6–13 Search PubMed.
- M. E. Leonard, L. E. Clarke, A. Forner-Cuenca, S. M. Brown and F. R. Brushett, ChemSusChem, 2020, 13, 400–411 CrossRef CAS PubMed.
- M. Li, M. N. Idros, Y. Wu, T. Burdyny, S. Garg, X. S. Zhao, G. Wang and T. E. Rufford, J. Mater. Chem. A Mater., 2021, 9, 19369–19409 RSC.
- D. Corral, J. T. Feaster, S. Sobhani, J. R. Deotte, D. U. Lee, A. A. Wong, J. Hamilton, V. A. Beck, A. Sarkar, C. Hahn, T. F. Jaramillo, S. E. Baker and E. B. Duoss, Energy Environ. Sci., 2021, 14, 3064–3074 RSC.
- S. D. Sajjad, Y. Gao, Z. Liu, H. Yang and R. Masel, ECS Trans., 2017, 77, 1653–1656 CrossRef CAS.
Footnote |
| † Electronic supplementary information (ESI) available. See DOI: https://doi.org/10.1039/d3ey00224a |
| This journal is © The Royal Society of Chemistry 2024 |