Efficient degradation of tetracycline via peroxymonosulfate activation by phosphorus-doped biochar loaded with cobalt nanoparticles†
Yunpeng
Wang
a,
Ting
Jiao
a,
Peng
Zhang
a,
Wanyi
Hou
a,
Zhongping
Li
 *ab,
Chuan
Dong
 ab,
Wanying
Zhang
c and
Lei
Zhang
d
aInstitute of Environmental Science, School of Environmental and Resources Sciences, Shanxi University, 030006, China. E-mail: zl104@sxu.edu.cn
bShanxi Laboratory for Yellow River, Taiyuan 030006, China
cSchool of chemistry and materials science, Shanxi Normal University, Taiyuan 030031, China
dDepartment of Biology, Xinzhou Normal University, Xinzhou 034000, China
First published on 24th May 2024
Abstract
The accumulation of tetracycline hydrochloride (TCH) threatens human health because of its potential biological toxicity. Carbon -based materials with easy isolation and excellent performance that can activate peroxymonosulfate (PMS) to generate reactive oxygen species for TCH degradation are essential, but the development of such materials remains a significant challenge. In this study, based on the idea of treating waste, tricobalt tetraoxide loaded P-doped biochar (Co NP-PBC) was synthesised to activate PMS for the degradation of TCH. Possible degradation pathways and intermediate products of TCH were identified using High performance liquid chromatography tandem mass spectrometry (HPLC-MS) detection and density functional theory analysis. Toxicity analysis software was used to predict the toxicity of the intermediate products. Compared to catalysts loaded with Fe and Mn and other Co-based catalysts, Co NP-PBC exhibited an optimal performance (with a kinetic constant of 0.157 min−1 for TCH degradation), and over 99.0% of TCH can be degraded within 20 min. This mechanism demonstrates that the non-free radical oxidation of 1O2 plays a major role in the degradation of TCH. This study provides insights into the purification of wastewater using BC-based catalysts.
Introduction
Tetracycline hydrochloride (TCH), a broad-spectrum antibiotic, is widely used in clinical treatment1,2 and animal husbandry.3 However, the long-term use of TCH considerably endangers the aquatic environment and human health. The accumulation of TCH and its derivatives (mostly in medical wastewater, industrial sewage, and biological tissues) causes severe problems, such as ecological toxicity and potential carcinogenicity.4,5 Unfortunately, the biodegradation of TCH is extremely difficult. Therefore, several effective technologies including adsorption,6 biodegradation,7 photocatalytic oxidation8 and many others9 have been developed. The use of advanced oxidation processes (AOPs) is considered a remarkable strategy for effectively removing TCH, and the active oxygen intermediates produced by activating peroxides in these processes enhance the oxidation abilities.10 In particular, peroxymonosulfate (PMS)-based AOPs have attracted increasing attention. Compared to the hydroxyl radical (˙OH) that dominates the Fenton reaction, the sulfate radical (SO4˙−) has a higher redox potential, longer survival time, and wider pH range applicable for organic degradations.4,11 Moreover, the stability of PMS and its mineralisation ability are more efficient than those of H2O2 in the Fenton reaction. Moreover, according to previous reports, antibiotics are degraded not only by free radicals such as SO4˙− and ˙OH generated by PMS activation but also by concomitant degradation processes by non-radical pathways, including electron transfer and 1O2 generation. 1O2 is much more resistant to interference compared to SO4˙− and ˙OH; moreover, it has a longer lifetime and is more resistant to interference.12Commonly used methods for activating PMS include thermal activation, ultraviolet radiation activation, alkali activation, and transition metal activation.13 Among them, methods involving light, heat, and alkali are expensive and have a low activation performance; therefore, they are not widely used. According to previous reports, Co has a high redox potential, which facilitates PMS activation. Its variable valence facilitates PMS activation to produce free radicals.14 However, PMS activation with Co doping alone may lead to problems such as difficulties in catalyst recovery. To solve this problem, many carbon materials are used as substrates to load metals, which helps improve material stability.8,15,16 In recent years, various carbon materials such as carbon nanotubes,12 graphene,17 graphite-phase carbon nitride18 and metal organic framework (MOFs)19–22 have been widely used for PMS activation and the efficient catalytic degradation of new pollutants. Hua23et al. successfully prepared N-doped porous carbon-coated Co nanoparticles by pyrolytic imidazolium molecular sieve framework (Co-ZIF-8(CZ)) @ anionic polyacrylamide (APAM) network composites (Co-ZIF-8@APAM (CZA)), and the prepared nanomaterials showed excellent results and stability in the activation of PMS for the degradation of tetracycline hydrochloride. However, the expensive raw materials and complex preparation processes required limit their large-scale application.
Biomass carbon (BC) is a material preferred by researchers owing to its low cost, rich reserves, large specific surface area, and diverse surface functional groups.24 Biochar is widely used to remediate harmful pollutants in soils, sediments, and wastewater. Owing to the natural microstructure of biomass, the derived carbon has multiple structures.25 The high specific surface area of BC and the exposed active sites facilitate the activation and degradation of PMS. Moreover, introducing heteroatom doping on the surface of BC materials can significantly change the structure of the interaction between these materials and persulfate/tetracycline, forming Lewis acid sites on the BC surface.26,27 The exposed active sites of the catalyst, adsorption states of tetracycline on the catalyst, and charge transfer rate between the catalyst and tetracycline are decisive factors that affect the selectivity and kinetics of the catalytic reaction. Therefore, a strategy involving the construction of catalytically active materials with excellent performance, improvement of the catalytic degradation efficiency of antibiotics, and modification of biomass can be effective.28 However, the mechanism of PMS activation by modified BC to produce 1O2 remains unclear, and the activation of PMS by Co NP-PBC in combination with modified biomass carbon has not yet been reported.
In this study, P-doped biochar (PBC) loaded with Co NP was successfully prepared by modifying biochar from sunflower seed husk, followed by loading the Co NP onto the surface of the biochar using chemical reduction methods. The objectives of this study were as follows: (1) to evaluate the degradation performance of Co NP-PBC through degradation experiments; (2) investigate the effects of different parameters and conditions (catalyst dosage, PMS dosage, temperature, pH, and coexisting substances) on the degradation of TCH in the Co NP-PBC /PMS system; (3) identify active oxygen species in the system through quenching experiments and electron paramagnetic resonance (EPR) spectroscopy and deduce their production and action mechanisms; (4) predict the easily reactive sites and bond strengths of TCH through the condensed Fukui function and Laplace bond order and analyse the intermediate products of TCH degradation and their production paths through HPLC-MS. A toxicity analysis software was used to analyse the toxicity of the intermediate products.
Experimental
Materials and reagents
The used reagents and materials are listed in detail in the ESI (Text S1†).Preparation of BC
The dried melon seed shells were calcined in an Ar atmosphere at 500 °C for 2 h. The calcined shells were ground, cleaned with secondary water, and dried. The dried residue was collected as BC.Preparation of PBC
First, equal amounts of phosphoric acid and biomass were mixed and then stirred and dried in an oven at 105 °C. This mixture was calcined in an Ar atmosphere at 500 °C for 2 h. After grinding and cleaning the mixture with secondary water, PBC was collected for standby after drying.Preparation of Co NP-PBC
PBC and Co(NO3)2·6H2O were mixed in a 1![[thin space (1/6-em)]](https://www.rsc.org/images/entities/char_2009.gif) :
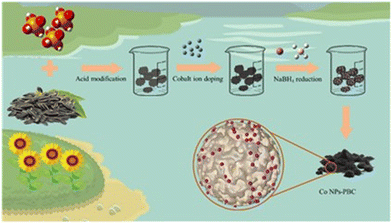
:![[thin space (1/6-em)]](https://www.rsc.org/images/entities/char_2009.gif) 1 ratio (wt%), and the mixture was sonicated in 30 mL of secondary water for 2 h. Within half an hour, 10 mL of 0.1 M NaBH4 solution was added. This solution was rinsed and precipitated many times until the pH was neutral; subsequently, it was dried in an oven at 60 °C. Finally, the materials were collected for standby after drying (Scheme 1).
1 ratio (wt%), and the mixture was sonicated in 30 mL of secondary water for 2 h. Within half an hour, 10 mL of 0.1 M NaBH4 solution was added. This solution was rinsed and precipitated many times until the pH was neutral; subsequently, it was dried in an oven at 60 °C. Finally, the materials were collected for standby after drying (Scheme 1).
Degradation experiment
Dark conditions were used for the TCH degradation experiments. Co NP-PBC was added to 50 mL of a 50 mg L−1 TCH solution and mechanically stirred for 60 min. The oxidation reaction was initiated by adding 2 mM PMS as the starting material and was mechanically stirred. For the UV-Vis analysis, a 2 mL sample was collected from the reaction with a syringe and filtered immediately with a microporous filter (0.22 μm). NaOH or H2SO4 was used to adjust the pH of the initial solution. The degradation efficiency (DE) and adsorption efficiency of TCH were calculated using eqn (1).| DE = (1 − c/c0) × 100% | (1) |
DFT calculation
DFT calculations were performed through Gaussian16 W using the B3LYP (D3)/6-31G* dispersion correction for structural optimisation. Fukui functions were calculated through Multiwfn, and the visualised Fukui functions were plotted using Visual Molecular Dynamics (VMD).Structure and toxicity of intermediate products
Toxicity of the intermediate products was analysed using Toxicity Estimation Software Tool (TEST) based on quantitative structure–activity relationships, which is used for toxicity prediction.Results and discussion
Characterisation
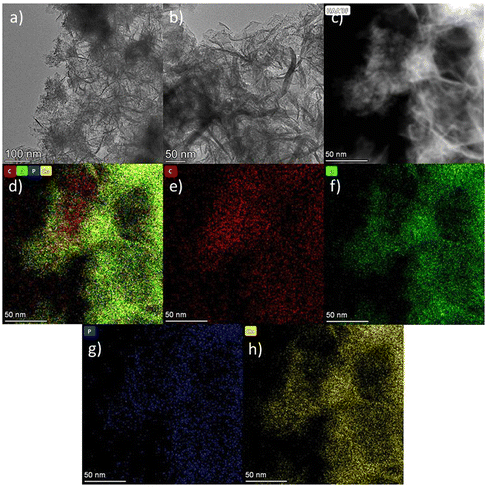
The TEM images of Co NP-PBC are shown in Fig. 1. Fig. 1 shows the TEM images of Co NPs-PBC at different magnifications. As shown in Fig. 1a Co NPs-PBC catalysts exhibit a typical two-dimensional lamellar structure, which is more wrinkled at the edges compared to BC and PBC (Fig. S1†) and is loaded with cobalt nanoparticles on its surface. The presence of C, O, P, and Co was also found in the mapping maps (Fig. 1e–h) and EDX (Fig. S1c†) of this region, indicating the successful preparation of the composite. As can be seen from Fig. S2a,† both BC and PBC are amorphous, with two large packet peaks at 26° and 44°, respectively. The X-ray diffraction (XRD) spectrum of the Co NP-PBC catalyst showed a wide peak at 2a = 23°, which was attributed to the (002) surface of amorphous carbon.29,30The structures of BC, PBC and Co NP-PBC were analysed using Raman spectroscopy. As shown in Fig. S2b,† only the characteristic peaks centred around 1350 cm−1 and 1580 cm−1 were observed, and the D band at 1350 cm−1 corresponded to disordered carbon and graphite structural defects in the material. The G band at 1580 cm−1 corresponded to the E2 g mode vibration of sp2 hybrid carbon. ID/IG is an important parameter that characterises the degree of material defects.31,32 As shown in Fig. S2b,† the ID/IG value of BC was 3.56, whereas after P modification and Co doping, the ID/IG value of Co NP-PBC decreased to 3.26. This is because P modification increases the pore size of the material without changing its degree of defects; conversely, the added Co occupies some of the defects in the material, resulting in a decrease in ID/IG. However, Co NP-PBC still has many defects, which can provide a large number of active sites for adsorption and degradation.
The elemental compositions and chemical states of the catalysts were analysed using XPS. As shown in Fig. S3a,† the full spectrum of the Co NP-PBC catalyst confirms the presence of Co, C, O, and P, which is consistent with the TEM results. With the modification of BC and the loading of Co, P and Co peaks begin to appear. In addition, peaks of Na (1073 eV) and Cl (200 eV) appear in the total spectrum of BC owing to the presence of impurities in the biomass without the salts. Fig. S3b† show the XPS spectra of Co, which can be deconvoluted into three forms of Co, namely Co2p 1/2 (798.3 eV, 802.2 eV), Co2p 3/2 (782.6 eV, 786.6 eV), and satellite peaks (789.9 eV, 805.8 eV). Fig. S3c, e and g† show the C1s spectra of Co NP-PBC, PBC, and BC. The figure indicates that part of the P enters the carbon skeleton to form C–P bonds during the modification process, which proves the success of the material modification. In Fig. S3d and h,† it can be seen that after the P modification, the C![[double bond, length as m-dash]](https://www.rsc.org/images/entities/char_e001.gif) O bond on the surface of the material was oxidised to O–C
O bond on the surface of the material was oxidised to O–C![[double bond, length as m-dash]](https://www.rsc.org/images/entities/char_e001.gif) O, and P–O/P
O, and P–O/P![[double bond, length as m-dash]](https://www.rsc.org/images/entities/char_e001.gif) O was formed. In the process of reducing Co2+ with NaBH4, part of the O–C
O was formed. In the process of reducing Co2+ with NaBH4, part of the O–C![[double bond, length as m-dash]](https://www.rsc.org/images/entities/char_e001.gif) O was reduced to C–O. This result also indicates the successful preparation of the material.
O was reduced to C–O. This result also indicates the successful preparation of the material.
Fig. S4a and c† show the adsorption–desorption curves of PBC and Co NP-PBC, respectively. It is observed that the adsorption amounts of PBC and Co NP-PBC rise rapidly at lower relative pressures, reflecting the characteristics of type-I isothermal microporous adsorption. When the relative pressure increases, the adsorption does not show adsorption saturation; rather, a mesoporous hysteresis loop appears along with desorption. The mesopore hysteresis loops of both conformed to the H4-type hysteresis loop adsorption isotherm, indicating that their pore structures were very irregular. Judging from the pore structure, both PBC and Co NP-PBC have containing both microporous and mesoporous structures with slit pores. According to Fig. S4b and d,† the average pore size of PBC is 4.12 nm, whereas that of Co NP-PBC is 4.41 nm. This indicates that the loading of Co NPs does not change the pore size of Co NP-PBC, which is consistent with Raman results. In order to determine the amount of cobalt in the catalyst, we analysed the weight loss of the catalyst in air before and after cobalt doping by thermogravimetric analysis. As shown in Fig. S13,† After calcination at 800 °C, the weight loss of Co NP-PBC was at 76.54%, while that of PBC was at 97.97%, and the cobalt nanoparticles were oxidised to Co3O4 when calcined in air, so the content of cobalt in Co NP-PBC was 15.8%.
Catalytic performances of Co NP-PBC
Fig. S5a† shows the effect of catalysts loaded with different metals on the degradation efficiency of TCH. Within 20 min of adding PMS, the degradation efficiencies of Fe NP-PBC and Cu NP-PBC on TCH were only 69.45% and 77.12%, which are less than 99.31% that was obtained from Co NP-PBC. From Fig. S5b,† the reaction kinetics coefficient of the Co-loaded catalyst is observed to be 0.167 min−1, which is higher than 0.030 min−1 and 0.052 min−1 for the Fe- and Cu-loaded catalysts, respectively. Evidently, the Co-loaded catalyst can better activate PMS to produce free radicals and thus degrade pollutants. As observed from Fig. S6a,† Co NP-PBC /PMS is efficient at degrading TCH with different amounts of Co doping, even for varying amounts of Co NP-PBC /PMS. The figure illustrates that the degradation rate of TCH increases from 89.60% to 99.09% when the Co content (Co![[thin space (1/6-em)]](https://www.rsc.org/images/entities/char_2009.gif) :
:![[thin space (1/6-em)]](https://www.rsc.org/images/entities/char_2009.gif) BC) increases from 1
BC) increases from 1![[thin space (1/6-em)]](https://www.rsc.org/images/entities/char_2009.gif) :
:![[thin space (1/6-em)]](https://www.rsc.org/images/entities/char_2009.gif) 25 to 5
25 to 5![[thin space (1/6-em)]](https://www.rsc.org/images/entities/char_2009.gif) :
:![[thin space (1/6-em)]](https://www.rsc.org/images/entities/char_2009.gif) 25, and the kinetic parameter Ks increases from 0.0703 min−1 to 0.1568 min−1. According to our study, the TCH degradation efficiency increases when the Co content increases within a specific range. The kinetic parameter Ks increases linearly with increasing Co content (Fig. S6b†). When the Co content increases to 7
25, and the kinetic parameter Ks increases from 0.0703 min−1 to 0.1568 min−1. According to our study, the TCH degradation efficiency increases when the Co content increases within a specific range. The kinetic parameter Ks increases linearly with increasing Co content (Fig. S6b†). When the Co content increases to 7![[thin space (1/6-em)]](https://www.rsc.org/images/entities/char_2009.gif) :
:![[thin space (1/6-em)]](https://www.rsc.org/images/entities/char_2009.gif) 25, Ks continues to increase; however, because of the concentration of TCH, the degradation efficiency cannot be further improved. Owing to the influence of the TCH concentration and the leaching of Co ions in the experiment, a catalyst with a Co
25, Ks continues to increase; however, because of the concentration of TCH, the degradation efficiency cannot be further improved. Owing to the influence of the TCH concentration and the leaching of Co ions in the experiment, a catalyst with a Co![[thin space (1/6-em)]](https://www.rsc.org/images/entities/char_2009.gif) :
:![[thin space (1/6-em)]](https://www.rsc.org/images/entities/char_2009.gif) BC content of 5
BC content of 5![[thin space (1/6-em)]](https://www.rsc.org/images/entities/char_2009.gif) :
:![[thin space (1/6-em)]](https://www.rsc.org/images/entities/char_2009.gif) 25 was chosen for subsequent experiments.
25 was chosen for subsequent experiments.
Influence of key experimental factors on the degradation of TCH by Co NP-PBC/PMS
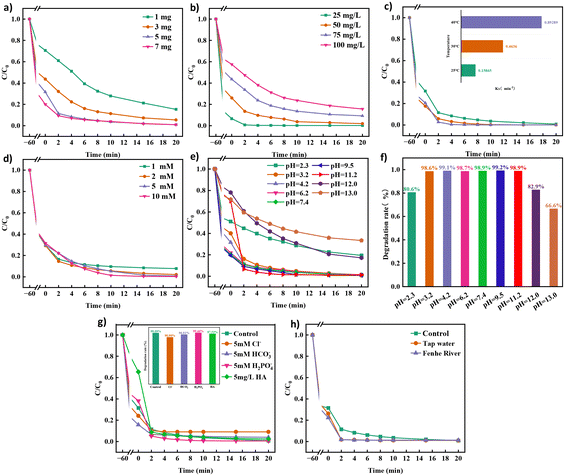
As illustrated in Fig. 2a, the degradation efficiency of TCH increases from 84.7% to 99.08% as the catalyst dosage increases from 1 mg to 7 mg. Hence, more catalysts provide more PMS activation sites, which accelerate the degradation efficiency of TCH. When the concentration of PMS and the amount of catalyst remain the same (Fig. 2b), the degradation efficiency decreases from 99.88% to 84.39% as the concentration of TCH increases from 25 mg L−1 to 100 mg L−1. As shown in Fig. 2c, as the reaction temperature increases from 25 °C to 40 °C, the degradation efficiency of TCH gradually increases, and its corresponding reaction rate constant increases from 0.15865 min−1 to 0.89289 min−1. When the temperature reaches 40 °C, the degradation efficiency of TCH in the system reaches the maximum value, which is attributed to the fact that PMS is more easily activated at high temperatures. However, 40 °C is the highest temperature that can be reached in general sewage treatment, so no in-depth research has been conducted on the impact of temperatures exceeding 40 °C. As shown in Fig. 2d, the PMS dosage significantly affects the degradation efficiency of TCH. As PMS dosage is increased, the degradation efficiency of TCH improves from 92.27% at 1 mM to 99.75% at 10 mM. This indicates that PMS produces more reactive oxygen species (ROS), which increase the degradation efficiency of TCH. Although the degradation efficiency of PMS at 5 mM and 10 mM was lower than the degradation efficiency of PMS at 2 mM until 2 min, the excess PMS quenched the sulfate and hydroxyl radicals generated by the catalyst, which can be attributed to the saturated reaction sites on the catalyst.Fig. 2e and f present the degradation curves of TCH at different pH values and the removal rate of TCH within 20 min. The Co NP-PBC/PMS system degraded 80.6%, 82.9%, and 66.6% of TCH in 20 min at pH 2.3, 12.0, and 13.0, respectively, compared to the 98% degradation efficiency achieved under other non-extreme pH conditions. PMS is soluble in water, and its aqueous solution is acidic; it is stable when the solution pH is less than 3 or more than 12.33,34 During our experiments, we found that when the pH was <11, the solution pH decreased sharply to approximately 3 after the addition of PMS. When the pH was >12, the addition of PMS did not cause a drastic change in the solution pH but caused only a slight decrease. At pH 3–11, PMS exists mainly in the form of HSO5−, which constantly generates sulfate and hydroxyl radicals, accelerating the degradation of TCH. At pH 2.3, PMS was stable in solution and could not be easily activated. Moreover, the Co NPs loaded onto the modified biocarbon dissolved into Co ions, leading to a decrease in the number of activation sites for PMS and a decrease in the TCH degradation rate. When the solution pH >12, because PMS mainly exists in the form of SO5−, the catalytic activity of SO5− is lower than that of HSO5−, and the catalytically generated SO4− reacts with H2O/OH− in the solution35 (eqn (2) and (3)) to generate ˙OH, but the oxidising ability of ˙OH is weaker than that of SO4−, resulting in poorer TCH degradation.36
| SO4˙− + H2O → SO42− + H+ + ˙OH | (2) |
| SO4˙− + OH− → SO42− + ˙OH | (3) |
The presence of a large number of anions (HCO3−, Cl−, H2PO4−, etc.) and natural organic matter (NOM) in natural waters has a great influence on the advanced oxidation process. Therefore, it is necessary to investigate the effects of these anions and NOM on the Co NP-PBC/PMS systems.
Fig. 2g shows the effects of these anions and NOM on the TCH degradation efficiency. The TCH degradation efficiency increased from 99.09% to 99.46% when the concentration of H2PO4− in the solution reached 5 mM, and the initial pH of the solution did not produce a great change when 5 mM H2PO4− was added. The pH decreased to 3.1 after the addition of PMS. However, the degradation of TCH was not affected at this pH, so this change was caused by H2PO4−. The formation of hydrogen bonds between PMS and phosphate renders the system more inclined to generate reactive phosphate species.37 H2PO4− dissociates into HPO42− and PO43−, which can effectively break the O–O bonds of PMS. This accelerates the generation of SO4−, which degrades the pollutants.38,39
The initial pH of the solution increased from 4.2 to 7.8 when 5 mM of HCO3− was added to the TCH solution, and it decreased to 6.8 after the addition of HCO3−. In this environment, PMS is still in the form of HSO5−, therefore, the pH does not affect the degradation of TCH. HCO3− and CO32− react with SO4˙− to form some reactive substances with lower oxidising capacity, such as CO32− and HCO3−, which reduce the degradation rate of TCH.40
When the concentrations of Cl− and humic acid reached 5 mM and 5 mg L−1, respectively, the degradation efficiency of TCH decreased to 90.9% and 97.53%, respectively. When Cl− and SO4˙− coexisted in solution, they reacted to form Cl− and SO42−. However, the degradation efficiency of TCH was reduced because the redox potential of Cl− (2.5 eV) was slightly lower than that of sulfate radicals (2.5–3.1 eV).41,42 In the adsorption stage, humic acid competed with TCH for the active sites on the surface of Co NP-PBC, which reduced the adsorption of TCH but did not have a significant effect on TCH degradation efficiency.43
Fig. 2h shows that the degradation efficiency of TCH differs for different water quality environments. The degradation efficiency of Co NP-PBS/PMS in tap water and Fenhe water (containing heavy metal ions) was slightly better than that in secondary water because Ca2+ and Mg2+ in tap water and As, Mn, and Ni in Fenhe water accelerated the activation of PMS, which improved the degradation efficiency of TCH.
Mechanism of TCH catalytic degradation by Co NP-PBC/PMS
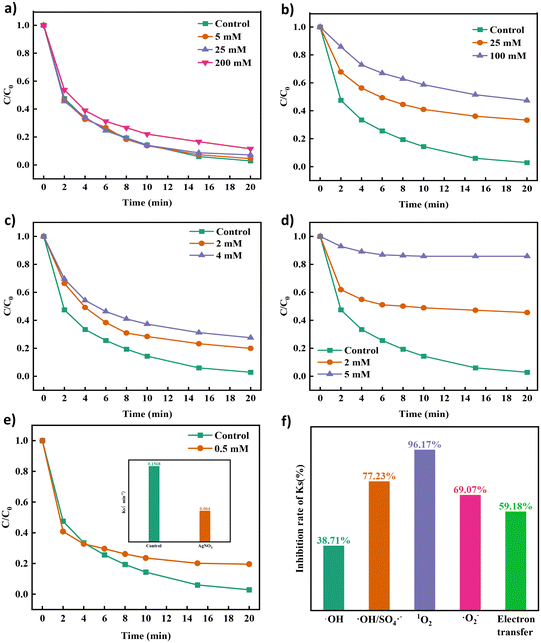
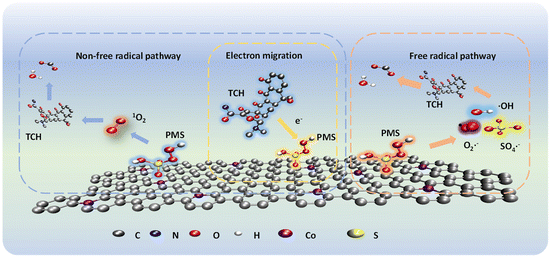
Analysis of active species. Methanol, tertbutanol, p-benzoquinone, L-histidine44 and silver nitrate14 were used as quenching agents to determine the role of ROS in the degradation process of TCH in the Co NP-PBC/PMS system. As shown in Fig. 3a–e, different quenching agents had a profound effect on the TCH removal efficiency. The corresponding kinetic parameters are displayed in Fig. S7a–d.† In addition, when the concentration of TBA in the solution increased from 5 mM to 200 mM, the kinetic parameters of the solution decreased from 0.1568 min−1 to 0.0961 min−1, which indicated that hydroxyl radicals quenched by TBA were involved in the degradation process. The hydroxyl radicals did not play a leading role in the degradation. Increasing the methanol concentration from 0 mM to 100 mM significantly lowered the degradation efficiency of TCH from 97.13% to 52.72%; consequently, the kinetic parameter Ks decreased from 0.1568 min−1 to 0.006 min−1. Certainly, ˙OH and SO4˙− coexist in the system, and SO4˙− play an integral role in the entire degradation process. Fig. 3c shows that p-BQ inhibited the degradation of TCH. The inhibitory effect became more apparent when the concentration of p-BQ was increased, indicating that the superoxide anion played a significant role in degrading the substance. However, when the concentration of L-histidine in the solution increased from 0 to 5 mM, the degradation efficiency of TCH decreased from 97.13% to 14.21%, and Ks decreased from 0.1568 min−1 to 0.006 min−1 (Fig. 3d and Fig. S7d†). L-Histidine has been proven to play a major role in the degradation of TCH by quenching the singlet oxygen, which in turn plays a crucial role in the degradation of TCH.As mentioned in previous reports on PMS oxidation, the process of non-free radical oxidation via electron transfer can also be considered a degradation process for TCH. In the presence of silver nitrate in the system solution, the degradation efficiency of TCH was inhibited by 80.46%. The kinetic parameter Ks decreased from 0.1568 min−1 to 0.064 min−1, indicating that it played an important role in electron transfer in the degradation process. In addition, the electron transfer path coexisted with free radicals during the degradation process.
To further verify the presence of ROS, DMPO and 2,2,6,6-tetramethyl-4-piperidone hydrochloride (TEMP) were used to capture the ROS during degradation. EPR was used to analyse the ROS intensity at each step in the degradation process for verification.45 As shown in Fig. 4a, the EPR spectrum of the Co NP-PBC/PMS/TCH system showed signal intensity changes for hydroxyl and sulfate radicals within 1–5 min. With time, the signal strength of both radicals increased. However, based on the experimental results, hydroxyl radicals had little effect in the quenching experiment. Hence, the strength of ˙OH continued to decrease in the subsequent reaction. The generation of ˙OH and SO4˙− is mainly due to the electron transfer resulting from the oxidation–reduction reaction between ![[triple bond, length as m-dash]](https://www.rsc.org/images/entities/char_e002.gif) Co(II) and
Co(II) and ![[triple bond, length as m-dash]](https://www.rsc.org/images/entities/char_e002.gif) Co(III), which activates PMS and generates ˙OH and SO4˙− (eqn (4)–(7)).14 Signals of O2˙− and 1O2 were detected at the same sampling time, as shown in Fig. 4b and c. From Fig. S14,† it can be found that the degradation of TCH under the condition of nitrogen gas introduction led to a decrease in the degradation rate of TCH from 99.31% to 98.82%. Moreover, its reaction rate constant Ks also decreased from 0.167 min−1 to 0.161 min−1, indicating that oxygen was involved in the degradation of TCH. Oxygen may be involved in the degradation of TCH by generating O2˙− as shown in eqn (8).46 The production of 1O2 can be attributed to the direct decomposition of PMS or the conversion of free radicals such as O2˙− (eqn (9)–(11)).47,48
Co(III), which activates PMS and generates ˙OH and SO4˙− (eqn (4)–(7)).14 Signals of O2˙− and 1O2 were detected at the same sampling time, as shown in Fig. 4b and c. From Fig. S14,† it can be found that the degradation of TCH under the condition of nitrogen gas introduction led to a decrease in the degradation rate of TCH from 99.31% to 98.82%. Moreover, its reaction rate constant Ks also decreased from 0.167 min−1 to 0.161 min−1, indicating that oxygen was involved in the degradation of TCH. Oxygen may be involved in the degradation of TCH by generating O2˙− as shown in eqn (8).46 The production of 1O2 can be attributed to the direct decomposition of PMS or the conversion of free radicals such as O2˙− (eqn (9)–(11)).47,48
![[triple bond, length as m-dash]](https://www.rsc.org/images/entities/char_e002.gif) Co(II) + HSO5− → Co(II) + HSO5− → ![[triple bond, length as m-dash]](https://www.rsc.org/images/entities/char_e002.gif) Co(III) + SO4˙− + OH− Co(III) + SO4˙− + OH− | (4) |
![[triple bond, length as m-dash]](https://www.rsc.org/images/entities/char_e002.gif) Co(II) + HSO5− → SO42− + Co(II) + HSO5− → SO42− + ![[triple bond, length as m-dash]](https://www.rsc.org/images/entities/char_e002.gif) Co(III) + ˙OH Co(III) + ˙OH | (5) |
![[triple bond, length as m-dash]](https://www.rsc.org/images/entities/char_e002.gif) Co(III) + HSO5− → SO5˙− + Co(III) + HSO5− → SO5˙− + ![[triple bond, length as m-dash]](https://www.rsc.org/images/entities/char_e002.gif) Co(II) + H+ Co(II) + H+ | (6) |
| SO4˙− + H2O → SO42− + H+ + ˙OH | (7) |
![[triple bond, length as m-dash]](https://www.rsc.org/images/entities/char_e002.gif) Co(II) + O2 → Co(II) + O2 → ![[triple bond, length as m-dash]](https://www.rsc.org/images/entities/char_e002.gif) Co(III) + O2˙− Co(III) + O2˙− | (8) |
| HSO5− + SO52− → SO42− + HSO4− + 1O2 | (9) |
| 2 O2˙− + 2H2O → 1O2+ H2O2 + 2OH− | (10) |
| 2 SO5˙− + H2O → 2HSO4− + 1.5 1O2 | (11) |
 | ||
| Fig. 4 EPR spectra of (a) DMPO-˙OH and DMPO-SO4˙−, (b) DMPO-O2˙− and (c) TEMP-1O2 at different reaction times in the Co NP-PBC/PMS/TCH system. | ||
Proposed degradation pathway of TCH by the Co NP-PBC/PMS system
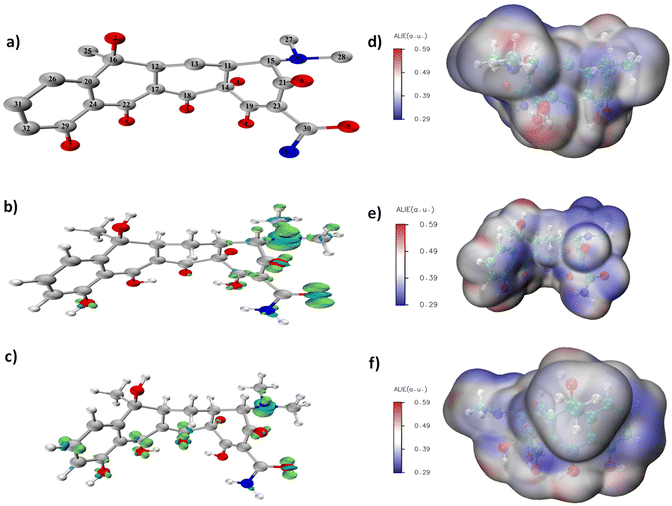
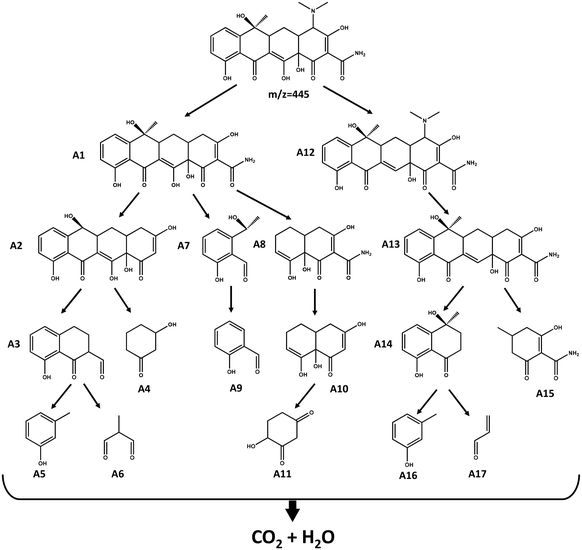
Multiwfn and VMD software were used to calculate and plot the intermediates produced during the TCH degradation. First, Gaussian16W was used to optimise the structure of tetracycline; the optimised structural model is shown in Fig. 5a. Multiwfn was used to calculate the Fukui function for tetracycline optimisation. The Fukui functions f- and f0 shown in Fig. 5b and c, f- and f05 were used to predict the electrophilic and free radical reaction sites. Among various active oxygen species produced by the Co NP-PBC/PMS system, the π2p orbital of 1O2 was not occupied, and it had strong electrophilicity, which was prone to electrophilic reactions.51 Among the other reactive oxygen species produced, O2˙−, SO4˙−, and ˙OH were prone to trigger free radical attacks. As shown in Fig. 5b, 8 O and 9 N were more prone to electrophilic reactions than the other atoms and were more vulnerable to 1O2 attacks. As shown in Fig. 5c, compounds 3 O, 5 O, 6 O, 8 O, 9 N, 18 C, 22 C, and 31 C exhibited high activity and were attacked by free radicals. Compression of the Fukui function can be used to quantitatively study the distribution of the Fukui function on each atom as well as display the electrophilicity of each atom on the TCH and the difficulty of free-radical reactions in a data format. In Multiwfn,52 the Hirshfeld charges were used to calculate the compressed Fukui function for the TCH; the results are listed in Table S1.† The condensed Fukui function and the Fukui functions are highly consistent. The average local ionisation energy diagram of TCH, which was presented by Sjoberg. P,53 mainly refers to the ionisation energy of an electron at a local position. A lower ionisation energy (blue part) indicates that the electron is bound weakly. Therefore, a higher activity is more conducive to participation in electrophilic or free radical reactions. In Fig. 5d–f, the blue colour around 3 O, 5 O, 6 O, 8 O, 9 N, 18 C, 22 C, and 31 C was more evident, indicating that these atoms are more prone to electrophilic or radical reactions. This result is consistent with the results obtained using the previous Fukui function and the condensed Fukui function.Through DFT calculations revealed that these atoms were vulnerable to ROS attack during TCH degradation; however, the specific chemical bond attack was unclear. Therefore, we introduced a Laplacian bond to analyse the strength of each chemical bond in the TCH. The Laplacian bond order (LBO) was determined by LU,54 who proposed that the size of the LBO can reflect the strength of bonds and has a good positive correlation with the bond dissociation energy. The LBO was calculated for the TCH using Multiwfn. The results are listed in Table S2.† It is seen that 9 N–15 C is more prone to fracture than 9 N–27 C and 9 N–28 C, indicating that the dimethylamino group is more easily detached from TCH. The intermediate products generated during the TCH degradation were identified using HPLC-MS. Fig. S9† shows the m/z and retention times of the TCH degradation intermediates based on HPLC-MS. By combining the results of HPLC-MS with the DFT calculations, such as the Fukui function and the average local ionisation energy of TCH, the degradation pathway of TCH was predicted, as shown in Fig. 6.
First, the dimethylamino group on TCH detached from the parent substance, producing intermediate A1, while 18 C and 22 C were attacked by free radicals to open the ring (pathways 1 and 2), resulting in intermediate products such as A 3–11. In path 3, the 3 O of TCH was attacked to produce intermediate A12. Under the action of ROS, A12 underwent a series of free radical reactions and demethylation, dimethylamino, and dehydration reactions, producing various intermediate products such as A13–17, which in turn leads to the deep oxidation and mineralisation of TCH.
The toxicity of the intermediate products generated during TCH degradation is an important basis for determining their potential environmental risks. To test the toxicity of TCH and its intermediate products, TEST version 5.1.2 was used for predicting the oral rat LD 50, developmental toxicity, mutagenicity, and bioconcentration factors (BCFs) of TCH and the intermediate products based on the quantitative structure–activity relationship method.
Fig. 7a shows the oral rat LC50 of TCH and its intermediate products. The LC50 of TCH (1524.04 mg kg−1) is classified as moderately toxic.55,56 Among the intermediate products produced, only A 6, A 9, A 15, and A 16 showed a slight reduction in toxicity, whereas the rest showed moderate toxicity, although some products showed a decrease in LC50. According to Fig. 7b, TCH is considered a developmental toxicity-negative chemical. Among the intermediate products, only A 8 was developmental toxicity positive, whereas the others were developmental toxicity negative. In Fig. 7c, TCH with a mutagenicity of 0.6 mg L−1 was considered mutagenicity negative. Among the intermediate products, only A 1, A 11, A 12, and A 13 remained mutagenicity negative, whereas the others were mutagenicity positive. Fig. 7d shows that only the bioconcentration functions of A 9 and A 14 decreased after catalytic oxidation, whereas the other intermediate products showed an increase in BCF. The detailed results are shown in Table S3.† In summary, most of the intermediates produced by TCH degradation are nontoxic, and a small number of toxic molecules can be completely mineralised by prolonging the degradation time and increasing the PMS dosage (Scheme 2).
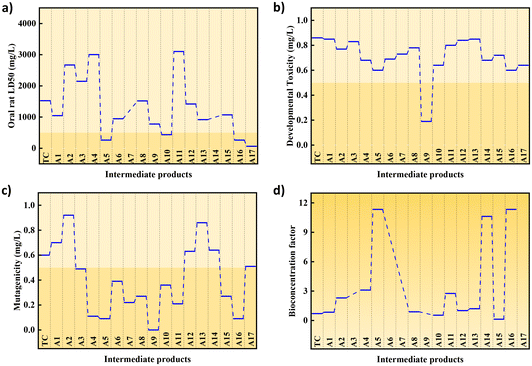 | ||
| Fig. 7 (a) Oral rat LD 50, (b) developmental toxicity, (c) mutagenicity, (d) bioconcentration factor of different intermediates produced during the degradation of tetracycline. | ||
Cyclic performance testing of Co NP-PBC
To test the reusability of the Co NP-PBC, we washed the completed catalyst with water and ethanol to remove possible small molecule organic compounds from its surface, collected them, and conducted the adsorption degradation experiments again. The effects of degradation are shown in Fig. S10.† From the figure, we can see that after one use, the adsorption effect of Co NP-PBC is greatly reduced, and after adding PMS, there is no effective degradation of TCH. For this purpose, we optimised the synthesis method for Co NP-PBC and synthesised CPBC using high-temperature calcination instead of chemical reduction. As shown in Fig. S11,† the three cycle performance tests of CPBC after optimising the synthesis method reveal efficiency values of 98%, 96%, and 93%, respectively. The TEM of the sample after three cycles is shown in Fig. S12,† and by comparing with Fig. 1, we can observe that the morphology and structure of the CPBC did not change significantly, and the elemental composition in the catalyst did not change as can be seen in Fig. S12d–g.†Conclusions
In this study, Co-loaded PBC was prepared to activate PMS and degrade tetracycline in water. The excellent performance of Co NP-PBC is attributed to the high adsorption capacity of P and the high activation ability of Co loaded on PMS, which enable synergistic adsorption and degradation, leading to the rapid degradation of tetracycline. Quenching experiments and electron paramagnetic resonance EPR analysis showed that non-free radical oxidation dominated by 1O2 played a crucial role in the degradation process. This study provides insights into the purification of wastewater using BC-based catalysts.Author contributions
All authors have given approval to the final version of the manuscript.Conflicts of interest
The authors declare that they have no known competing financial interests or personal relationships that could have appeared to influence the work reported in this paper.Acknowledgements
The project was supported by National Key R&D Program of China (2022YFC3203001), Research Project Supported by Shanxi Scholarship Council of China (2022-017) and Xinzhou Science and Technology Plan Project (20220301).References
- X. Ao, W. Sun, S. Li, C. Yang, C. Li and Z. Lu, Chem. Eng. J., 2019, 361, 1053–1062 CrossRef CAS.
- R. Daghrir and P. Drogui, Environ. Chem. Lett., 2013, 11, 209–227 CrossRef CAS.
- I. Chopra and M. Roberts, Microbiol. Mol. Biol. Rev., 2001, 65, 232–260 CrossRef CAS PubMed.
- J. Liang, L. Fu, K. Gao, P. Zhang, X. Duan, X. Gong and L. Cai, Chem. Eng. J., 2023, 460, 141797 CrossRef CAS.
- L. Xu, H. Zhang, P. Xiong, Q. Zhu, C. Liao and G. Jiang, Sci. Total Environ., 2021, 753, 141975 CrossRef CAS PubMed.
- C. Chen, D. Chen, S. Xie, H. Quan, X. Luo and L. Guo, ACS Appl. Mater. Interfaces, 2017, 9, 41043–41054 CrossRef CAS PubMed.
- Y. Luo, W. Guo, H. H. Ngo, L. D. Nghiem, F. I. Hai, J. Zhang, S. Liang and X. C. Wang, Sci. Total Environ., 2014, 473–474, 619–641 CrossRef CAS PubMed.
- K. Zhu, C. Liu, W. Xia, Y. Wang, H. He, L. Lei, Y. Ai, W. Chen and X. Liu, J. Colloid Interface Sci., 2022, 625, 890–902 CrossRef CAS PubMed.
- Y.-M. Huang, G. Li, M. Li, J. Yin, N. Meng, D. Zhang, X.-Q. Cao, F.-P. Zhu, M. Chen, L. Li and X.-J. Lyu, Sci. Total Environ., 2021, 754, 141999 CrossRef CAS PubMed.
- G. Xiao, T. Xu, M. Faheem, Y. Xi, T. Zhou, H. T. Moryani, J. Bao and J. Du, Int. J. Environ. Res. Public Health, 2021, 18, 3344 CrossRef CAS PubMed.
- A. Tsitonaki, B. Petri, M. Crimi, H. MosbÆk, R. L. Siegrist and P. L. Bjerg, Crit. Rev. Environ. Sci. Technol., 2010, 40, 55–91 CrossRef CAS.
- B. Xu, X. Zhang, Y. Zhang, S. Wang, P. Yu, Y. Sun, X. Li and Y. Xu, Chem. Eng. J., 2023, 466, 143155 CrossRef CAS.
- L. Yang, W. Chen, C. Sheng, H. Wu, N. Mao and H. Zhang, Appl. Surf. Sci., 2021, 549, 149300 CrossRef CAS.
- X. Zhang, B. Xu, S. Wang, X. Li, C. Wang, B. Liu, F. Han, Y. Xu, P. Yu and Y. Sun, Chem. Eng. J., 2022, 431, 133477 CrossRef CAS.
- S. Wang and J. Wang, Chem. Eng. J., 2019, 356, 350–358 CrossRef CAS.
- Q. Yang, Y. Yang, Y. Zhang, L. Zhang, S. Sun, K. Dong, Y. Luo, J. Wu, X. Kang, Q. Liu, M. S. Hamdy and X. Sun, Chemosphere, 2023, 311, 137020 CrossRef CAS PubMed.
- L. Fan, Y. Zheng, J. Li, Z. Du, J. Ren, H. Sun, H. Zhao and F. Cheng, Chem. Eng. J., 2022, 450, 138278 CrossRef CAS.
- S. Mao, P. Zhao, Y. Wu, C. Liu, M. Xia and F. Wang, Chem. Eng. J., 2023, 451, 138503 CrossRef CAS.
- G. Salehi, M. Bagherzadeh, R. Abazari, M. Hajilo and D. Taherinia, ACS Omega, 2024, 9, 4581–4593 CrossRef CAS PubMed.
- R. Abazari, S. Sanati, M. A. Bajaber, M. S. Javed, P. C. Junk, A. K. Nanjundan, J. Qian and D. P. Dubal, Small, 2023, 20, 2306353 CrossRef PubMed.
- Y. Hu, R. Abazari, S. Sanati, M. Nadafan, C. L. Carpenter-Warren, A. M. Z. Slawin, Y. Zhou and A. M. Kirillov, ACS Appl. Mater. Interfaces, 2023, 15, 37300–37311 CrossRef CAS PubMed.
- S. Sanati, A. Morsali and H. García, J. Energy Chem., 2023, 87, 540–567 CrossRef CAS.
- B. Hua, L. Zheng, A. Adeboye and F. Li, Chem. Eng. J., 2022, 443, 136439 CrossRef CAS.
- R. Zou, M. Qian, C. Wang, W. Mateo, Y. Wang, L. Dai, X. Lin, Y. Zhao, E. Huo, L. Wang, X. Zhang, X. Kong, R. Ruan and H. Lei, Chem. Eng. J., 2022, 441, 135972 CrossRef CAS.
- Y. Li, B. Xing, Y. Ding, X. Han and S. Wang, Bioresour. Technol., 2020, 312, 123614 CrossRef CAS PubMed.
- W. Yang, W. Yang, L. Kong, A. Song, X. Qin and G. Shao, Carbon, 2018, 127, 557–567 CrossRef CAS.
- Z.-F. Wang, Z. Yi, A. Ahmad, L. Xie, J.-P. Chen, Q. Kong, F. Su, D.-W. Wang and C.-M. Chen, J. Energy Chem., 2021, 59, 100–107 CrossRef CAS.
- C. Vogt and B. M. Weckhuysen, Nat. Rev. Chem., 2022, 6, 89–111 CrossRef PubMed.
- Y. Zhang, L. Yang, Y. Tian, L. Li, J. Li, T. Qiu, G. Zou, H. Hou and X. Ji, Mater. Chem. Phys., 2019, 229, 303–309 CrossRef CAS.
- W. Xie, Q. Zhang, S. Song, X. Cheng, Y. Yang, L. Wang, X. Ouyang, S. Xie and J. Huang, J. Colloid Interface Sci., 2023, 652, 1522–1532 CrossRef CAS PubMed.
- H. Song, L. Yan, J. Ma, J. Jiang, G. Cai, W. Zhang, Z. Zhang, J. Zhang and T. Yang, Water Res., 2017, 116, 182–193 CrossRef CAS PubMed.
- M. W. Smith, I. Dallmeyer, T. J. Johnson, C. S. Brauer, J.-S. McEwen, J. F. Espinal and M. Garcia-Perez, Carbon, 2016, 100, 678–692 CrossRef CAS.
- A. Wang, M. Du, J. Ni, D. Liu, Y. Pan, X. Liang, D. Liu, J. Ma, J. Wang and W. Wang, Nat. Commun., 2023, 14, 6733 CrossRef CAS PubMed.
- J. Wang and S. Wang, Chem. Eng. J., 2018, 334, 1502–1517 CrossRef CAS.
- P. Hu and M. Long, Appl. Catal., B, 2016, 181, 103–117 CrossRef CAS.
- R. Zhang, Y. Wan, J. Peng, G. Yao, Y. Zhang and B. Lai, Chem. Eng. J., 2019, 372, 796–808 CrossRef CAS.
- J. Ren, Y. Huang, J. Yao, S. Zheng, Y. Zhao, Y. Hou, B. Yang, L. Lei, Z. Li and D. D. Dionysiou, Water Res., 2023, 243, 120341 CrossRef CAS PubMed.
- P. Duan, X. Liu, B. Liu, M. Akram, Y. Li, J. Pan, Q. Yue, B. Gao and X. Xu, Appl. Catal., B, 2021, 298, 120532 CrossRef CAS.
- Y. Wen, V. K. Sharma and X. Ma, ACS ES&T Water, 2022, 2, 635–643 Search PubMed.
- Y. Ji, C. Dong, D. Kong and J. Lu, J. Hazard. Mater., 2015, 285, 491–500 CrossRef CAS PubMed.
- A. Ghauch and A. M. Tuqan, Chem. Eng. J., 2012, 183, 162–171 CrossRef CAS.
- J. Wang and S. Wang, Chem. Eng. J., 2020, 401, 126158 CrossRef CAS.
- J. Wang and S. Wang, Chem. Eng. J., 2021, 411, 128392 CrossRef CAS.
- Y. Wang, D. Cao and X. Zhao, Chem. Eng. J., 2017, 328, 1112–1121 CrossRef CAS.
- B. Liu, W. Song, H. Wu, Z. Liu, Y. Teng, Y. Sun, Y. Xu and H. Zheng, Chem. Eng. J., 2020, 398, 125498 CrossRef CAS.
- Q. Yi, J. Ji, B. Shen, C. Dong, J. Liu, J. Zhang and M. Xing, Environ. Sci. Technol., 2019, 53, 9725–9733 CrossRef CAS PubMed.
- Y. Zhao, H. Wang, X. Li, X. Yuan, L. Jiang and X. Chen, J. Hazard. Mater., 2021, 420, 126552 CrossRef CAS PubMed.
- Y. Wang, Y. Lin, S. He, S. Wu and C. Yang, J. Hazard. Mater., 2024, 461, 132538 CrossRef CAS PubMed.
- X. Li, L. Wu, A. Zhang, S. Wu, Y. Lin and C. Yang, J. Environ. Sci., 2024, 138, 212–226 CrossRef PubMed.
- T. Yang, S. Fan, Y. Li and Q. Zhou, Chem. Eng. J., 2021, 419, 129590 CrossRef CAS.
- R. Yin, W. Guo, H. Wang, J. Du, Q. Wu, J.-S. Chang and N. Ren, Chem. Eng. J., 2019, 357, 589–599 CrossRef CAS.
- T. Lu and F. Chen, J. Comput. Chem., 2011, 33, 580–592 CrossRef PubMed.
- P. Politzer, J. S. Murray and F. A. Bulat, J. Mol. Model, 2010, 16, 1731–1742 CrossRef CAS PubMed.
- T. Lu and F. Chen, J. Phys. Chem. A, 2013, 117, 3100–3108 CrossRef CAS PubMed.
- H. C. Hodge and J. H. Sterner, Am. Ind. Hyg. Assoc., Q., 2008, 10, 93–96 Search PubMed.
- H. Li, H. Ji, J. Liu, W. Liu, F. Li and Z. Shen, Appl. Catal., B, 2023, 328, 122481 CrossRef CAS.
Footnote |
| † Electronic supplementary information (ESI) available. See DOI: https://doi.org/10.1039/d4dt00758a |
| This journal is © The Royal Society of Chemistry 2024 |

