 Open Access Article
Creative Commons Attribution 3.0 Unported Licence
Synthesis and photoluminescence properties of high-quality reddish-orange emitting Ca4Nb2O9:Eu3+ phosphors for WLEDs and anti-counterfeiting
Weiwei
Xiang
and
Jae Su
Yu
 *
*
Department of Electronic and Information Convergence Engineering, Institute for Wearable Convergence Electronics, Kyung Hee University, Yongin-si, Gyeonggi-do 17104, Republic of Korea. E-mail: jsyu@khu.ac.kr
First published on 17th May 2024
Abstract
In this report, we successfully synthesized a novel trivalent europium (Eu3+)-activated Ca4Nb2O9 phosphor emitting reddish-orange light via its 5D0 → 7F1 and 5D0 → 7F2 transitions. In the Ca4Nb2O9 host, Eu3+ ions exhibited optimal doping at a concentration of 15 mol%, with the concentration-quenching mechanism predominantly driven by electric dipole–dipole interactions. In addition, the Ca4Nb2O9:Eu3+ phosphor exhibited excellent thermal stability with a photoluminescence (PL) intensity of 71.6% at a working temperature of 423 K. Interestingly, the internal PL quantum yield (PLQY) of the optimal sample was obtained to be 87.43%, and the external PLQY was determined to be 47.81%. The fabricated white light-emitting diode that employed this optimized phosphor alongside commercial phosphors, via a novel silica epoxy gel (parts A and B)-based method, exhibited good color rendering index (color rendering index = 80.65), excellent warm-correlated color temperature (correlated color temperature = 3753 K), and Commission International de l'Eclairage chromaticity coordinate (0.3922, 0.3845). Moreover, the optimal phosphor was introduced into the polyvinyl alcohol (PVA) polymer film, creating a translucent film. These films were then fabricated on glass, plastic, and card, which showed a satisfying emission under ultraviolet radiation. Consequently, the proposed Eu3+-activated Ca4Nb2O9 phosphors can be used as light sources and the Ca4Nb2O9:Eu3+-PVA film is proposed for anti-counterfeiting applications.
1. Introduction
Recently, rare-earth ion doped inorganic compounds have garnered significant attention due to their excellent luminescence properties.1,2 These properties have positioned them as key players in various applications such as lighting devices, biomarkers, medical instruments, optical thermometers, and anti-counterfeiting applications.3–7 In particular, because of their high efficiency, long service time, and environmental-friendly features, white light-emitting diodes (WLEDs), which are a type of next-generation solid-state lighting source, have rapidly advanced lighting industry systems.8,9 Moreover, solid-state combinations of different phosphors are commonly used to build phosphor-converted WLEDs (pc-WLEDs). The most commonly used commercial phosphors are YAG:Ce (Y3Al5O12:Ce3+), (Ba,Sr)Si2N2O2:Eu2+, β-Sialon:Eu2+ (Si6−zAlzOzN8−z, 0.1 ≤ z ≤ 2.0), Sr3SiO5:Eu2+, and KSF:Mn4+ (K2SiF6:Mn4+).10–14 Regrettably, conventional WLEDs employing yellow phosphors activated by blue InGaN LED chips possess spectral imperfections, which results in a high CCT value of approximately 7750 K and a CRI value of <80. These are in addition to the shortcomings of low luminous efficiency and an unstable spectrum.15,16 To address these issues, research into red-green-blue phosphors co-activated LEDs has recently been conducted.17,18 This approach offers the advantage of controlling the content of each component and adjusting the performance of the triangular LED system accordingly.Trivalent europium (Eu3+) is a typical activating ion in red-emitting materials. In response to its charge transfer band (CTB) and featured transitions (7F0 → 5D4, 5GJ, 5L6, and 5D3) occurring between 200–300 nm and 300–450 nm, it expresses good absorption capabilities in the ultraviolet (UV) and near-UV (NUV)19,20 ranges. The emission characteristics of Eu3+ are sensitive to symmetry, affecting the performance of both the electric dipole (ED) and magnetic dipole (MD) transitions. When inversion symmetry is dominant, the Eu3+ ions emit approximately 591 nm emission for the MD transition (5D0 → 7F1), while the ED transition (5D0 → 7F2) is forbidden. In contrast, in a non-inversion symmetric crystal environment, the main spectrum in emission is governed by the ED transition, resulting in radiation of approximately 613 nm.21,22 In this case, selecting an ideal host lattice is essential for enhancing the emission efficiency.
Owing to their outstanding crystal diversity and multifunctionality, niobates serve as significant host materials that have attracted considerable interest in indoor lighting devices, meeting the requirements of industrial products. Some new niobate-based phosphors such as Sr3CaNb2O9:Eu3+, Ca2InNbO6:Sm3+, Na2Ca2Nb4O13:Eu3+, Li6CaLa2Nb2O12:Yb/Er, LaMg0.402Nb0.598O3:Pr3+, and Ba3ZnNb2O9:Eu3+ have been reported.23–28 Zhang et al. suggested that Ca4Nb2O9:Pr3+ phosphors could compensate for the flickering behavior of alternating current (AC)-LEDs and might be suitable for application in AC-LEDs.29 However, to the best of our knowledge, there is no reported study on Ca4Nb2O9:Eu3+ phosphors.
In addition, the application of rare-earth phosphors in anti-counterfeiting measures is widespread in the era of information security. Compared to the existing anti-counterfeiting technologies, rare-earth-activated phosphors have significant advantages in terms of cost, convenience, safety, transparency, convenient inspection, defensiveness, and efficiency.30,31 These advantages render phosphor-based confidentiality methods competitive.
In this study, Eu3+ doped Ca4Nb2O9 phosphors with different dopant concentrations were synthesized through a high-temperature solid-state reaction. The properties of the synthesized phosphors were analyzed, including their PL excitation (PLE) and PL emission spectra, Commission International de l'Eclairage (CIE) chromaticity coordinates, and color purity. Additionally, the concentration quenching, thermal quenching, and decay lifetimes of these materials were investigated. Finally, red-emitting LED and WLED devices using the developed phosphors were packaged via a novel method for practical applications. The as-prepared phosphors were introduced in security applications.
2. Experimental procedure
The raw materials used for the synthesis of the Ca4Nb2O9:Eu3+ phosphors included calcium carbonate (CaCO3, 99.99%), niobium(V) oxide (Nb2O5, 99.99%), and europium(III) oxide (Eu2O3, 99.99%), which were purchased from Sigma-Aldrich without further purification. Through a high-temperature solid-state reaction technique, a series of Ca4Nb2O9:xEu3+ (x = 0.01–0.25) phosphors were synthesized. After being weighed and ground, the mixture was transferred into alumina crucibles, being heated at 1350 °C for 12 h. Finally, the samples were cooled down to room temperature and ground for 30 min.Red-emitting LED and WLED devices were fabricated using silica epoxy gel (parts A and B), the optimized Ca4Nb2O9:Eu3+ phosphor, and commercial blue and green phosphors. For the red-emitting LED device, 0.1 g of Ca4Nb2O9:0.15Eu3+ phosphor was mixed with 0.5 g of silica epoxy gel, and for the WLED device, 0.1 g of Ca4Nb2O9:0.15Eu3+ phosphor, 0.05 g of BaMgAl10O17:Eu2+ blue phosphor (BAM:Eu2+), and 0.07 g of BaSc2Si3O10:Eu2+ green phosphor (BSS:Eu2+) were mixed with 1 g of silica epoxy gel. The as-prepared slurries were applied onto the 405 nm emitting chips and dried in an oven at 80 °C for 6 h.
The flexible luminescent anti-counterfeit films were synthesized by mixing the phosphor with a polyvinyl alcohol (PVA) solution. First, the PVA powder was diffused in pure water at a 15% weight ratio and stirred at 90 °C for 1 h. After the mixture formed a transparent solution, heating was stopped, and the phosphor was added. Following stirring for another 1 h, the mixture was smeared onto glass and plastic bases.
A diffractometer (Bruker D8 Advance, utilizing Cu Kα radiation (λ = 0.154056 nm)) was employed to investigate the crystalline structures of as-prepared samples with X-ray diffraction (XRD) within the 2θ range of 5°–90°. Their morphologies were analyzed by field-emission scanning electron microscopy (FE-SEM; Carl Zeiss). Energy-dispersive X-ray spectroscopy (EDS) elemental mapping images were measured using an instrument attached to the FE-SEM. The PLE and PL emission spectra of the prepared samples were obtained by using a fluorescence spectrophotometer (Scinco Fluorometer FS-2). For the optimized sample, X-ray photoelectron spectroscopy (XPS, K-alpha (Thermo Electron)) analysis was conducted.
3. Results and discussion
To identify the phases of the as-synthesized phosphor samples, XRD analysis was carried out, as displayed in Fig. 1. The XRD pattern of undoped Ca4Nb2O9 closely matched that of PDF card 49-0910, and little difference was observed when Eu3+ ions were introduced into the host lattice, which suggests that the Eu3+ ions caused a slight change in the crystal structure when introduced into the host lattice. The radius deviation (Dr) between the doped and host ions was calculated using the following equation:32 | (1) |
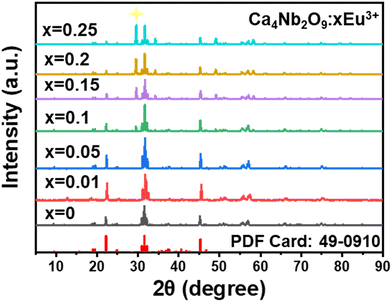 | ||
| Fig. 1 XRD patterns of the prepared Ca4Nb2O9:xEu3+ (x = 0, 0.01, 0.05, 0.1, 0.15, 0.2, and 0.25, in mol) phosphors. | ||
To investigate the elemental composition and chemical states of atoms in the Ca4Nb2O9:Eu3+ phosphor, XPS analysis was performed in the energy range of 0–1400 eV and the spectrum is shown in Fig. 2(a). Peaks for all the elements (Ca, Nb, O, and Eu) and additional carbon were observed. The C 1s peak at 284.8 eV served as the calibration reference. Peaks for Ca, Nb, O, and Eu were observed in the XPS survey scan spectrum. The high-resolution XPS (HR-XPS) spectra of each element are illustrated in Fig. 2(b–e). The two peaks located at 346.53 and 350.07 eV correspond to Ca 2p1/2 and 2p3/2, respectively,36 while the peaks at the binding energies of 206.70 and 209.45 eV are associated with Nb 3d3/2 and 3d5/2, respectively.37 In the O 1s core-level spectrum, the broad peak represents a combination of three peaks (529.58, 531.34, and 533.41 eV),38 which are ascribed to lattice oxygen, oxygen vacancies, and surface oxygen, respectively. The HR-XPS spectrum of Eu 3d revealed four peaks at 1163.99, 1154.29, 1134.12, and 1124.56 eV, which belong to Eu3+ 3d3/2, Eu2+ 3d3/2, Eu3+ 3d5/2, and Eu2+ 3d5/2, respectively.39 The appearance of the Eu2+ 3d peaks suggests the presence of two Eu ion environments.
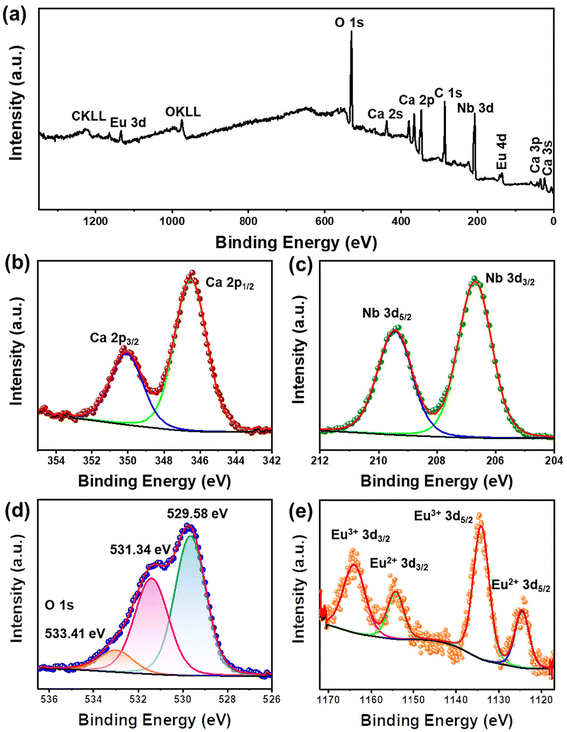 | ||
| Fig. 2 (a) Total XPS survey scan spectrum of the Ca4Nb2O9:0.15Eu3+ phosphor. (b–e) HR-XPS core-level spectra of Ca 2p, Nb 3d, O 1s, and Eu 3d. | ||
The FE-SEM images of the optimal sample Ca4Nb2O9:0.15Eu3+ with various scales are presented in Fig. 3(a–d), indicating the non-uniform microstructure of the Ca4Nb2O9 phosphor. This is a common phenomenon observed in materials synthesized via high-temperature solid-state methods, which exhibited irregular shapes and agglomerations. The elemental mapping images are compared in Fig. 3(e), demonstrating the homogenous distribution of Ca, Nb, O, and Eu within the compound. The peaks corresponding to Ca, Nb, O, and Eu elements are illustrated in the EDS spectrum (Fig. 3(f)).
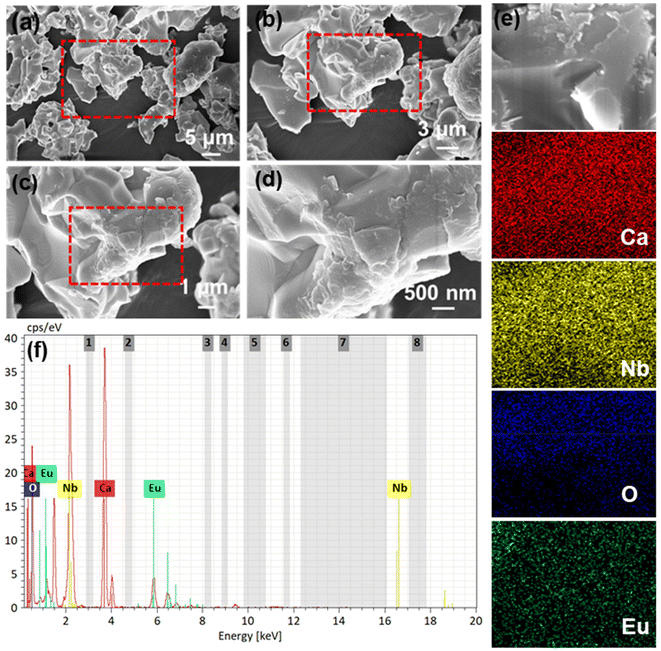 | ||
| Fig. 3 (a–d) FE-SEM images of the Ca4Nb2O9:0.15Eu3+ phosphor at different magnifications. (e) Elemental mapping images and (f) EDS spectrum of the as-synthesized phosphor. | ||
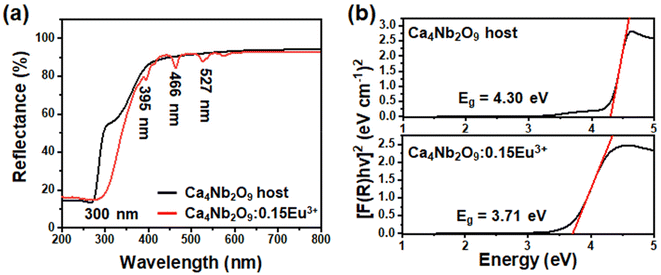
To investigate the band gaps of the host and optimal samples, the diffuse reflection spectroscopy (DRS) spectra are compared in Fig. 4(a). The Eu3+-doped phosphor exhibited absorption peaks at 300, 395, 466, and 527 nm. The band gaps of both the host and doped phosphor samples were estimated using the Kubelka–Munk (K–M) function:40
 | (2) |
| (αhv)n = A(hv − Eg) | (3) |
| (F(R∞)hv)n = A(hv − Eg) | (4) |
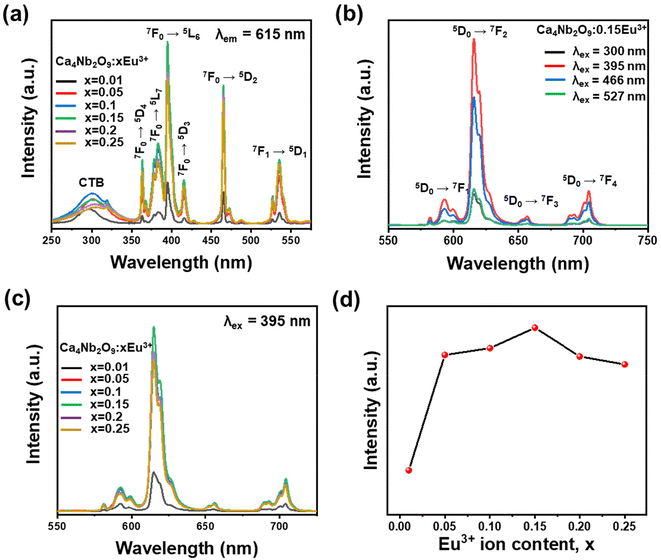
Fig. 5(a) shows the comparative PLE spectra at an emission wavelength of 615 nm for the Ca4Nb2O9:xEu3+ (where x ranges from 0.01 to 0.25) phosphors. The wide peak at approximately 300 nm is attributed to the CTB of O2−–Eu3+. A series of absorption peaks from 350 to 550 nm for the f–f transition were observed, with the peaks located at 364, 384, 395, 406, 466, and 527 nm (similar to the absorption peaks shown in Fig. 4(a)) corresponding to the 7F0 → 5D4, 7F0 → 5L7, 7F0 → 5L6, 7F0 → 5D3, 7F0 → 5D2, and 7F1 → 5D1 transitions.43,44Fig. 5(b) shows the emission spectra of the optimal phosphor with the excitation wavelengths of 300, 395, 466, and 527 nm. With the highest PL intensity, 395 nm was considered the ideal excitation wavelength for the as-prepared samples. Fig. 5(c) shows the PL emission spectra of Eu3+ doped phosphors with different dopant concentrations. The emission peaks at 588, 615, 655, and 712 nm are ascribed to the transitions from 5D0 to 7FJ (where J = 1, 2, 3, and 4), respectively.45 The results of the luminescence measurements revealed that as the Eu3+ ion concentration increased, there was practically no change in the shapes and positions of these peaks. As shown in Fig. 5(d), the PL intensity initially increased and then decreased as the Eu3+ ion concentration increased, reaching a peak at 15 mol%, which could be attributed to concentration quenching. The critical distance (Rc) can be determined based on Blasse's model:46
 | (5) |
 | (6) |
 | (7) |
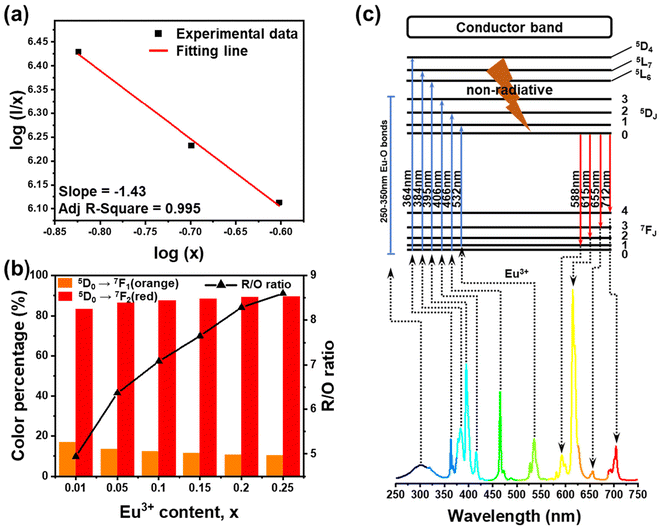
As shown in Fig. 6(a), the slope was −1.43, representing that Q was 4.29, approaching 6. This suggests that the electric d–d interaction enables non-radiative (NR) energy transfer of the dopant ions in the compound. The ratios of MD transition (5D0 → 7F1) and ED transition (5D0 → 7F2) are provided in Fig. 6(b). As the Eu3+ ion concentration increased, the red-to-orange ratio (R/O) increased, which results from environment changes. Generally, the 5D0 → 7F2 (orange) transition is an ultrasensitive ED transition highly sensitive to the crystal site environment. The 5D0 → 7F1 (red) transition is an MD transition, which remains stable even when the crystal structure changes.50,51 As the concentration of Eu3+ ions rises, they continuously occupy the sites of Ca2+, destroying the symmetry of the structure and making the ratio shift towards 5D0 → 7F2 transition.52 This indicates that with the increase in Eu3+ ions, the color of Ca4Nb2O9:Eu3+ shifts towards the red side. Interestingly, the full width at half maximum (FWHM) of the Ca4Nb2O9:0.15Eu3+ phosphor was approximately 8 nm, which was much narrower than those of typical red-emitting phosphors used in displays such as Sr2Si5N8:Eu2+ (FWHM = 86 nm), CaAlSiN3:Eu2+ (FWHM = 94 nm), and KSF:Mn4+ (FWHM = 30 nm).53–55 This performance is attributed to the hypersensitive 5D0 → 7F2 transition.56
The luminescence spectrum in Fig. 6(c) illustrates the Eu3+ energy levels in the Ca4Nb2O9 host, which is responsible for the excitation and emission processes. Electrons in the valence band are excited by higher energy radiation and transferred to the excited states. After progressing down to 5D0 through NR transition, it finally descended to 7FJ (where J = 0, 1, 2, 3, and 4) states, releasing the energy gap between the valence band and conduction band as photons.57 The main absorption peak at 395 nm showed that the as-synthesized phosphor could be efficaciously excited by commercial UV LED chips.
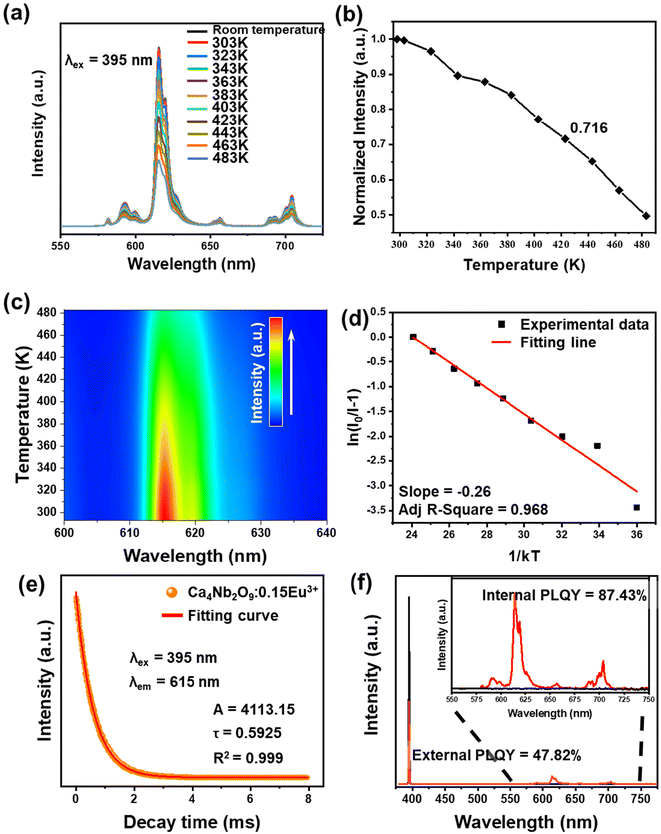
To study the thermal stability, we measured the temperature-dependent PL spectra of the Ca4Nb2O9:0.15Eu3+ phosphor from room temperature towards 483 K, with the results presented in Fig. 7(a). The decrease in the intensity of the main peak can be clearly viewed in Fig. 7(b). However, the phosphor still had 71.6% intensity at a high temperature (423 K), indicating that the Ca4Nb2O9:0.15Eu3+ phosphor has good thermal stability. To better understand it, the contour plot of main peak intensity as a function of temperature is shown in Fig. 7(c). The Arrhenius equation, which is a typical formula for obtaining the activation energy (Ea), is given by:58
 | (8) |
 | (9) |
 | (10) |
| External PLQY = Internal PLQY × Iabs | (11) |
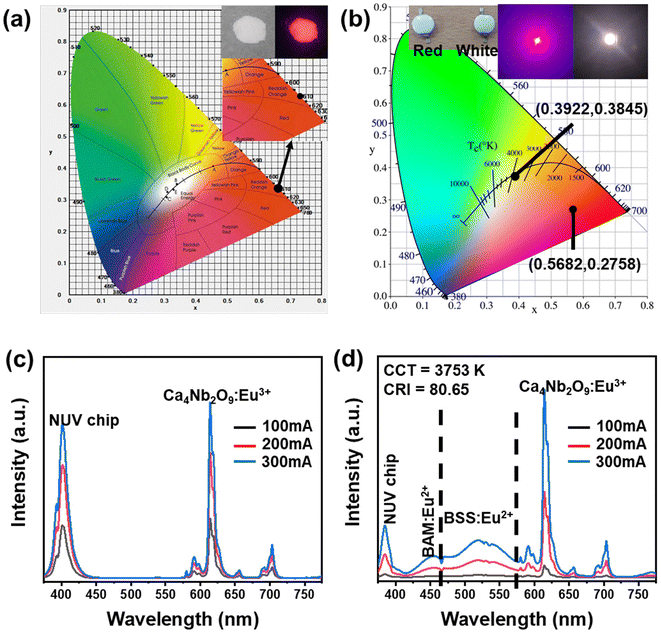
The CIE chromaticity coordinate (x, y) of the optimal sample with the excitation radiation of 395 nm and the photographs under normal light and 365 nm NUV light are shown in Fig. 8(a). At an excitation wavelength of 395 nm, the Ca4Nb2O9:0.15Eu3+ phosphor exhibited the CIE chromaticity coordinate of (0.6629 and 0.3344). In addition, the following equation was used to evaluate the color purity for the red emission of the Ca4Nb2O9:0.15Eu3+ phosphor under 395 nm excitation:60
 | (12) |
These outstanding properties make the Ca4Nb2O9:Eu3+ phosphor suitable for anti-counterfeiting applications. In this study, the phosphor was incorporated into a PVA solution for anti-counterfeiting films. To investigate its versatility, the films were applied to plastic, glass, and the Kyung Hee University student card, as shown in Fig. 9(a–c), respectively. The films appeared white and translucent under daylight irradiation, allowing the covered information to be fully visible. However, when exposed to UV radiation (365 nm), the patterns emitted bright red light, making them easily discernible. These results suggest that the Eu3+-activated Ca4Nb2O9 phosphors are prospective candidates for optical anti-counterfeiting films on various substrates.
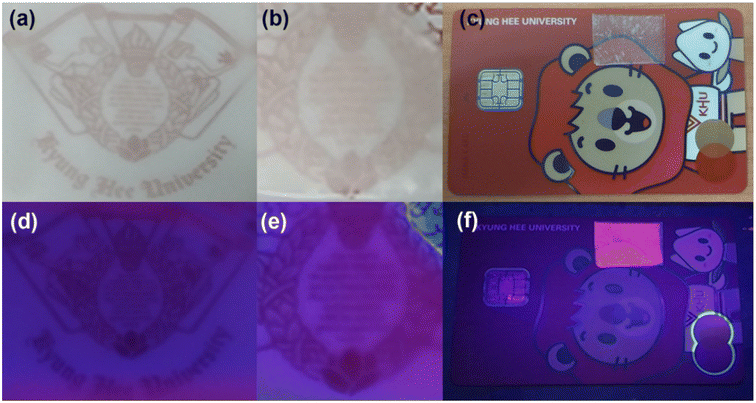 | ||
| Fig. 9 Photographic images of the fabricated anti-counterfeiting film attached to plastic, glass, and card under room light (a–c) and 365 nm illumination (d–f). | ||
4. Conclusion
A series of advanced high-purity red-emitting Ca4Nb2O9:Eu3+ phosphors were synthesized using a high-temperature solid-state method. XRD, XPS, FE-SEM, and EDS analyses were performed to investigate the structural properties. The PL properties reached their maximum when the Eu3+ ion concentration was 15 mol%, and the electric d–d interaction was confirmed to be the main reaction in the concentration quenching mechanism. The temperature stability of this phosphor was good, as it remained at 71.6% when the temperature was increased to 423 K (which is generally considered to be the working temperature of LEDs). Moreover, no shift in PL emission peaks was observed. The Ca4Nb2O9:0.15Eu3+phosphor had a CIE chromaticity coordinate of (0.6629, 0.3344) with a color purity of 95.5%. Combining the resultant phosphor with commercial blue and green phosphors enabled the fabrication of a warm-light white LED device with CCT of 3753 K and CRI of 80.65. From these results, the proposed red-emitting Ca4Nb2O9:Eu3+ phosphors are potential candidates for solid-state lighting applications based on WLED. Furthermore, the applicability of the resultant phosphors to optical security films was verified.Conflicts of interest
There are no conflicts to declare.Acknowledgements
This work was supported by the National Research Foundation of Korea (NRF) grant funded by the Korea government (MSIP) (No. RS-2023-00252268).References
- G. Wu, J. Xue, X. Li, Q. Bi, M. Sheng and Z. Leng, Ceram. Int., 2023, 49, 10615–10624 CrossRef CAS.
- N. K. Mishra, A. Kumar and K. Kumar, J. Alloys Compd., 2023, 947, 169440 CrossRef CAS.
- X. Hu, A. Zhang, H. Sun, F. Zeng, Y. Lei, L. Xie, R. Yu, B. Deng and H. Lin, J. Lumin., 2023, 258, 119806 CrossRef CAS.
- S. Wu, Q. Liu, M. G. Brik, P. Xiong, D. Wang, G. Zhang and Y. Chen, J. Am. Ceram. Soc., 2022, 105, 5793–5806 CrossRef CAS.
- H. Fan, Z. Lu, Y. Meng, P. Chen, L. Zhou, J. Zhao and X. He, Opt. Laser Technol., 2022, 148, 017804 CrossRef.
- X. Li, S. Chen, K. Zhang, S. Deng, J. He, B. Wang and Q. Zeng, Mater. Today Chem., 2023, 30, 101594 CrossRef CAS.
- Y. Hua, T. Wang, H. Li, J. S. Yu and L. Li, J. Alloys Compd., 2023, 930, 167454 CrossRef CAS.
- C. M. Nandanwar, N. S. Kokode, A. N. Yerpude and S. J. Dhoble, Mater. Lett.: X, 2023, 18, 100202 CAS.
- M. Ibrahim, M. Iqbal, Y.-T. Tang, S. Khan, D.-X. Guan and G. Li, Agronomy, 2022, 12, 2539 CrossRef CAS.
- Y. Tang, X. He, Y. Zhang, H. Yuan, Y. Xin, X. Ren, Q. Chen and H. Yin, J. Alloys Compd., 2022, 899, 163347 CrossRef CAS.
- I. H. Cho, G. Anoop, D. W. Suh, S. J. Lee and J. S. Yoo, Opt. Mater. Express, 2012, 2, 1292–1305 CrossRef CAS.
- Y. Gao, R. Iwasaki, D. Hamana, J. Iihama, S. Honda, M. Kumari, T. Hayakawa, S. Bernard, P. Thomas and Y. Iwamoto, Int. J. Appl. Ceram. Technol., 2023, 20, 153–165 CrossRef CAS.
- W. C. Lee, H. K. Yang, M. Kwak and B. K. Moon, Optik, 2018, 172, 1205–1210 CrossRef CAS.
- H. Ruan, T. Wang, L. Wang, Y. Li, J. Lei, D. Deng, J. Qiang, S. Liao and Y. Huang, Ceram. Int., 2023, 49, 35165–35174 CrossRef CAS.
- S. Lai, M. Zhao, Y. Zhao, M. S. Molokeev and Z. Xia, ACS Mater. Au, 2022, 2, 374–380 CrossRef CAS PubMed.
- Z. Liu, Z. Li, T. Seto and Y. Wang, Adv. Opt. Mater., 2023, 11, 2300845 CrossRef CAS.
- P. Sharma, J. Madda and S. Vaidyanathan, Dalton Trans., 2023, 41, 15043–15056 RSC.
- P. Linghu, X. Gong, J. Zhang, R. Cui and X. Guo, J. Solid State Chem., 2023, 327, 124282 CrossRef CAS.
- M. Rajendran and S. Vaidyanathan, ChemistrySelect, 2020, 5, 5128–5136 CrossRef CAS.
- J. K. Lee, Y. Hua and J. S. Yu, Ceram. Int., 2024, 50, 484–494 CrossRef CAS.
- G. Yuan, R. Cui, J. Zhang, X. Qi and C. Deng, Optik, 2021, 232, 166513 CrossRef CAS.
- Q. Chen, X. Guo, J. Zhang, H. Xu, M. Hu and R. Cui, J. Lumin., 2023, 258, 119812 CrossRef.
- X. Hu, A. Zhang, R. Tang, X. Jin, J. Che, X. Ouyang, C. Zhou, L. Xie, B. Deng and R. Yu, J. Alloys Compd., 2023, 938, 168540 CrossRef CAS.
- R. Cao, H. Xiao, F. Zhang, Z. Luo, T. Chen, W. Li, P. Liu and G. Zheng, J. Lumin., 2019, 208, 350–355 CrossRef CAS.
- P. Du, X. Sun, Q. Zhu and J.-G. Li, Scr. Mater., 2020, 185, 140–145 CrossRef CAS.
- H. Zhang, Z. Gao, G. Li, Y. Zhu, S. Liu, K. Li and Y. Liang, Chem. Eng. J., 2020, 380, 122491 CrossRef CAS.
- P. Zhang, N. Li, Z. Wei, Z. Wang, M. Gou, L. Zhao, W. Chen and Q. Qiang, New J. Chem., 2021, 45, 66–75 RSC.
- R. Mi, Y. Liu, L. Mei, X. Min, M. Fang, X. Wu, Z. Huang and C. Chen, Chem. Eng. J., 2023, 457, 141377 CrossRef CAS.
- X. Yu, H. Zhang and J. Yu, Aggregate, 2021, 2, 20–34 CrossRef CAS.
- B. Verma, R. N. Baghel, D. P. Bisen, N. Brahme and V. Jena, Opt. Mater., 2022, 123, 111787 CrossRef CAS.
- H. Fan, X. Meng, Y. Xu, Y. Lu and Y. Liu, Opt. Mater., 2023, 140, 113871 CrossRef CAS.
- R. Song, H. Tang, J. Li, Y. Niu, Y. Liu, J. He and J. Zhu, Opt. Mater., 2024, 148, 114859 CrossRef CAS.
- M. Deng, S. Huang, Y. Sun, Y. Wang, Y. Yan and M. Shang, J. Lumin., 2023, 263, 120137 CrossRef CAS.
- R. Bian, S. An, X. Wang, Y. Xue, J. Tian, Z. Liang and Z. Song, Int. J. Hydrogen Energy, 2024, 51, 787–795 CrossRef CAS.
- Z. Liu, Y. Huang, T. Chen and W. Feng, J. Solid State Chem., 2024, 329, 124431 CrossRef CAS.
- J. Y. Choi, J. M. Lee, Y. K. Baek, J. G. Lee and Y. K. Kim, Dalton Trans., 2021, 50, 14560–14565 RSC.
- Y. Qiu, R. Cui, J. Zhang and C. Deng, J. Solid State Chem., 2023, 327, 124265 CrossRef CAS.
- G. R. Mamatha, B. R. R. Krushna, J. Malleshappa, B. Subramanian, B. D. Prasad, C. Srikanth and H. Nagabhushana, J. Photochem. Photobiol., A, 2023, 439, 114560 CrossRef CAS.
- A. Shaukat, M. A. Farrukh, K.-K. Chong, R. Nawaz, M. T. Qamar, S. Iqbal, N. S. Awwad and H. A. Ibrahium, Catalysts, 2023, 13, 1135 CrossRef CAS.
- S. Kumari, A. S. Rao and R. K. Sinha, J. Mol. Struct., 2024, 1295, 136507 CrossRef CAS.
- Z. Guo, H. Jiang, H. Li, H. Zhang, C. Liu, R. Zhao, Z. Yang, H. Tang, J. Li, J. Zhang and J. Zhu, Appl. Mater. Today, 2024, 37, 102095 CrossRef.
- X. Han, C. Xin, S. Wang, J. Wu, Z. Ye, H. Yu and H. Zhang, Inorg. Chem., 2023, 62, 9679–9686 CrossRef CAS PubMed.
- N. Shaishta, W. U. Khan, S. K. B. Mane, A. Hayat, D.-D. Zhou, J. Khan, N. Mehmood, H. K. Inamdar and G. Manjunatha, Int. J. Energy Res., 2020, 44, 8328–8339 CrossRef CAS.
- J. Xu, J. Luo, L. Zeng, Y. Tao, G. Li, C. Li, J. Liu, L. Zhou, S. Hu, J. Yang, F. Lin and J. Tang, Ceram. Int., 2023, 49, 17271–17282 CrossRef CAS.
- Q. Wu, Y. Li, Y. Wang, H. Liu, S. Ye, L. Zhao, J. Ding and J. Zhou, Chem. Eng. J., 2020, 401, 126130 CrossRef CAS.
- J. Du, S. Liu, Z. Song and Q. Liu, ACS Appl. Mater. Interfaces, 2023, 15, 53738–53745 CrossRef CAS PubMed.
- G. Lu, Y. Wang, S. Piao, J. Zhang, X. Zhang, X. Zhou, Y. Cao, X. Li and B. Chen, J. Am. Ceram. Soc., 2023, 106, 1216–1229 CrossRef CAS.
- A. Bashiri, A. Vaskin, K. Tanaka, M. Steinert, T. Pertsch and I. Staude, ACS Nano, 2024, 18, 506–514 CrossRef CAS PubMed.
- F. Xie, J. Gu, S. Zhong, P. Zhang, Y. Wen, Y. Li, H. Xu, S. Yao, Q. Zhang and J. Li, Mater. Today Chem., 2024, 37, 102019 CrossRef CAS.
- A. Princy, E. A. Rathnakumari and S. M. M. Kennedy, J. Am. Ceram. Soc., 2023, 106, 5364–5380 CrossRef CAS.
- J. L. B. Martin, M. F. Reid and J.-P. R. Wells, J. Alloys Compd., 2023, 937, 168394 CrossRef CAS.
- Y. Jin, Z. Zhou, R. Ran, S. Tan, Y. Liu, J. Zheng, G. Xiang, L. Ma and X.-J. Wang, Adv. Opt. Mater., 2022, 10, 2202049 CrossRef CAS.
- L. I. U. Chang, Z. Bi, H. A. O. Lüyuan and X. U. Xin, J. Rare Earths, 2014, 32, 691–695 CrossRef CAS.
- Y. Shen, W. Zhuang, Y. Liu, H. He and T. He, J. Rare Earths, 2010, 28, 289–291 CrossRef.
- H. Tian, T. Seto and Y. Wang, Small Methods, 2023, 7, 2300305 CrossRef CAS PubMed.
- A. M. Voiculescu, S. Hau, G. Stanciu and C. Gheorghe, J. Alloys Compd., 2023, 958, 170507 CrossRef CAS.
- C. Wang, R. Cui, J. Zhang, Y. Tai, T. Zhao, B. Zhang and C. Deng, Opt. Mater., 2023, 140, 113891 CrossRef CAS.
- Z. Yang, Y. Zhao, Y. Zhou, J. Qiao, Y.-C. Chuang, M. S. Molokeev and Z. Xia, Adv. Funct. Mater., 2022, 32, 2103927 CrossRef CAS.
- Y. Li, Y. Yin, T. Wang, J. Wu, J. Zhang, S. Yu, M. Zhang, L. Zhao and W. Wang, Dalton Trans., 2021, 50, 4159–4166 RSC.
- S. Huang, L. Yu, K. Peng, Y. Zhao, J. Wang and M. Shang, J. Am. Ceram. Soc., 2021, 104, 5848–5858 CrossRef CAS.
- H. Li, P. Wang, Y. Zhuo, X. Cao and D. Xiong, J. Am. Ceram. Soc., 2020, 103, 5056–5066 CrossRef CAS.
- H. Patnam, S. K. Hussain and J. S. Yu, J. Lumin., 2020, 223, 117204 CrossRef CAS.
- J. Li, B. Liu, G. Liu, Q. Che, Y. Lu and Z. Liu, J. Rare Earths, 2023, 41, 1689–1695 CrossRef CAS.
- C. He, T. Takeda, Z. Huang, J. Xu, J. Chen, W. Yi, R. Xie and N. Hirosaki, Chem. Eng. J., 2023, 455, 140932 CrossRef CAS.
- G. Li, X. Lu, Q. Mao, G. Du, M. Liu, L. Chu and J. Zhong, Mater. Today Chem., 2022, 23, 100744 CrossRef CAS.
| This journal is © The Royal Society of Chemistry 2024 |

