
Molecular weight dependence of structure and properties of chitosan oligomers†
Meng Tiana,
Hong Tanb,
Hao Lia and
Chao You*a
aDepartment of Neurosurgery, West China Hospital, Sichuan University, Chengdu, Sichuan 610041, PR China. E-mail: youchao@vip.126.com; tianmong007@gmail.com; Fax: +86 28 85422972; Tel: +86 28 85422972
bCollege of Polymer Science and Engineering, State Key Laboratory of Polymer Materials Engineering, Sichuan University, Chengdu, Sichuan 610065, PR China
First published on 7th August 2015
Abstract
In this work, chitosan oligomers (COS) with molecular weights decreasing continuously and covering the region of insoluble–soluble transition and with low polydispersity were prepared, and then the molecular weight (MW) dependence on the structure and properties were studied. FTIR, 1H and 13C NMR analyses showed that the prepared COS maintained the chemical structure of the initial chitosan and some signal shifts were observed resulting from the increase of the degree of acetylation. In contrast, it was found that the crystalline structure, thermal stability, and water solubility were significantly influenced by the MW, that is, with the decrease of the MW, the crystalline structure transformed from “L-2” to “tendon” and then to “annealed” polymorph, in which the MW corresponding to the conversion from “tendon” to “annealed” polymorph was 4.67 kDa. The thermal stability decreased with the reduction of the MW, while for the similar MW, the stability increased with the increase of the crystallinity. For water solubility, the MW ranging from 3.82 to 4.67 × 10³ kDa corresponded to the insoluble–soluble transition. A mechanism of water solubility dependence on MW was proposed.
Introduction
Chitosan oligomers (COS) are generally degradation products of chitosan with molecular weights below 5 kDa, and their chemical structure, like chitosan, is a linear binary copolymer consisting of β-1,4-linked 2-acetamido-2-deoxy-β-D-glucopyranose (GlcNAc) and 2-amino-2-deoxy-β-D-glucopyranose (GlcN).1 The great research interest on this oligomer results not only from their better water solubility and lower viscosity than the corresponding polymer, but also from their special biological activities such as antibacterial activity, antioxidant activity, biological recognition, and glucose control.2–5 Moreover, COS have been widely used as an important component in drug, gene, and cell delivery systems.6–12The structure and properties of COS were influenced by various factors, including molecular weight (MW), degree of N-acetylation (DA), and the distribution of the acetyl groups along the main chain.13,14 Among these factors, first and foremost, MW is critical as some important properties, e.g. solubility at neutral pH and biological activities, appear only when the MW decreases to some extent.15,16 Although the mechanisms underlying this phenomenon are not completely known, the changes of the structure have to be responsible for the causes. Thus, it is reasonable to investigate the effects of the MW on the structure and properties of COS, and therefore their relationship. In this regard, a few of studies have been carried out. However, it is difficult to find consistent results, and in most cases, the controversial evidences for a correlation between properties and MW were observed.17–23 For instance, Fernandes et al.23 reported that COS with MW < 5 kDa exhibited higher antibacterial activity than that with higher MW. This is similar to that results of Kulikov et al.17 who observed that COS with MW 3.58 and 4.22 kDa possess high antibacterial activity. In contrast, Qin et al.20 studied a series of COS and chitosan samples and their results showed that COS exhibited no significant antibacterial activity. The reasons can be attributed to two aspects. First, COS are usually a mixture of degradation products of chitosan, which are differed in polymerization degree, making it hard to find out the precise MW that corresponds to the property when they have a broad distribution of molecular weight. Second, besides MW, some other factors may affect the structure and properties as well. Nevertheless, these factors have not been taken into account. For example, in the case of water solubility, the water-dissolving at neutral pH has been demonstrated for chitosan with DA around 50%.13 Therefore, more information on the characteristics of the COS samples should be provided before study of the structure and properties. In particular, COS with low polydispersity or single degrees of polymerization are favored when considering the MW dependence.
In this work, COS with molecular weights decreasing continuously and covering the region of insoluble–soluble transition and with low polydispersity were prepared based on the kinetic studies of degradation chitosan with hydrogen peroxide and selective precipitation treatment, and then the MW dependence of the structure and properties of the COS were studied mainly focusing on the crystalline structure, thermal stability, and water solubility. Two water-insoluble products were also produced as comparison. The prepared COS were comprehensively characterized in order to provide sufficient information on the characteristics of the COS in addition of the MW. Furthermore, to explain the MW dependence of water solubility of the COS, a mechanism was proposed.
Experimental
Materials
Initial chitosan (CS0) with a MW of 300 kDa and a DA of 2.9% was purchased from Zhejiang Aoxing Biotechnology Co., Ltd (Zhejiang, China). Dextranum standards for gel permeation chromatography were supplied by National Institute for The Control of Pharmaceutical and Biological Products (China). All other chemicals were of analytical grade and were used without further purification.Degradation kinetics
Degradation kinetics as functions of temperature and time was studied by measuring the apparent viscosity of the reaction solution. In brief, CS0 (20 g) was dissolved in 800 mL 2% (w/v) acetic acid at 20 °C, and then the temperature was adjusted to 30, 50, and 70 °C in a water bath, respectively. The solution was stirred and reacted at each temperature after adding 30 mL 30% (v/v) hydrogen peroxide. For each reaction, aliquots of the reaction solution were collected at various time intervals and cooled in an ice-water bath to chill the reaction, and then the apparent viscosity was determined with a Brookfield viscosimeter at 20 °C. To monitor the time when CS0 was completely depolymerized to COS, 5 mL of the chilled solution at various time intervals was neutralized to pH 8.0 with concentrated sodium hydroxide to check if there is any precipitation. The depolymerization reaction was stopped when no precipitate was observed.Preparation of COS
20 g of CS0 was dissolved in 800 mL 2% (w/v) acetic acid at 20 °C, and then the temperature was adjusted to 70 °C in a water bath before 30 mL 30% (v/v) hydrogen peroxide was added. The resulting solution was stirred and reacted for 0.5, 1, and 2 hours, respectively. After the reaction, the solution was immersed in an ice-water bath to chill the reaction and neutralized to pH 8.0 with concentrated sodium hydroxide. The precipitate was separated by vacuum filtration and washed with distilled water until reaching pH 7.0, and then dried in a vacuum. The obtained product was the water-insoluble chitosan. The filtered solution was precipitated with final ethanol concentrations of 50, 75 and 87.5% (v/v). Each precipitate was centrifuged, washed with ethanol thoroughly to remove the residue hydrogen peroxide and then vacuum dried. The obtained product was COS. The yield of the product was calculated by the following eqn (1).
 | (1) |
Size-exclusion chromatography (SEC)
Weight average molecular weight, number average molecular weight and polydispersity index (PDI) of the products were determined by a SEC equipped with a Waters 515 HPLC pump, a Waters 2410 refractive index detector and a OHpak KB-803 HQ column operated at a flow rate of 0.7 mL min−1. Each sample with a volume of 10 μL (5 mg mL−1) was eluted with a solution of 0.5 M CH3COOH/0.5 M CH3COONa at 25 °C. Dextranum standards were used for column calibration and as a relative reference for molecular weight calculation. All data were collected and analyzed using Empower software.FTIR
Samples were ground with KBr powder and compressed into pellets for determination. FTIR spectra of the samples were recorded as % transmittance using a Nicolet 670 FTIR Spectrometer (USA).1H NMR
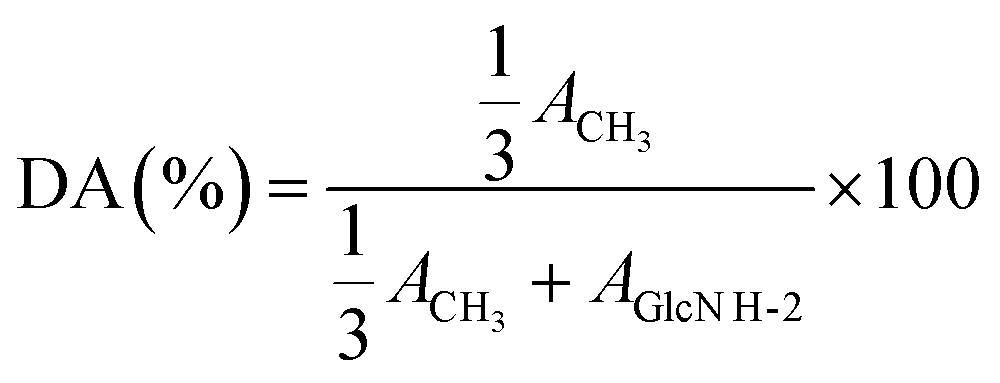
1H NMR analyses were recorded on a Bruker AV II-400 MHz spectrometer at 298 K. CS0, F1, F2, F3, and F5 were dissolved in a dilute acid solution of D2O (10 mg of samples for 1 mL of D2O and 5 μL of concentrated HCl (∼12 M)), while F4, F6, and F7 were dissolved in D2O (10 mg mL−1) alone.24 The DA was calculated by 1H NMR according to eqn (2), where “ACH3” and “AGlcN H-2” respectively correspond to the integral of the N-acetyl proton signal and H-2 proton signal of GlcN units.24
 | (2) |
13C NMR
13C NMR analyses were recorded on a Bruker AV II-400 MHz spectrometer at 298 K. The samples were dissolved in D2O in the presence of CF3COOD.X-ray diffraction
X-ray diffraction (XRD) measurements were carried out on an X'Pert Pro MPD X-ray diffractometer (Philips, Netherlands) and used a Cu Kα target at 40 kV and 40 mA at 25 °C.Thermal analysis
Thermogravimetric analysis (TG) and differential thermogravimetric analyses (DTG) of the samples were made using masses of about 6.5 mg, under nitrogen atmosphere from 35 °C to 600 °C, in a TGAQ 500 Thermogravimetric Analyzer (TA Instruments, USA). The experiments were run at a heating rate of 10 K min−1.Water solubility
The water solubility of the sample was evaluated by gross observation and turbidity assay. For gross observation, 0.1 g of sample was added into 10 mL of distilled water and stirred for 12 h. The resulting solution was centrifuged to check if the sample was dissolved. The dependence of the water solubility of the sample on pH was investigated by a turbidity assay in which the light transmittance was correlated with the water solubility. In brief, 0.2 g of sample was dissolved in 20 mL 1% acetic acid solution. By the stepwise addition of 0.1 mol L−1 NaOH, the light transmittance of the solution with different pH was measured in a spectrophotometer (Unico WFJ2100, China) with an optical path length of 1 cm at 600 nm.Results and discussion
Kinetic studies and preparation of COS
To prepare COS, the degradation kinetics was first studied by measuring the apparent viscosity of the reaction solution. Fig. 1A and S1A and B† show the apparent viscosities of reaction solutions at time t (ηt) normalized to initial viscosity (η0) as a function of reaction time at 70, 50, and 30 °C, respectively. All the curves exhibited similar tendency consisting of two steps. In Fig. 1A, the viscosity dropped sharply at the beginning of the 10 min, and then decreased slowly. This can be described by a double exponential decay function according to the following eqn (3).25
ηr = ηt/η0 = A![[thin space (1/6-em)]](https://www.rsc.org/images/entities/char_2009.gif) e−K1t + Be−K2t e−K1t + Be−K2t
| (3) |
 | ||
| Fig. 1 (A) The plot of normalized solution viscosity as a function of reaction time at 70 °C. Black squares were experimental points, and doted line was fitting curve. (B) The appearance of initial chitosan and obtained products, (a) CS0; (b) F1; (c) F2; (d) F3; (e) F4; (f) F5; (g) F6; (h) F7. | ||
Table S1† shows the values of A, B, K1, and K2 for the reaction at three different temperatures. The values of A and K1 were respectively greater than B and K2, indicating that the depolymerization of CS0 into intermediate molecules took place more rapidly at the initial step, and then further depolymerization into smaller molecular species was a slow process. The values also showed that the reaction temperature has a significant influence on the degradation process, which is consistent with the results of the reduction of viscosity. The ηr decreased to 10% after reaction of 51 min at 30 °C. In contrast, when the temperature increased to 50 and 70 °C, both ηr decreased to 10% within 5 min. The complete depolymerization of CS0 into COS was also significantly influenced by the reaction temperature, with 120, 13.3, and 2 hours at 30, 50, and 70 °C, respectively.
COS was prepared at 70 °C, since elevated temperature showed higher efficacy for depolymerization. The effect of reaction time on the preparation of COS was studied by performing the reaction on three time points (0.5, 1, and 2 hours). Finally, selective precipitation treatment was carried out to obtain COS with different molecular weight and low PDI. The appearance of the obtained products is shown in Fig. 1B, all of which are similar giving light-yellow powders. The structure parameters and the yields of the products are summarized in Table 1. As expected, COS with MW 1.72–4.67 kDa and PDI 1.4–1.5 were prepared, and the reduction of the MW with the reaction time was consistent with the kinetic studies. Compared to previous reports in which the PDI of COS was usually higher than 2,18,20 the PDI of COS in this work was 1.5 or lower, indicating that it would be beneficial to study the MW dependence. In addition, it can be seen that the COS were produced step by step with time prolonged according to the yields of the products. The two water-insoluble products F1 and F2 were also prepared as comparison.
| Sample | Reaction time (hour) | Ethanola (%) | MWb (× 103) | PDI | DA (%) | Crystallinity (%) | Water solubility | Yield (%) |
|---|---|---|---|---|---|---|---|---|
| a Selective precipitation treatment with different concentration of ethanol.b Weight average molecular weight. | ||||||||
| F1 | 0.5 | — | 5.52 | 1.8 | 3.2 | 50.9 | No | 71.5 |
| F2 | 1 | — | 5.18 | 1.8 | 3.6 | 51.5 | No | 23.3 |
| F3 | 1 | 50 | 4.67 | 1.5 | 4.3 | 49.9 | No | 25.3 |
| F4 | 1 | 75 | 2.43 | 1.4 | 10.1 | 23.5 | Yes | 10.5 |
| F5 | 2 | 50 | 3.82 | 1.4 | 5.8 | 35.0 | No | 18.4 |
| F6 | 2 | 75 | 2.75 | 1.5 | 7.5 | 11.9 | Yes | 30.0 |
| F7 | 2 | 87.5 | 1.72 | 1.4 | 15.7 | 6.2 | Yes | 8.4 |
FTIR
Fig. 2 shows the FTIR spectra of CS0 and the prepared products. The characteristic bands of CS0 can be assigned as follows.26 FTIR (KBr): 3300–3500 cm−1 (νN–H and νO–H), 2877 and 2920 cm−1 (νC–H), 1643 cm−1 (νC![[double bond, length as m-dash]](https://www.rsc.org/images/entities/char_e001.gif) O, amine I), 1602 cm−1 (δN–H, amine II), 1422 cm−1 (δCH2), 1381 cm−1 (νCH3), 1322 cm−1 (νC–N, amine III), 1260 cm−1 (δOH), 1155 cm−1 (νC–O–C), 1090 cm−1 (νC–O on C-3), 1031 cm−1 (νC–O on C-6), 897 cm−1 (special absorption band of β-1,4 glucoside bond).
O, amine I), 1602 cm−1 (δN–H, amine II), 1422 cm−1 (δCH2), 1381 cm−1 (νCH3), 1322 cm−1 (νC–N, amine III), 1260 cm−1 (δOH), 1155 cm−1 (νC–O–C), 1090 cm−1 (νC–O on C-3), 1031 cm−1 (νC–O on C-6), 897 cm−1 (special absorption band of β-1,4 glucoside bond).
 | ||
| Fig. 2 FTIR spectra of initial chitosan and obtained products. | ||
The spectra of the two water-insoluble products (F1 and F2) are exactly the same as that of CS0, and also the spectra of the COS F3–F7 exhibited most of the characteristic absorption bands of the CS0. The difference is that the amide I bands in the spectra of the COS were weakened. This phenomenon is similar to that reported by Wu et al., who also observed lack of clear amide I bands for COS prepared by enzymatic hydrolysis.27 Meanwhile, given that the amine II and III bands remains appeared in the all spectra of COS, it can conclude that the prepared COS maintained the chemical structure of the initial chitosan.
NMR
The 1H NMR spectra of the samples are shown in Fig. 3A and the calculated DA values are listed in Table 1. The spectra of F1, F2, F3, F5, and F6 are similar to that of CS0. The signals of H-1α protons of GlcNAc units were not clear due to these products with low DA.24 In the cases of F4 and F7, however, some differences were observed. The signals of H-1α protons of GlcN units, H-1 protons of the internal residues, and H-2 protons of GlcN units were shifted to highfield. This is similar to a report by Abla et al., who observed the same phenomenon when the DA increased from 0 to 25%.28 Moreover, the appearance of the signals of H-1α protons of GlcNAc units at around 5.13 ppm was observed for both F4 and F7. Thus, it is reasonable to conclude that the highfield shifts of these signals in the spectra of F4 and F7 were related with the increase of the DA that was probably caused by H-abstraction from the amino groups of GlcN units, resulting in the deamination. | ||
| Fig. 3 (A) 1H NMR spectra of initial chitosan and obtained products. (B) 13C NMR spectra of initial chitosan and obtained products. | ||
To further study the structure of the products, 13C NMR measurements were performed and the spectra are shown in Fig. 3B. The spectra of F1, F2, F3, and F5 are almost the same as that of CS0. In contrast, there are two differences in the spectra of F4, F6, and F7. First, there were more signals appeared in the C-3 and C-4 regions. These signals are more like the splitting of the C-3 and C4 signals due to the change of surroundings when MW of COS decreased.29 Second, the signals of the C-1, C-2, C-3, and C-4 were shifted to the downfield while the ones of the C-5 and C-6 were not changed significantly. The downfield shifts were predominant in C-1 carbons which participate in the β-1,4-glycosidic linkage. It has been reported that 13C chemical shifts of carbons at the glycosidic linkage are sensitive to conformational change.29,30 When COS was dissolved in aqueous solution, it would take different conformation depending on its DA. This conformation-chemical shift relationship appears to be applicable to our results. Thus, it was assumed that the downfield shifts were related with the increase of the DA in F4, F6 and F7.
XRD
The crystalline structure and crystallinity of the products were investigated by XRD. As shown in Fig. 4, the spectrum of CS0 exhibited two main peaks at 2θ = 10.4 and 19.8°, which coincided with the pattern of the “L-2” polymorph.31 The two water-insoluble products F1 and F2 showed three characteristic peaks at 2θ = 10.4, 19.8 and 22.0° in their spectra, which corresponded to the pattern of the “tendon” hydrated polymorph.32 F3, F4, F5, and F6 exhibited three main peaks at 2θ = 15.2, 21.1 and 23.8°, which is referred to as the “annealed” anhydrous polymorph.33 Finally, F7 displayed a characteristic peak at 15.2° and a very weak peak at 21.1°, indicating that this fraction tends to amorphous. | ||
| Fig. 4 XRD patterns of initial chitosan and obtained products. | ||
The difference in the crystalline structure is derived from the packing mode for chitosan molecules in unit cells, and also the number of water molecules in the cells plays an important role. The “annealed” polymorph is in an anhydrous form, whereas the others are in a hydrated form. For high molecular weight chitosan, the conversion from the “tendon” to “annealed” polymorph was observed when heating its aqueous suspension, and the extent of the conversion depended both on the MW and on the DA, that is, the chitosan with a relatively low MW or low DA can be transformed more easily.34 In this study, the crystalline transition was also observed when the MW was decreased. Moreover, thanks to the selective precipitation treatment, the MW of the obtained fractions decreased continuously and with low PDI, which makes it possible to determine the relationship between the MW and the crystalline transition. Our results showed the MW corresponding to the conversion from “tendon” to “annealed” polymorph was 4.67 kDa. In addition, it should be noted that there was a weak peak at 2θ = 19.8° remaining in F3 and F5, whereas it disappeared in F4, indicating that the MW corresponding to the complete conversion appeared to be 2.43 kDa.
The crystallinity was in the order F2 > F1 > F3 > F5 > CS0 > F4 > F6 > F7. Here, observation of a higher crystallinity of F2, F1, F3, and F5 compare to CS0 might be due to: (i) the initial depolymerization was preferentially occurred in the amorphous parts;35 (ii) the recrystallization of the short chain.36
Thermal analysis
The TG and DTG curves for the samples are shown in Fig. S2A and B† and the results are summarized in Table 2. CS0 showed two stages of weight loss as previous report.37 The first one occurred in the range of 40–150 °C, and reached a DTG maximum (Tmax) at 70 °C, which was mainly attributed to the loss of water. The second one started at around 205 °C and reached a maximum at 299 °C, which was assigned to the disintegration of the intra- and inter-molecular interactions and the breakage of the main chains. In comparison with CS0, all products also exhibited two stages of weight loss. However, the mainly difference was the decrease of the start temperature and Tmax in the second stage, indicating that the thermal stability was decreased. The thermal stability for all samples was in the order CS0 > F1 > F2 > F3 > F5 > F4 > F6 > F7.| Sample | First stage | Second stage | Weight loss (%) at 600 °C | ||
|---|---|---|---|---|---|
| Tmax (°C) | Weight loss (%) | Tmax (°C) | Weight loss (%) | ||
| CS0 | 70 | 7.0 | 299 | 49.6 | 63.6 |
| F1 | 73 | 10.6 | 293 | 62.3 | 71.9 |
| F2 | 73 | 9.0 | 285 | 56.0 | 65.1 |
| F3 | 69 | 8.3 | 272 | 58.1 | 67.6 |
| F4 | 76 | 6.1 | 257 | 58.2 | 65.4 |
| F5 | 76 | 7.8 | 264 | 55.3 | 68.8 |
| F6 | 78 | 7.8 | 255 | 53.8 | 65.0 |
| F7 | 73 | 8.1 | 236 | 62.1 | 67.8 |
The thermal stability of chitosan is related to its molecular weight and structure such as crystalline.38 CS0 has the highest thermal stability because of its much higher molecular weight than the prepared products. The thermal stability of the prepared products also decreased with the reduction of the molecular weight, except for that of F4 and F6. Although the molecular weight of F4 was slightly lower than that of F6, F4 exhibited higher thermal stability than that of F6, which may be result from their difference in structure as the crystallinity of F4 was more than two times higher than that of F6. Thus, it was assumed that the thermal stability decreases with the reduction of the molecular weight, while for the similar molecular weight, the stability increases with the increase of the crystallinity.
Water solubility
The water solubility of the products was evaluated by gross observation at first, and the results are listed in Table 1. There is no change of solubility for F1, F2, F4, F6, and F7. Interestingly, however, it was found that F3 and F5 could no longer be dissolved in water. This is inconsistent with the preparation process, in which both F3 and F5 were soluble in water. The change of the solubility for F3 and F5 indicated that the interaction between the COS molecular chains was stronger than that of COS–water pair. Chitosan has a flexible, hydrophilic helical structure with a lot of hydroxyl and amine groups, which offers a multitude of possible inter- and intra-molecular interactions. Furthermore, the hydrogen bonds play an important role in forming the crystalline domains in the solid state, and appear to provide the main factor limiting its water solubility.The water solubility of the products was also evaluated by a turbidity assay. As shown in Fig. 5A, in the cases of CS0, F1, and F2, the transmittances suddenly dropped to below 20% and the precipitations occurred when the pH values of the solutions respectively adjusted to 6.7, 7.0, and 7.2, whereas in the cases of F4, F6, and F7, there were no significant decrease in transmittance, and the solutions remained transparent without any precipitation even when the pH values adjusted to 10.0. For F3 and F5, however, the situation was more complicated, where the transmittance depended not only on the pH but also on the duration (Fig. 5B and C), indicating that the solution was thermodynamic instable. F3 was stable until the pH increased to 7.5 when the transmittance began to decrease after 5 hours. Similarly, the decrease of transmittance for F5 occurred when the solution was allowed to adjust to pH 8.0 and stand for 5 hours. From the above results, it can be seen that, with the decrease of the molecular weight, the pH for turbidity shifted from 6.7 to 8.0, indicating that the solubility was improved, which was coincide with the gross observation.
 | ||
| Fig. 5 (A) The pH dependence of water solubility of CS0, F1, F2, F4, F6, and F7. (B) The pH and time dependences of water solubility of F3. (C) The pH and time dependences of water solubility of F5. (D) Schematic illustration of water solubility of chitosan with different MW. | ||
COS are known for their better water solubility in comparison with the corresponding polymers. Nevertheless, its MW dependence has not been studied in depth and there are few reports on the identification of the precise MW governing the insoluble–soluble transition. In fact, the solubility of chitosan was influenced by the DA, the pH, the distribution of the acetyl groups along the main chain as well as the preparation process in addition of its MW, and therefore it is a very difficult parameter to control.13 Here, a series of chitosan with molecular weights covering the region of insoluble–soluble transition were prepared, and the DA of these products was in the range of 0–16% which excluded the different influence of DA on the solubility.39,40 All these characteristics permit the study of the MW dependence of the solubility. Indeed, both gross observation and turbidity assay showed the similar results. For illustrative purposes, the dependence is shown schematically in Fig. 5D, from which it can be seen that the MW ranging from 3.82–4.67 × 10³ may correspond to the insoluble–soluble transition.
Mechanism discussion
Although it has been accepted that the solubility of chitosan increases with the decrease of its MW, there is no clear idea about the reasons to explain this phenomenon. Here, a mechanism was proposed as follows based on literature and our results.Normally, there is a diversity of forces associated with chitosan solubility at a molecular level such as hydrogen bonding, hydrophobic interactions, and van der Waals forces, in which hydrogen-bond interactions (Fig. 6A) appear to be dominant when chitosan has a low DA and is soluble in dilute acid because of the protonation of the amino group, resulting in forming electrostatic repulsion and disruption of hydrogen bonds, e.g., intra- and inter-molecular hydrogen-bond between OH6 and N2, and also the charged amino group seems to increase water exchange in the region of the O3 atom destabilizing the intra-molecular hydrogen-bond between HO3 and O5, which is responsible for the length of the chain repeating distance and to keep the molecular chain in a 2-fold helical pattern.41 As a result, the solubility of chitosan is strongly affected by the pH in the solution, since it defines the degree of charged units in polymer chains. For example, most of amino groups along the molecular chains would be protonated at pH 3.0, wherein chitosan prefers to take up a relaxed 2-fold helix structure which does not form strong hydrogen-bond networks, whereas the degree of protonated amino groups decreases at higher pH, in which hydrogen-bond interactions would be enhanced and the 2-fold helix structure becomes the most representative configuration. Finally, a precipitation occurs around pH between 6 and 6.5.14
 | ||
| Fig. 6 (A) Hydrogen bonds in the molecular structure of chitosan. (B) Schematic illustration of a mechanism of solubility dependence on MW. | ||
During the process of soluble–insoluble transition induced by pH changes in the solution, chitosan molecular chains form aggregates spontaneously before phase separation and precipitation occurrence. The formation of aggregates is believed to relate to hydrogen-bond and hydrophobic interactions, in which hydrogen-bond interactions are predominant because the aggregation was observed even for the chitosan that does not contain GlcNAc unites at all.42 Moreover, the formation of crystallites during the aggregation has been suggested because the aggregates can be preserved in the presence of urea, which is known to weaken hydrophobic interactions and to destroy hydrogen bonds.42 Thus, the aggregation together with crystallization may play a role of precursors of the transition responsible for phase separation and precipitation. According to above discussion, the soluble–insoluble transition process of the high molecular weight chitosan such as CS0 was proposed and shown schematically in Fig. 6B. However, when the MW of chitosan is decreased, the situation changes, that is, the tendency toward aggregation is decreased,43 because, on one hand, the formation of aggregates is a process of losses of entropy, the shorter the molecular chains, the higher the losses of entropy, and on the other hand, the hydrogen-bond interactions are reduced due to the decrease of the number of associating groups such as amino groups within a short molecular chains. Consequently, the soluble–insoluble transition takes place at a higher pH at which the hydrogen-bond interactions are enhanced that can be as a driving force for aggregation (Fig. 6B), which is in agreement with our results that the pH shift up to 8.0 for F5. When the MW of chitosan is further decreased, the aggregates could no longer be formed even when all amino groups are practically uncharged, indicating that the chitosan is completely water-soluble in this case.
Conclusions
In summary, COS with molecular weights decreasing continuously and covering the region of insoluble–soluble transition and with low PDI were prepared and the MW dependence of the structure and properties were studied. It was found that the crystalline structure, thermal stability and water solubility of the prepared COS were significantly influenced by the MW and their relationship was investigated. With the decrease of the MW, the crystalline structure transformed from “L-2” to “tendon” and then to “annealed” polymorph. The MW corresponding to the conversion from “tendon” to “annealed” polymorph was 4.67 kDa. The thermal stability decreased with the reduction of the MW, while for the similar MW, the stability increased with the increase of the crystallinity. For water solubility, the MW ranging from 3.82 to 4.67 × 10³ kDa corresponded to the insoluble–soluble transition. Moreover, a mechanism of water solubility dependence on MW was proposed.Acknowledgements
This work is supported by National Natural Science Foundation of China (No. 81401528 and 51273126), National Key Technology R&D Program for the 12th Five-year Plan of China (No. 2011BAI08B05), China National Funds for Distinguished Young Scientists (No. 51425305), Sichuan Province Science and Technology Support Program (No. 2015SZ0147 and 2014SZ0043), and Funds of West China Hospital of Sichuan University (No. 171140322).Notes and references
- L. Hu, Y. Sun and Y. Wu, Nanoscale, 2013, 5, 3103–3111 RSC.
- Y. Lu, D. L. Slomberg and M. H. Schoenfisch, Biomaterials, 2014, 35, 1716–1724 CrossRef CAS PubMed.
- Y. Zhai, K. Zhou, Y. Xue, F. Qin, L. Yang and X. Yao, RSC Adv., 2013, 3, 6833–6838 RSC.
- V. Wittmann and R. J. Pieters, Chem. Soc. Rev., 2013, 42, 4492–4503 RSC.
- H. J. Kim, H. Y. Ahn, J. H. Kwak, D. Y. Shin, Y.-I. Kwon, C.-G. Oh and J. H. Lee, Food Funct., 2014, 5, 2662–2669 CAS.
- M. Tian, B. Han, H. Tan and C. You, Carbohydr. Polym., 2014, 112, 502–511 CrossRef CAS PubMed.
- L. Jia, Z. Li, D. Zhang, Q. Zhang, J. Shen, H. Guo, X. Tian, G. Liu, D. Zheng and L. Qi, Polym. Chem., 2013, 4, 156–165 RSC.
- P. Shan, J.-W. Shen, D.-H. Xu, L.-Y. Shi, J. Gao, Y.-W. Lan, Q. Wang and X.-H. Wei, RSC Adv., 2014, 4, 23730–23739 RSC.
- Y. Tao, J. Han and H. Dou, J. Mater. Chem., 2012, 22, 8930–8937 RSC.
- X. Liu, H. Huang, G. Liu, W. Zhou, Y. Chen, Q. Jin and J. Ji, Nanoscale, 2013, 5, 3982–3991 RSC.
- L. Du, Y. Gao, H. Yang, Y. Li, Q. Zhuang, H. Jia, G. Nie and Y. Liu, RSC Adv., 2013, 3, 14791–14797 RSC.
- Q. Yang, C. He, Y. Xu, B. Liu, Z. Shao, Z. Zhu, Y. Hou, B. Gong and Y.-M. Shen, Polym. Chem., 2015, 6, 1454–1464 RSC.
- M. Rinaudo, Prog. Polym. Sci., 2006, 31, 603–632 CrossRef CAS.
- M. Dash, F. Chiellini, R. M. Ottenbrite and E. Chiellini, Prog. Polym. Sci., 2011, 36, 981–1014 CrossRef CAS.
- N. Kubota and Y. Eguchi, Polym. J., 1979, 29, 123–127 CrossRef.
- M. Mengíbr, I. Mateos-Aparicio, B. Miralles and Á. Heras, Carbohydr. Polym., 2013, 97, 776–782 CrossRef PubMed.
- S. Kulikov, V. Tikhonov, I. Blagodatskikh, E. Bezrodnykh, S. Lopatin, R. Khairullin, Y. Philippova and S. Abramchuk, Carbohydr. Polym., 2012, 87, 545–550 CrossRef CAS.
- J. Li, Y. Du, J. Yang, T. Feng, A. Li and P. CHen, Polym. Degrad. Stab., 2005, 87, 441–448 CrossRef CAS.
- J. Huang, D. Zhao, S. Hu, J. Mao and L. Mei, Carbohydr. Polym., 2012, 87, 2231–2236 CrossRef CAS.
- C. Qin, H. Li, Q. Xiao, Y. Liu, J. Zhu and Y. Du, Carbohydr. Polym., 2006, 63, 367–374 CrossRef CAS.
- S. Lin, Y. Lin and H. Chen, Food Chem., 2009, 116, 47–53 CrossRef CAS.
- S. Wu, S. Pan, H. Wang and J. Wu, Int. J. Biol. Macromol., 2013, 62, 348–351 CrossRef CAS PubMed.
- J. C. Fernandes, F. K. Tavaris, J. C. Soares, O. S. Ramos, M. J. Monteiro, M. E. Pintado and F. X. Malcata, Food Microbiol., 2008, 25, 922–928 CrossRef CAS PubMed.
- S. Trombotto, C. Ladavière, F. Delolme and A. Domard, Biomacromolecules, 2008, 9, 1731–1738 CrossRef CAS PubMed.
- M. R. Kasaai, J. Arul and G. Charlet, Ultrason. Sonochem., 2008, 15, 1001–1008 CrossRef CAS PubMed.
- J. Brugnerotto, J. Lizardi, F. M. Goycoolea, W. Arguelles-Monal, J. DesbrieÁres and M. Rinaudo, Polymer, 2001, 42, 3569–3580 CrossRef CAS.
- Y. Wu, Q. L. Lin, Z. X. Chen, W. Wu and H. X. Xiao, J. Food Sci. Technol., 2012, 49, 695–703 CrossRef CAS PubMed.
- M. Abla, L. Marmuse, F. Delolme, J. P. Vors, C. Ladavière and S. Trombotto, Carbohydr. Polym., 2013, 98, 770–777 CrossRef CAS PubMed.
- H. Saito, T. Mamizuka, R. Tabeta and S. Hirano, Chem. Lett., 1981, 10, 1483–1484 CrossRef.
- T. Fukamizo, A. Ohtakara, M. Mitsutomi and S. Goto, Agric. Biol. Chem., 1991, 55, 2653–2655 CrossRef CAS PubMed.
- H. Saito and R. Tabeta, Macromolecules, 1987, 20, 2424–2430 CrossRef CAS.
- E. Belamie, A. Domard and M. M. Giraud-Guille, J. Polym. Sci., Polym. Chem. Ed., 1997, 35, 3181–3191 CrossRef CAS.
- K. Ogawa, S. Hirano, T. Miyanishi, T. Yui and T. Watanabe, Macromolecules, 1984, 17, 975–977 CrossRef.
- K. Ogawa, Agric. Biol. Chem., 1991, 55, 2375–2379 CrossRef CAS.
- F. Tian, Y. Liu, K. A. Hu and B. Y. Zhao, Carbohydr. Polym., 2004, 57, 31–37 CrossRef CAS.
- M. Tian, F. Chen, D. Ren, X. Yu, X. Zhang, R. Zhong and C. Wan, Carbohydr. Polym., 2010, 112, 502–511 CrossRef PubMed.
- F. Chen, M. Tian, D. Zhang, J. Wang, Q. Wang, X. Yu, X. Zhang and C. Wan, Mater. Sci. Eng., C, 2012, 32, 310–320 CrossRef CAS.
- W. Tang, C. Wang and D. Chen, Polym. Degrad. Stab., 2005, 87, 389–394 CrossRef CAS.
- S. Skovstrup, S. G. Hansen, T. Skrydstrup and B. Schiøtt, Biomacromolecules, 2010, 11, 3196–3207 CrossRef CAS PubMed.
- X. Sun, Q. Tian, Z. Xue, Y. Zhang and T. Mu, RSC Adv., 2014, 4, 30282–30291 RSC.
- E. F. Franca, R. D. Lins, L. C. G. Freitas and T. P. Straatsma, J. Chem. Theory Comput., 2008, 4, 2141–2149 CrossRef CAS.
- O. E. Philippova, E. V. Korchagina, E. V. Volkov, V. A. Smirnov, A. R. Khokhlov and M. Rinaudo, Carbohydr. Polym., 2012, 87, 687–694 CrossRef CAS.
- O. E. Philippova and E. V. Korchagina, Polym. Sci., Ser. A, 2012, 54, 552–572 CrossRef CAS.
Footnote |
| † Electronic supplementary information (ESI) available. See DOI: 10.1039/c5ra08358c |
| This journal is © The Royal Society of Chemistry 2015 |