Development and cell imaging applications of a novel fluorescent probe for Cu2+

Yue-Hua Yuan, Mao-Zhong Tian*, Jun-Ling Wang, Hai Xie, Jun Qin and Feng Feng*
College of Chemistry and Environmental Engineering, Shanxi Datong University, Datong 037009, P. R. China. E-mail: tmzhong2002@163.com; feng-feng64@263.net; Fax: +86 352 6100028; Tel: +86 352 6100028

Received 17th June 2015 , Accepted 10th August 2015

First published on 11th August 2015


Abstract

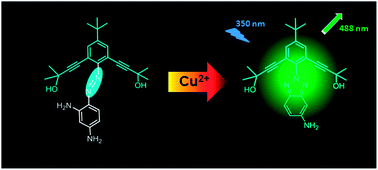
A reactivity-based fluorescent probe 1 for Cu2+ was synthesized. The structure of this probe was characterized by infrared spectroscopy (IR), mass spectrometry (MS), X-ray crystallography, and 1H NMR and 13C NMR spectroscopy. Its photophysical as well as binding properties towards various metal ions were studied. Probe 1 showed highly sensitive and selective “Off-On” fluorescence changes with Cu2+ among various metal ions when excited at 350 nm. These selective changes were attributed to an oxidative cyclization reaction transforming nonemissive azoanilines into highly fluorescent benzotriazoles. Furthermore, fluorescence imaging experiments of Cu2+ ions in living cells demonstrated its value of practical applications in biological systems.

Introduction

The design and synthesis of mulitifunctionalized organic molecules with controlled properties on the molecular level remains a critical important target of chemistry, materials science and biology.1–3 The development of fluorescent probes for various metal ions has received considerable attention due to their biological and environment important roles.4 Among the various metal ions, copper ion has attracted a great deal of attention ascribing to its biological significance as a catalytic cofactor for a variety of metalloenzymes, including superoxide dismutase, cytochrome coxidase, and tyrosinase. However, under overloading conditions, copper ions exhibit toxicity in that it causes neurodegenerative diseases (e.g., Alzheimer's and Wilson's diseases) probably by its involvement in the production of reactive oxygen species.5–9 Therefore, developing various techniques to monitor the concentration of Cu2+ in environmental water samples and visualize its cellular distribution in physiological processes has great significance for environment protection and human health.

Unlike other analytical techniques,10–12 fluorescent probes for the determination of Cu2+ have had great popularity owing to the apparent advantages: sensitivity, specificity, simplicity, low cost, and rapid tracking of analytes in biological and environmental samples.13–26 Nevertheless, the studies on fluorescent probes for detecting Cu2+ in aqueous solution have been so far scarce. On the one hand, the paramagnetic nature of Cu2+ always leads to an unavoidable fluorescence quenching effect;27 on the other hand, due to the strong hydration ability of Cu2+ in water, high content of organic components are necessary for most fluorescent probes to exhibit satisfying analytical performances. Thus, the developing of novel “turn-on” fluorescent Cu2+ probes in aqueous solution is still a challenge. One alternative strategy of detecting Cu2+ is attributed to irreversible chemical reactions promoted by Cu2+. In most cases, nonemissive probe molecules are converted to the emissive ones. Some probes for Cu2+ have been reported based on irreversible chemical reactions.28–36 Many of these probes, however, suffer from some drawbacks: (1) they could not act in pure aqueous solvent; (2) they require specific reaction conditions such as acidic or basic pH media; and (3) they show cross-sensitivity toward other metal cations.

The azo derivative 1 has been designed and utilized to direct detection of Hg2+ in aqueous solution and living cells.37 This study follows this mechanism whereby the detection of Hg2+ ion was based on the chelation enhanced fluorescence (chemosensor, λex = 430 nm); however, the recognition of Cu2+ ion was based on the irreversible chemical reactions promoted by Cu2+ (chemodosimeter, λex = 350 nm). To the best of our knowledge, incorporating both a chemosensor and a chemodosimeter onto this single molecular system for Hg2+ and Cu2+ ions has never been reported. The large fluorescence enhancement can be attributed to a rapid cyclization reaction triggered by Cu2+ ion in water. The fluorescence enhancement was so efficient that a large blue shift of 37 nm is observed for Cu2+ only. Furthermore, this probe was successfully applied to image Cu2+ in living cells. Lee and coworkers reported the analogous fluorescent probe for Cu2+.38

Experimental section

Apparatus and materials

All the materials were obtained from commercial suppliers and were used without further purification. The solutions of metal ions were prepared from their nitrate salts except for Hg(ClO4)2·3H2O. Flash chromatography was carried out on silica gel SG1105 (200–300 mesh; Qingdao Makall). 1H-NMR and 13C-NMR spectra were recorded at 400 MHz and 100 MHz, respectively. Chemical shifts (δ) were expressed in ppm relative to TMS and coupling constants (J) are in Hz. Matrix-assisted laser desorption/ionization reflectron time-of-flight (MALDI-TOF) mass spectrometry was performed with a BrukerBiflex III mass spectrometer. Elemental analyses were carried out with a Carlo Erba 1106 elemental analyzer. Fluorescence excitation and emission spectra were recorded by using a JASCO FP6600 spectrophotometer in a quartzcell. UV-vis absorption spectra were measured on a JASCO V-579 spectrophotometer in a quartz cell. The cells were imaged by fluorescence microscopy (Olympus 1X71). The crystal data collection of 1 was performed on a CrysAlisPro diffractometer.

Synthesis of probe 1

To a stirred MeOH solution (5 mL) of 2,6-bis(3-methyl-3-hydroxyl-1-butynyl)-4-tert-butylaniline (0.313 g, 1 mmol) was added slowly conc. HCl (2.5 mL). The reaction mixture was kept at 0°. An aqueous solution (1 mL) of NaNO2 (75.9 mg, 1.1 mmol) was added dropwise to generate the azonium intermediate, and the reaction mixture was stirred for 10 min. A solution of m-phenylenediamine (0.130 g, 1.2 mmol) and sodium hydroxide (0.150 g) in MeOH–H2O (2[thin space (1/6-em)]:[thin space (1/6-em)]1, v/v; 9 mL) was kept at 0 °C. With stirring, the azonium intermediate was added dropwise to the m-phenylenediamine solution while maintaining the temperature of the reaction at 0 °C. After stirring for 30 min, water (50 mL) was added to induce precipitation of a red solid, which was isolated by filtration and washed thoroughly with water, and dried. Flash column chromatography on SiO2 (hexane[thin space (1/6-em)]:[thin space (1/6-em)]EtOAc = 2[thin space (1/6-em)]:[thin space (1/6-em)]1, v/v) furnished compound 1 (391.5 mg, 0.906 mmol, yield = 91%).1H NMR (400 MHz, DMSO-d6, 298 K): δ 7.40, 7.38 (d, J = 8.8 Hz, 1H), 7.35 (s, 2H), 5.99 (m, 3H), 5.86 (d, J = 2.0 Hz, 1H), 5.34 (s, 2H), 1.41 (s, 12H), 1.28 (s, 9H). 13C NMR (100 MHz, CD3OD, 298 K) δ 154.88, 154.73, 150.31, 147.21, 133.93, 132.11, 131.84, 117.08, 107.40, 99.10, 98.42, 81.47, 66.16, 35.34, 31.86, 31.58. FT-IR (thin film on KCl, cm−1): 3548, 3465, 3368, 2970, 2935, 2869, 1630, 1584, 1546, 1502, 1476, 1448, 1400, 1374, 1329, 1280, 1250, 1185, 1158, 1141, 945, 886, 820, 652, 579, 567, 452. MALDI-TOF calcd for C26H32N4O2 [M + H+]+ 433.25; found 433.17. Anal. calcd for C26H32N4O2: C, 72.19; H, 7.46; N, 12.95. Found: C, 72.27; H, 7.46; N, 12.99.

General methods for absorption and fluorescence studies

All spectroscopic measurements were performed in HEPES buffer solution (5.0 × 10⁻² mol L−1, pH = 7.4). Stock solutions (5.0 × 10⁻² mol L−1) of metal ions (metal nitrate, perchlorate for Hg2+) were prepared in two-distilled water. The stock solution (1.0 × 10⁻² mol L−1) of probe 1 was prepared in DMSO. In titration experiments, each time a 3 × 10⁻³ L aqueous solution of 1 (1.0 × 10⁻² mol L−1) was filled in a quartz optical cell of 1 cm optical path length. Then various amount of Cu2+ stock solution was added into the quartz optical cell gradually by using a micro-pipette. Spectral data were recorded at 30 min after the addition. In selectivity experiment, the test samples were prepared by placing appropriate amounts of metal ion stock solution into 3 × 10⁻³ L aqueous solution of 1 (1.0 × 10⁻² mol L−1). For all measurements, excitation wavelength was at 350 nm, excitation and emission slit widths were 3 nm and 6 nm, respectively.

Determination of fluorescence quantum yields

The fluorescence efficiency of the probe was estimated by measuring their fluorescence quantum yield using eqn (1) on the basis of the absorption and fluorescence spectra taken in the solvent. Coumarin 30 (Φ = 0.67 in MeCN solution, λexc = 380 nm) was used as a standard.39 The sample absorbance was maintained <0.1 to minimize internal absorption. Corrections were made to account for the differences in solvent refractive indexes.
 
image file: c5ra11589b-t1.tif(1)
where Φst the emission quantum yield of the standard, λst and λu represent the absorbance of the standard and sample at the excited wavelength, respectively, while Sst and Su are the integrated emission band areas of the standard and sample, respectively, and nDst and nDu are the solvent refractive index of the standard and sample, u and st refer the unknown and standard, respectively.

Cell lines and cell culture

HT-29 cell lines was purchased from cell culture center of Institute of Basic Medical Sciences, CAMS and cultured in Dulbecco's Modified Eagle's Medium, High Glucose (DMEM)/Ham's F12 (vol/vol = 1[thin space (1/6-em)]:[thin space (1/6-em)]1) supplemented with 5% fetal calf serum. HT-29 cells were routinely cultured in DMEM (high glucose)/Ham's F12 medium containing 10% serum and harvested for subculture using trypsin (0.05%, Gibco/Invitrogen) and grown in a humidified atmosphere containing 5% CO2 and 95% air at 37 °C. Before experiment, the cells were pre-cultured.

Results and discussion

As shown in Scheme 1, 2,6-dibromo-4-(tert-butyl)aniline 3 was prepared by the treatment of p-tert-butylaniline with bromine following the reported procedures.37 Compound 3 was then reacted with 2-methylbut-3-yn-2-ol under Sonogashira conditions to give 2,6-bis(3-methyl-3-hydroxyl-1-butynyl)-4-tert-butylaniline 2. Efficient azo coupling reaction between 2 and m-phenylenediamine afforded probe 1 in high yield. The structure of 1 was fully characterized by IR, 1H NMR, 13C NMR, MALDI-TOF mass spectroscopy and X-ray crystallography (see ESI). A single crystal of 1 was grown in EtOAc/hexane mixture solution. Several single crystals were obtained by the solvent partially evaporated and subjected to crystallographic structure analysis. X-ray crystallography investigation confirmed that the two benzene rings are twisted by a dihedral angle of 21.41°.
image file: c5ra11589b-s1.tif
Scheme 1 Synthesis of 1 (right, crystal structure of 1).

To obtain insight into the fluorescent properties of probe 1 toward metal ions as well as anions, fluorescence emission changes were studied for different metal ions (Fig. 1) and anions (Fig. S1), such as Li+, Na+, K+, Mg2+, Ca2+, Ba2+, Mn2+, Cd2+, Cr3+, Co2+, Ni2+, Ag+, Pb2+, Zn2+, Fe3+, Hg2+, Cu2+, ClO4, CO32−, SO42−, F, Cl, Br, H2PO4, P2O74−, Ac in 100% aqueous solution. With an excitation wavelength at 350 nm, probe 1 (10 μM) showed a very weak emission peak at 525 nm, and the addition of Cu2+ or Hg2+ induced the fluorescence enhancement of 1, whereas no obvious variations were observed upon the addition of the above-mentioned other metal ions and anions. Only the addition of Cu2+ to the solution of 1 resulted in a clear hypsochromic shift of the fluorescence maximum of about 37 nm from 525 to 488 nm. Moreover, in the presence of miscellaneous competitive cations, the emission spectra of 1 displayed a similar pattern at near 488 nm to that with Cu2+ ions only, whereas Hg2+ prominently enhanced the fluorescence. Reversely, upon the addition of Fe3+ ions to the mixture of 1 and Cu2+ ions, the emission band at 488 nm was partly decreased (Fig. S2). These results clearly indicated that the probe 1 was highly specific for Cu2+ ions over other competitive cations in aqueous medium.


image file: c5ra11589b-f1.tif
Fig. 1 Fluorescent emission spectra of 1 (10 μM) upon addition of different metal ions (5.0 equivalents) in HEPES buffer (50 mM, containing 0.1 M KNO3, pH = 7.4) solution. λex = 350 nm.

As shown in Fig. S3, free 1 exhibited an absorption band centered at 436 nm. When titrated by Cu2+ (0–30 μM), this band was gradually increased, and then decreased slightly and a new peak at 466 nm appeared simultaneously (red shift), indicating new species formed. The fluorescence titration of 1 toward Cu2+ was shown in Fig. 2a. Probe 1 showed a weak band with emission maxima at 525 nm upon excitation at 350 nm (Φ = 0.008). However, large fluorescent enhancements (131 fold, Φ = 0.313) were observed upon addition of Cu2+ to the solution of 1. Notably, Cu2+ induced a blue-shift in the emission of 1 to 488 nm, while Hg2+ hardly caused shift in the emission of 1. This difference in response allows 1 to easily distinguish between Cu2+ and Hg2+ in aqueous solution. A plot of I488 nm vs. Cu2+ concentration (Fig. 2b) shows an excellent linear relationship (linearly dependent coefficient: R2 = 0.9947) down to the value of [Cu2+] = 10 μM, which is comparable to the U.S. Environmental Protection Agency (EPA) guideline of 1.3 ppm (= 21 μM) Cu2+ in drinking water. A Job's plot indicates that the 1[thin space (1/6-em)]:[thin space (1/6-em)]1 stoichiometry of a binding event between 1 and Cu2+ (inset of Fig. 2a).


image file: c5ra11589b-f2.tif
Fig. 2 (a) Emission spectra of 1 (10 μM) in the presence of Cu2+ (0, 3, 5, 7, 10, 15, 20, 25, 30, 40, 50, 60, 80, 100, 120 μM). Inset: Job's plot of 1. (b) A plot of fluorescence intensity at λem = 488 nm of 1 (10 μM) vs. concentration of Cu2+ in HEPES (50 mM) solution (0.1 M KNO3, pH = 7.4). λex = 350 nm. Excitation and emission slit widths were 3 and 6 nm, respectively.

The binding interaction of 1 with Cu2+ was investigated. 1 is a nonfluorescent compound. Upon the addition of Cu2+, a bright fluorescence developed simultaneously. The above resulting solution was subsequently treated with excess EDTA, and the strong fluorescence of the 1-Cu2+ was almost not affected upon addition of EDTA to the mixture of 1 and Cu2+ ions, indicating that the interaction of 1 with Cu2+ is chemically irreversible. The formation of a new compound BDAT as product was confirmed by MALDI-TOF: m/z [M + K + H]2+ = 470.1 (authentic BDAT: m/z [M + K + H]2+ = 470.2) (Fig. S4). In addition, the IR spectra of 1 confirmed the presence of azo group due to the band in the frequency range 1443–1493 cm−1. However, after binding Cu2+, stretching frequency signal of the azo group disappeared. A strong band of appeared in the vicinity of 1635 cm−1 should be assigned to C[double bond, length as m-dash]C and C[double bond, length as m-dash]N bonds. There is a stretching frequency at 1076 cm−1, which should be assigned to the stretching frequency of C–O and C–N bond (Fig. S5). These results clearly showed that BDAT was formed in the reaction. The turn-on response of fluorescence in this system may be proposed to proceed through the route shown in Scheme 2. The reaction mechanism most likely requires coordination of the Cu2+ to the amine/amide nitrogen atom to facilitate both PT and ET, with the possibility of azo nitrogen atom functioning as an additional ligand to assist metal binding. An oxidative cyclization reaction transforms nonemissive azoanilines into highly fluorescent benzotriazoles upon adding Cu2+. No interference, such as paramagnetic quenching by free Cu2+ was observed, presumably due to the weak metal-binding affinity of the triazole in aqueous environment.38


image file: c5ra11589b-s2.tif
Scheme 2 Oxidative cyclization of 1. For clarity, coordination of Cu2+ ions to the amino/azo N-donor is not shown. Alternative sequences of electron- and proton-transfer (ET and PT, respectively) steps could also be considered that avoid the development of highly charged intermediates in the net removal of 2H+/2e from 1 to form BDAT.

It is well known that pH-insensitivity of probes is extremely valuable for practical applications. Therefore, the fluorescence spectra response of 1 in the absence and presence of Cu2+ in different pH values were evaluated (Fig. S6). Without Cu2+, no obvious fluorescence change of 1 could be observed between pH 5 and 11. Upon addition of Cu2+, 1 responded stably to Cu2+ in the same region with little interference by protons. These results indicate that 1 successfully react with Cu2+ and allow Cu2+ detection in a wide pH range.

To further demonstrate the practical applicability of the probe in biological samples, fluorescence imaging experiments were carried out in living cells (Fig. 3). Incubation of HT-29 cells with 1 (10 μM) for 0.5 h at 37 °C was followed by the addition of Cu2+ (50 μM) and then was incubated for another 0.5 h. The enhancement of fluorescence was observed. The results suggest that probe 1 can penetrate the cell membrane and can be used for imaging of Cu2+ in living cells potentially.


image file: c5ra11589b-f3.tif
Fig. 3 Fluorescent images of Cu2+ in HT-29 cells. (a) Cells stained with 10 μM of 1 for 30 min. (b) Fluorescence image of HT-29 cells incubated with 1 for 30 min, washed two times, and then further incubated with 50 μM of Cu2+ for 30 min.

Conclusion

In conclusion, metal-induced chemical transformation of azo dye molecules has been exploited for the selective detection of copper ions. Cu2+ induced a highly selective “turn-on” fluorescence enhancement in aqueous buffer. A 131 fold fluorescence enhancement was observed upon the addition of Cu2+. Moreover, this probe shows a broad working pH range (5–11) for response to Cu2+. Fluorescence microscopy experiments indicated that probe 1 could be applied to the cell-imaging of Cu2+ using HT-29 cells. This work also implies that simple structural modification of azo dyes can easily contribute to new Cu2+ selective fluorescent probes.

Acknowledgements

This study was supported by the National Nature Science Foundation of China (21175085 and 21375083) and the Shanxi Scholarship Council of China (No. 20090980).

Notes and references

  1. M. H. Lee, Z. Yang, C. W. Lim, Y. H. Lee, S. Dongbang, C. Kang and J. S. Kim, Chem. Rev., 2013, 113, 5071 CrossRef CAS PubMed.
  2. Y. J. Li, T. F. Liu, H. B. Liu, M. Z. Tian and Y. L. Li, Acc. Chem. Res., 2014, 47, 1186 CrossRef CAS PubMed.
  3. Y. B. Guo, L. Xu, H. B. Liu, Y. J. Li, C. M. Che and Y. L. Li, Adv. Mater., 2015, 27, 985 CrossRef CAS PubMed.
  4. G. W. Gokel, W. M. Leevy and M. E. Weber, Chem. Rev., 2004, 104, 2723 CrossRef CAS PubMed.
  5. L. Tapia, M. Suazo, C. Hodar, V. Cambiazo and M. Gonzalez, BioMetals, 2003, 16, 169 CrossRef CAS.
  6. H. Sigel, Metal ions in biological systems, Dekker, New York, 1981 Search PubMed.
  7. D. J. Waggoner, T. B. Bartnikas and J. D. Gitlin, Neurobiol. Dis., 1999, 6, 221 CrossRef CAS PubMed.
  8. F. Tisato, C. Marzano, M. Porchia, M. Pellei and C. Santini, Med. Res. Rev., 2010, 30, 708 CAS.
  9. W. Chouyyok, Y. Shin, J. Davidson, W. D. Samuels, N. H. LaFemina, R. D. Rutledge, G. E. Fryxell, T. Sangvanich and W. Yantasee, Environ. Sci. Technol., 2010, 44, 6390 CrossRef CAS PubMed.
  10. M. Lin, M. Cho, W. S. Choe, J. B. Yoo and Y. Lee, Biosens. Bioelectron., 2010, 26, 940 CrossRef CAS PubMed.
  11. N. Pourreza and R. Hoveizavi, Anal. Chim. Acta, 2005, 549, 124 CrossRef CAS PubMed.
  12. J. S. Becker, M. V. Zoriy, C. Pickhardt, N. Palomero-Gallagher and K. Zilles, Anal. Chem., 2005, 77, 3208 CrossRef CAS PubMed.
  13. M. Taki, S. Iyoshi, A. Ojida, I. Hamachi and Y. Yamamoto, J. Am. Chem. Soc., 2010, 132, 5938 CrossRef CAS PubMed.
  14. K. L. Ciesienski, L. M. Hyman, S. Derisavifard and K. J. Franz, Inorg. Chem., 2010, 49, 6808 CrossRef CAS PubMed.
  15. K. C. Ko, J. S. Wu, H. J. Kim, P. S. Kwon, J. W. Kim, R. A. Bartsch, J. Y. Lee and J. S. Kim, Chem. Commun., 2011, 47, 3165 RSC.
  16. L. N. Wang, J. X. Yan, W. W. Qin, W. S. Liu and R. Wang, Dyes Pigm., 2012, 92, 1083 CrossRef CAS PubMed.
  17. J. G. Huang, M. Tang, M. Liu, M. Zhou, Z. G. Liu, Y. Cao, M. Y. Zhu, S. G. Liu and W. B. Zeng, Dyes Pigm., 2014, 107, 1 CrossRef CAS PubMed.
  18. S. P. Wu, Z. M. Huang, S. R. Liu and P. K. Chung, J. Fluoresc., 2012, 22, 253 CrossRef CAS PubMed.
  19. M. Q. Wang, K. Li, I. T. Hou, M. Y. Wu, Z. Huang and X. Q. Yu, J. Org. Chem., 2012, 77, 8350 CrossRef CAS PubMed.
  20. Z. P. Liu, C. L. Zhang, X. Q. Wang, W. J. He and Z. J. Guo, Org. Lett., 2012, 14, 4378 CrossRef CAS PubMed.
  21. S. L. Hu, S. S. Zhang, Y. Hu, Q. Tao and A. X. Wu, Dyes Pigm., 2013, 96, 509 CrossRef CAS PubMed.
  22. L. Y. Yang, Q. Song, K. Damit-Og and H. S. Cao, Sens. Actuators, B, 2013, 176, 181 CrossRef CAS PubMed.
  23. M. Z. Tian, M. M. Hu, J. L. Fan, X. J. Peng, J. Y. Wang, S. G. Sun and R. Zhang, Bioorg. Med. Chem. Lett., 2013, 23, 2916 CrossRef CAS PubMed.
  24. J. Q. Tian, Q. Liu, A. M. Asiri, A. O. Al-Youbi and X. P. Sun, Anal. Chem., 2013, 85, 5595 CrossRef CAS PubMed.
  25. S. Pu, L. Ma, G. Liu, H. Ding and B. Chen, Dyes Pigm., 2015, 113, 70 CrossRef CAS PubMed.
  26. H. Zhu, J. L. Fan, B. H. Wang and X. J. Peng, Chem. Soc. Rev., 2015, 44, 4337 RSC.
  27. A. P. de Silva, H. Q. Gunaratne, T. Gunnlaugsson, A. J. Huxley, C. P. McCoy, J. T. Rademacher and T. E. Rice, Chem. Rev., 1997, 97, 1515 CrossRef CAS PubMed.
  28. Y. Xiang, A. Tong, P. Jin and Y. Ju, Org. Lett., 2006, 8, 2863 CrossRef CAS PubMed.
  29. X. Zhang, Y. Shiraishi and T. Hirai, Org. Lett., 2007, 9, 5039 CrossRef CAS PubMed.
  30. K. M. K. Swamy, S.-K. Ko, S. K. Kwon, H. N. Lee, C. Mao, J.-M. Kim, K.-H. Lee, J. Kim, I. Shin and J. Yoon, Chem. Commun., 2008, 5915 RSC.
  31. Y. Zhao, X.-B. Zhang, Z.-X. Han, L. Qiao, C.-Y. Li, L.-X. Jian, G.-L. Shen and R.-Q. Yu, Anal. Chem., 2009, 81, 7022 CrossRef CAS PubMed.
  32. N. Li, Y. Xiang and A. Tong, Chem. Commun., 2010, 46, 3363 RSC.
  33. J. J. Du, M. M. Hu, J. L. Fan and X. J. Peng, Chem. Soc. Rev., 2012, 41, 4511 RSC.
  34. S. I. Reja, V. Bhalla, S. Manchanda, G. Kaur and M. Kumar, RSC Adv., 2014, 4, 43470 RSC.
  35. Y.-Y. Zhu, X. Zhang, H. Guo and Z.-J. Zhu, RSC Adv., 2014, 4, 45791 RSC.
  36. C. Yang, Y. Chen, K. Wu, T. Wei, J. Wang, S. Zhang and Y. Han, Anal. Methods, 2015, 7, 3327 RSC.
  37. M. Z. Tian, L. B. Liu, Y. J. Li, R. F. Hu, T. F. Liu, H. B. Liu, S. Wang and Y. L. Li, Chem. Commun., 2014, 50, 2055 RSC.
  38. J. Jo, H. Y. Lee, W. Liu, A. Olasz, C. H. Chen and D. Lee, J. Am. Chem. Soc., 2012, 134, 16000 CrossRef CAS PubMed.
  39. A. T. R. Williams, S. A. Winfield and J. N. Miller, Analyst, 1983, 108, 1067 RSC.

Footnote

Electronic supplementary information (ESI) available: 1H, 13C NMR, IR, MS, UV-Vis and fluorescence spectra (probe 1). CCDC 1417207. For ESI and crystallographic data in CIF or other electronic format see DOI: 10.1039/c5ra11589b

This journal is © The Royal Society of Chemistry 2015
Click here to see how this site uses Cookies. View our privacy policy here.