 Open Access Article
Green synthesis of cobalt ferrite from rotten passion fruit juice and application as an electrocatalyst for the hydrogen evolution reaction†
Rochelin Prosper
Medang
 a,
Roussin
Lontio Fomekong
 b,
Edwin Akongnwi
Nforna
 c,
Hypolite Mathias
Tedjieukeng Kamta
 b,
Cédrik Ngnintedem
Yonti
b,
Patrice Kenfack
Tsobnang
b,
Cédrik Ngnintedem
Yonti
b,
Patrice Kenfack
Tsobnang
 *d,
John Ngolui
Lambi
b and
Dieudonné
Bitondo
 ae
ae
aLaboratoire Méthodes (LM), École Nationale Supérieure Polytechnique de Douala, Université de Douala, Douala, Cameroon
bDepartment of Chemistry, Higher Teacher Training College, University of Yaoundé I, Yaoundé, Cameroon
cDepartment of Fundamental Sciences, Higher Technical Teacher Training College, University of Bamenda, Bambili, Cameroon
dDepartment of Chemistry, University of Dschang, P.O. Box 67, Dschang, Cameroon. E-mail: patrice.kenfack@univ-dschang.org
eDépartement Qualité Industrielle, Hygiène, Sécurité Industrielle et Génie de l’Environnement, École Nationale Supérieure Polytechnique de Douala, Université de Douala, Douala, Cameroon
First published on 9th May 2024
Abstract
Green synthesis of an efficient and low-cost electrocatalyst for the hydrogen evolution reaction (HER) in a basic medium is highly desirable for renewable energy conversion. Herein, cobalt-ferrite (CoFe2O4) was prepared by green coprecipitation synthesis using a precipitating agent (citrate) extracted from rotten passion fruit. The preparation followed two steps, in which the cobalt–iron citrate precursor was first obtained by coprecipitation, followed by pyrolysis in the air at 850 °C. While Fourier transform infrared (FTIR) and thermogravimetry (TG) confirmed the successful preparation of the precursor, X-ray diffraction (XRD), Raman spectroscopy and scanning electron microscopy (SEM) revealed without any doubt the formation of polyhedron-like shape CoFe2O4. The electrocatalytic properties of the as-prepared material for the HER in 1 M KOH have been investigated. CoFe2O4 demonstrated good electrochemical performance with an overpotential of 440 mV at a current density of 10 mA cm−2, a Tafel slope of 98 mV dec−1, an electrical double layer capacitance (Cdl) of 0.43 mF cm−2 and very high stability with an overpotential loss of only 13.07 mV after 12 hours. This paper provides a simple, easy method for HER catalyst preparation by recycling waste fruit.
1. Introduction
The conversion of protons into hydrogen from an inexpensive, stable and robust electrocatalyst has nowadays become a promising source of sustainable and carbon-free energy.1–4 The use of noble metals like platinum and palladium as appropriate electrocatalysts so far, however, has some limitations, not only because of their rarity but also the requirement of costly operations for industrial implementation.5,6 Thus, the devolution of researchers towards the search for stable alternative electrocatalysts, at low cost and promoting large-scale applications, remains a current challenge.7,8 Very recent studies have revealed that transition metal ferrites in general and cobalt ferrite in particular, which can be obtained chemically in inexhaustible quantities, are prominently among the most efficient of these alternatives.9–11 The work of Hamza Belhadj et al. has elucidated the excellent electrocatalytic activity of some transition metal ferrites, foremost among which is cobalt ferrite (CoFe2O4), for the hydrogen evolution reaction (HER). Owing to its remarkable physicochemical properties, this material is perceived as an ideal candidate for the HER.1 It belongs to the family of ferrites with the chemical formula MFe2O4 (where M is a divalent metal ion: Co2+, Fe2+, Zn2+). It has an “inverse” spinel structure, with an ionic distribution as follows: (Fe3+)A(Fe3+Co2+)BO42−. With this structure, the oxygen ions whose ionic size is relatively larger, form a face-centered cubic network (CFC), defining tetrahedral A and octahedral B cationic sites. In this configuration, the Co2+ occupies the octahedral sites, hence the name reverse spinel.12 Several synthesis methods such as sol–gel reaction,13 the hydrothermal method,14 mechanosynthesis,15 the combustion method16 and coprecipitation17 have been used for the synthesis of this material with remarkable properties. The coprecipitation method is of particular interest because it is a simple, low-cost method of realization and it offers the possibility to control the stoichiometry of the desired material.18 It is a wet synthesis process initiated by a reaction in an aqueous medium of two or more metal ions with a precipitating agent in order to obtain metal-organic compounds (precursors for the oxide materials). The process is followed by the thermal decomposition of these precursors to obtain inorganic materials under some conditions.18 The coprecipitation method for the synthesis of oxide materials has been widely employed and many works have been devoted to the synthesis of CoFe2O4. But the ligands (hydroxide, carboxylates, etc.) usually used in these methods are from commercial sources. They generate additional costs related to their prior synthesis and they have a negative impact on the environment. Recently, the idea to produce these oxide materials with carboxylate molecules coming from vegetable resources was developed and the interest in the field is constantly growing. Using this type of precipitating agent exhibits two main advantages: first, it reduces the environmental impact of the synthesis of metal oxides by the coprecipitation route, and second, it valorizes the local natural bioresources by recycling rotten fruits, which in general are waste and constitute another source of pollution. Some illustrations of these works include the synthesis of iron-doped cobalt oxide nanoparticles from palm kernel oil as the precipitating agent/ligand,19 the synthesis of nanomaterials of CaCu3Ti4O12 from Carambola fruit juice,20 and many others reported to date.21–26 In Cameroon as well as many developing countries, some fruits like passion fruit are abundant in a particular season but their conservation is difficult and their transformation is not yet developed. A lot of waste is then produced with these fruits when they are not eaten and to the best of our knowledge, no use, recycling or valorisation processes are done for these wastes. Passion fruit contains a great quantity of citric acid, which can be used as a complexing agent for the synthesis of oxide materials. We report in this work the green synthesis of CoFe2O4 material from rotten passion fruit juice and its application as an efficient electrocatalyst for the hydrogen evolution reaction (HER).2. Experimental section
2.1. Reagents
The passion fruit or passiflora used in this work is of the variety Edulea of the species Passiflora edulis and of the genus passiflora. Its choice was guided by the highly acidic flavor, compared to other varieties. The rotten passion fruits used in this work were not suitable for consumption. In the field, they were directly picked from under the trees and amongst decaying leaves. Other reagents used in this work include potassium hydroxide (KOH, 85%, Carl Roth), lithium hydroxide monohydrate (LiOH·H2O, 98%, Sigma Aldrich), cobalt(II) nitrate hexahydrate (Co(NO3)2·6H2O, 99.0%, Sigma Aldrich), and iron(III) chloride hexahydrate (FeCl3·6H2O, 98.0%, Sigma Aldrich). These reagents were used without any purification process.2.2. Extraction and titration of the passion fruit juice (passiflora)
The fruits were cut, opened and a spatula was used to extract all the juice, pulp and seeds contained in the fruit into a beaker. Vacuum filtration was used to obtain juice completely devoid of fibers and the percentage of the juice as well as that of the fiber contents were calculated by eqn (1). | (1) |
The juice extract, which contains citric acid, was then titrated with 0.2 M potassium hydroxide solution with phenolphthalein as the indicator. This titration aims to evaluate the citric acid content in the passion fruit juice.
2.3. Synthesis of the precursors
For the synthesis of the Co–Fe carboxylate precursor of CoFe2O4, 15 mL of passion fruit juice (∼2.70 mmol of citric acid) and a mass of 0.45 g (∼10.80 mmol) of lithium hydroxide monohydrate were used. Then, 0.39 g (∼1.35 mmol) and 0.73 g (∼2.70 mmol), respectively, of cobalt(II) nitrate hexahydrate and iron(III) chloride hexahydrate were dissolved in two beakers each containing 10 mL of distilled water and mixed in a single beaker. The mixture of these metallic solutions was added dropwise into the mixture of passion fruit juice and lithium hydroxide solution (with stirring) at a temperature of 80 °C. The precipitate of the Co–Fe precursor obtained was filtered, washed with distilled water, ethanol and acetone, and then dried.The synthesis of simple precursors (Co-precursor and Fe precursor), the results of which are illustrated in the ESI,† obeyed the protocol mentioned above with differences in quantity. For example, for the Co-precursor, we reacted 15 mL of passion fruit juice (∼2.70 mmol of citric acid) with 0.34 g (∼8.10 mmol) of lithium hydroxide monohydrate dissolved in distilled water and 0.31 g (∼4.05 mmol) of cobalt(II) nitrate hexahydrate dissolved in distilled water. As for the Fe-precursor, we reacted 15 mL of passion fruit juice (∼2.70 mmol of citric acid) with 0.34 g (∼8.10 mmol) of lithium hydroxide monohydrate and 0.73 g (∼2.70 mmol) of iron(III) nitrate hexahydrate.
2.4. Characterization of the synthesized materials
The functional groups or bonds present in the synthesized materials were elucidated by Fourier transform infrared (FTIR) spectrometry using a Nicolet Nexus 870 brand IR spectrometer. The thermal behavior of the three precursors was studied by thermogravimetric analysis (TGA) using a Linseis STAPT-1000 device operating from room temperature to 1000 °C in air, at a heating rate of 10 °C min−1. Powder X-ray diffraction (PXRD) measurements on the residues obtained after the thermal decomposition of the precursors were performed using a Siemens kristalloflex θ–2θ D5000 powder diffractometer with the Bragg–Brentano geometry. These measurements were done in the 2θ range of 10 to 90° steps size of 0.02° s−1. Further evaluation of the material structure was performed using the Raman microscope (Renishaw, England). For this analysis, a 0.75 mW laser power and 532 nm laser with a 50× magnification objective were applied to the sample at different locations with an exposure time of 20 s between 100 and 900 cm−1. The scanning electron microscope (SEM) brand Zeiss ultra 55 was used to determine the morphology and the average size of the particles of the materials. This microscope is equipped with an energy-dispersive X-ray (EDX) spectrometer from Oxford Instruments, Oxford, England. For this purpose, the experiments were carried out at 15 keV with a working distance (distance between the sample and the part of the lower pole in the SEM system) of 8 mm. A probe current of 1 nA and an acquisition time of 300 s were used to collect the chemical spectra.2.5. Determination of the potential of CoFe2O4 for the electrocatalysis of the HER
A three-electrode system was used for the electrochemical HER measurements. All experiments were performed at room temperature on a PGSTAT 204 electrochemical workstation (Utrecht, the Netherlands, NOVA version 2.1.4) using a glassy carbon (GC) electrode coated with our material as the working electrode, Hg/HgO as the reference electrode (RE), and a carbon rod as the counter electrode. To prepare the working electrode, 20 μL of the as-prepared suspension containing approximately 0.12 mg of CoFe2O4 was drop-cast onto the GC and dried under vacuum, leading to a catalyst loading of 1.7 mg cm−2. Then, a drop of Nafion solution (5 wt%) was deposited on top and dried at 60 °C for 2 hours. The measured potentials were recalculated against a reversible hydrogen electrode (RHE) according to the Nernst equation: ERHE = EHg/HgO + 0.098 + 0.059pH, where 0.098 V corresponds to the potential of the reference electrode at 0 pH. Linear sweep voltammetry (LSV) was measured in 1 M KOH (pH = 14) with a scan rate of 2 mV s−1, and the overpotential was evaluated using the following equation η = 0 − E (vs. RHE (V)). The Tafel slope (TS) was extracted using the equation η = a + b![[thin space (1/6-em)]](https://www.rsc.org/images/entities/i_char_2009.gif) log|j|, with η, a, b, and j corresponding to overpotential, Tafel constant, TS, and current density, respectively. Electrochemical impedance spectroscopy (EIS) was performed in the frequency range of 0.1–1000 Hz and the amplitude of the applied AC potential was 10 mV. The stability of the material was investigated by chronopotentiometry for 12 h. Cyclic voltammetry (CV) for the three samples at different scan rates was recorded in the potential range of (0.0–0.1 V). The electrical double layer capacitances (Cdl) were calculated from the recorded CV at a potential of 0.05 V, using the formula Cdl = (Ja + |Jc|)/2ν, in which Ja and Jc are the anodic and cathodic current density, respectively, recorded at 0.05 V and ν is the scan rate.
log|j|, with η, a, b, and j corresponding to overpotential, Tafel constant, TS, and current density, respectively. Electrochemical impedance spectroscopy (EIS) was performed in the frequency range of 0.1–1000 Hz and the amplitude of the applied AC potential was 10 mV. The stability of the material was investigated by chronopotentiometry for 12 h. Cyclic voltammetry (CV) for the three samples at different scan rates was recorded in the potential range of (0.0–0.1 V). The electrical double layer capacitances (Cdl) were calculated from the recorded CV at a potential of 0.05 V, using the formula Cdl = (Ja + |Jc|)/2ν, in which Ja and Jc are the anodic and cathodic current density, respectively, recorded at 0.05 V and ν is the scan rate.
3. Results and discussion
3.1. Analysis of passion fruit juice
Table 1 presents the juice and fiber content of the passion fruits used in this work.| Total number of fruits (sample): 13 | ||
|---|---|---|
| Mass (g) | Mass percentage (%) | |
| Passion fruit (mT) | 420.00 ± 0.01 | 100.00 |
| Passion fruit juice containing fiber (mjf) | 109.30 ± 0.01 | 26.02 |
| Passion fruit juice (mj) | 71.80 ± 0.01 | 17.09 |
| Fibers (mf) | 37.50 ± 0.01 | 8.93 |
The dietary fiber content (8.93%) is within the range of values from 1.5% to 14.3% predicted by Favier.27 This result reveals a non-negligible quantity of dietary fibers, which would have had an influence on the analysis results if they had not been eliminated by filtration during the extraction of the passion fruit juice.
Table S1 of the ESI† presents the volumes of NaOH solution (45 mL) obtained during the titration of the passion fruit juice used in this work.
The mass percentage (P′) of citric acid in the solution obtained by using eqn (2) is 3.46%. This value is between 2.50% and 3.50% as predicted in the literature.27 This result confirms that rotten passion fruit is a potential source of citric acid that can be used for the synthesis of oxide materials like CoFe2O4.
 | (2) |
3.2. Analyses of the carboxylate precursors
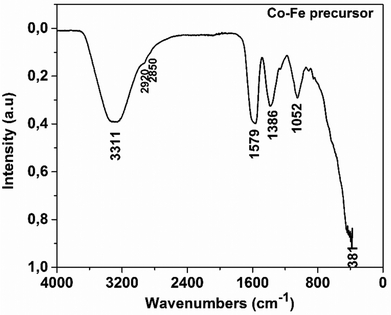
Table 2 presents the major vibration bands of some characteristic chemical groups of the synthesized compound.
| Experimental frequencies (cm−1) | Reference frequencies28 | |
|---|---|---|
| Functional group | ||
| v(OH) associated | 3311 | 3570–3200 |
| v as(COO−) | 1579 | 1610–1550 |
| v as(CH2) | 2920 | 2935–2915 |
| v s(CH2) | 2850 | 2865–2845 |
| v s(COO−) | 1386 | 1420–1300 |
| (ter) vsC–C | 1052 | ∼1000 |
| δ(M–O) | 381 | ∼400 |
Fig. 1 shows a broad absorption band at 3311 cm−1, which can be attributed to the vibration of the O–H group associated with a sp3 carbon. The peaks at 2920 cm−1 and 2850 cm−1 ascribed to the CH2 group correspond to νas(CH2) and νs(CH2) vibrations, respectively. They are very weak as expected and appear as the shoulder of the wide band of the O–H group. Indeed, the Rayleigh criterion, which states that “two lines of the same intensity are separated if the maximum of one corresponds to the first minimum of the other”,29 is not satisfied for these bands. Fig. 1 also shows absorption bands at 1579 cm−1, 1386 cm−1 and 1052 cm−1, which respectively correspond to the asymmetric stretching of the CO bond in the COO− group, the symmetric stretching of the CO bond in the same group, and the symmetric stretching of the C–C bond of the carbon skeleton. By comparing the IR spectra of citric acid30 and that of the precursor, it can be seen that the peak at 1720 cm−1 linked to CO in the COOH group observed in the spectrum of citric acid is shifted to 1579 cm−1. This could be related to the fact that the carboxylate group interacts with the cobalt ion in the precursor via a coordination bond. So, this FTIR result confirms that a coordination compound with the citrate as a ligand has been synthesized as expected. The FTIR spectra of Co and Fe precursors are also shown in Fig. S1 and S2 of the ESI,† respectively. These figures show the appearance of similar absorption bands, corresponding to the same vibration frequencies of the chemical bonds found in the as-prepared compound treated in this article.
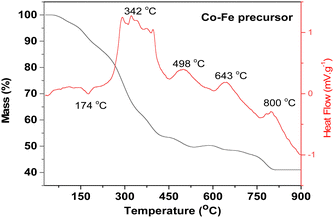
The TGA curve of the Co–Fe precursor shows that its decomposition takes place in four steps. Stage 1 (mass loss of 9.53%) occurs between 50 °C and 180 °C (maximum reaction temperature of 174 °C) and corresponds to the loss of three water molecules with the theoretical percentage of 9.23% from the proposed Co–Fe formula of CoFe2(C6H5O7)·2H2O. Step 2 (29.42% of experimental mass loss) occurs between 180 °C and 365 °C (maximum temperature of 342 °C). It can be attributed to the loss of four molecules of CO2 (theoretical percentage of 30.08%). Step 3 (12.61% of experimental mass loss) occurs between 365 °C and 650 °C (maximum temperatures of 498 °C and 643 °C) and it can be attributed to the loss of three molecules of CO (theoretical percentage of 14.36%). The last stage (7.51% of experimental mass loss) occurs between 650 °C and 850 °C (maximum reaction temperature of 800 °C) and can be due to the loss of an organic molecule of CH2CO (theoretical percentage of 7.18%). Beyond 850 °C, the residue of this thermal decomposition has an experimental percentage of 40.99%. This can be related to the formation of one mole of CoFe2O4 (theoretical percentage of 40.17% close to the experimental value). The same analysis done for the Co and Fe precursors (see Fig. S3 and S4 respectively, ESI†) shows that their residues are Co3O4 and a mixture of Fe2O3 and Fe3O4, respectively.
3.3. Analyses of the synthesized oxides
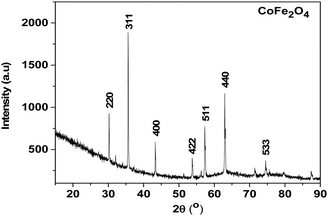 | ||
| Fig. 3 X-ray powder diffraction pattern of the residue from the thermal decomposition of the Co–Fe precursor. | ||
As shown in Fig. 3, almost all the peaks are well indexed with the CoFe2O4 structure (CDD reference of 1533163), and the very weak peaks that remain are those of the Fe5LiO8 structure (CDD reference 1541958). This material with a quantity less than 5 wt% would come from the few lithium ions that would have remained during the synthesis of the Co–Fe precursor synthesized from the rotten passion fruit in this work. Also, the peaks in Fig. S6 and S7 (ESI†) are well indexed, respectively, with the Co3O4 structure (COD reference 9005888) and the mixture of 63% of α-Fe2O3 and 37% of Fe3O4 (COD references 2108027 and 9005814). All these results are in agreement with those of the thermogravimetry analysis shown above and they indicate that the juice obtained from the rotten passion fruit is a suitable reagent for the synthesis of these oxide materials, particularly CoFe2O4 for which its application for the HER is studied below. Such green synthesis of CoFe2O4 materials was reported in some previous works in the literature but to the best of our knowledge,31–33 this is the first time that rotten passion fruits were used for this purpose.
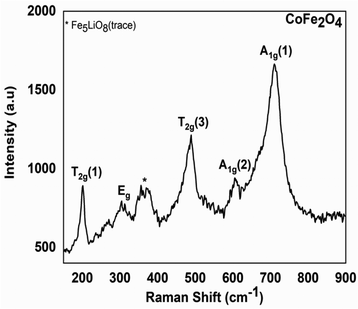 | ||
| Fig. 4 Experimental Raman spectrum of the residue from the thermal decomposition of the Co–Fe precursor. | ||
Fig. 4 clearly shows peaks in the range of 200 to 750 cm−1 region. The peak that occurs at 202 cm−1 is attributed to the T2g(1) vibration mode corresponding to the translation motion of the whole tetrahedron in the CoFe2O4 material.34 The peak at 300 cm−1 is attributable to the Eg vibration mode related to the symmetric bending of the Fe(Co)–O bond in agreement with the literature.34 The peak at 485 cm−1 is attributable to the T2g(3) vibration mode of the asymmetric bending Fe(Co)–O bond. The peak at 611 cm−1 is attributed to the A1g(2) vibration mode of the symmetric stretching Fe(Co)–O bond; the peak at 703 cm−1 is attributable to the A1g(1) vibration mode of the Fe–O symmetric stretching. All these peaks are similar to those of a CoFe2O4 spinel crystal found in the literature34 and this confirms our interpretation of TGA and PRXD analysis. This analysis also confirms that the peaks at 202 cm−1; 263 cm−1; 300 cm−1; 318 cm−1; 358 cm−1; 610 cm−1… in agreement with the literature,35 show the presence (in the trace state) of the Fe5LiO8 materials ascribed to the PXRD analysis. This analysis also confirms that the residues obtained from the thermal decomposition of the Co and Fe precursors are, respectively, Co3O4 (see Fig. S7, ESI†) and a mixture of Fe2O3 and Fe3O4 (see Fig. S8, ESI†) in agreement with the TGA and PXRD results.
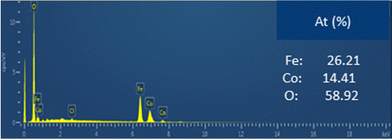
The EDX spectra clearly confirmed the presence of the expected elements (Fe, Co and O). Moreover, the semi-quantitative analysis performed indicates that the experimental Fe/Co ratio obtained is 1.8, which is close to the expected value (∼2). The slight difference observed between the expected and obtained values can be explained by the presence of some impurities such as residual Cl and C. This result confirms the hypothesis that the synthesized material is CoFe2O4.
 | ||
| Fig. 6 Left: SEM image of (left) CoFe2O4 on a reduced scale ∼200 nm; Right: enlargement of the framed part of left image. | ||
It can be observed that cobalt ferrite has a polyhedral-like shape with a size ranging from 100–300 nm, almost similar to that obtained for iron oxide. However, cobalt oxide exhibited mainly spherical particles with an average grain size of less than 100 nm.
3.4. Electrocatalytic HER performance of the synthesized CoFe2O4
Fig. 7 presents the HER characteristics of the experimentally synthesized material.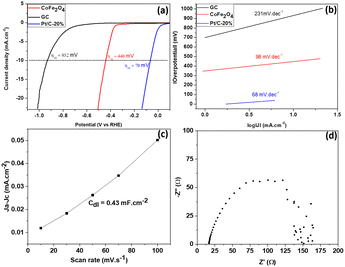 | ||
| Fig. 7 (a) LSV curve of CoFe2O4. (b) Tafel plot of CoFe2O4. (c) Cdl plot of CoFe2O4 obtained from the cyclic voltammetric curve at different sweep speeds. (d) Nyquist plot of CoFe2O4. | ||
The catalytic performance of the synthesized material with respect to hydrogen release reactions is elucidated in Fig. 7. Fig. 7(a) displays the LSV plots of different CoFe2O4 electrodes and those of reference (GC). The CoFe2O4 electrocatalyst synthesized in this work required an overpotential of 440 mV to reach a current density of 10 mA cm−2, a satisfactory HER value if we stick to an application offered by a material resulting from green synthesis. This value is comparable and more or less lower than those of Pt/C-20% (70 mV), NiFe2O4 (420 mV) and ZnFe2O4 (520 mV) obtained by Hamza Belhadj et al. (using chemical reagents).1 Similar work on nickel ferrite doped with cobalt at x% reports overpotentials, almost all of which are between 450 and 600 mV at a current density of 10 mA cm−2.36 This would justify the quality of our synthesized material compared to those which would be located in this zone of the overpotentials mentioned above. From the point of view of the kinetics limiting the dihydrogen evolution reaction process, the value of the Tafel slope (which is 98 mV dec−1 as depicted on Fig. 7(b)) is significantly lower than that of CuFe2O4 (124 mV dec−1), NiFe2O4 (133 mV dec−1) and ZnFe2O4 (144 mV dec−1), obtained by Hamza Belhadj et al.1 This shows that the adsorption of H2O is energetically less favorable, according to the Volmer mechanism (eqn (3)), on the synthesized CoFe2O4 compared to the ferrites of CuFe2O4, NiFe2O4 and ZnFe2O4 obtained by Hamza Belhadj et al..1 Very recent work on the study of the electrocatalytic performance of NiCo2O4 nanostructures prepared by the hydrothermal method and post-annealing heat treatment, presented the Tafel of various samples of NiCo2O4 nanostructures annealed at different temperatures. It follows from this optimization that almost all of these samples have Tafel between 98 mV dec−1 and 168 mV dec−1;37 which is higher compared to the value found experimentally in our work. The value of the Tafel slope obtained experimentally suggests that dihydrogen is produced according to the Volmer–Heyrovsky mechanism.38,39 The first step, called the Volmer step, consists of the adsorption of a molecule of water on the surface of a catalytic site M. The second step is a step of recombination of the previously adsorbed hydrogen atom with a hydrogen atom resulting from the dissociative adsorption of a water molecule (Heyrovsky step). Eqn (3) and (4) illustrate the rate limiting step of the process (rate determining step), determined from the Tafel slope.
| H2O + M + e− ↔ MHads + HO− Volmer step | (3) |
| H2O + MHads + e− ↔ H2 + M + HO− Heyrovsky step | (4) |
Concerning the long-term stability during the HER of the as prepared electrocatalyst, chronopotentiometry was performed at a fixed current density of 10 mA cm−2 for 12 h.
The result presented in Fig. 8a shows a small drop of 13.07 mV in the overpotential after 12 h, indicating, therefore, its good stability during the HER process. After the stability test, EIS was carried out on the sample and the result is shown in Fig. 8b. The Rct calculated from the graph has a value of 146 U, which is almost similar to that calculated before the stability test (cf. 147 U), revealing the same charge transfer capacity and, therefore, no considerable alteration of the electrical properties. This demonstrates that the prepared material is an effective and stable electrocatalyst for the HER in alkaline medium.
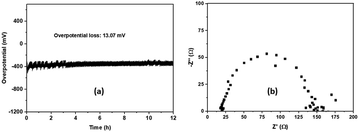 | ||
| Fig. 8 (a) Chronopotentiometry of CoFe2O4. (b) The electrochemical impedance spectrum, after the stability test. | ||
4. Conclusion
In this research, the aim was to carry out the green synthesis of cobalt ferrite by a coprecipitation route by using rotten passion fruit juice. The compound with a prismatic shape and particle size of less than 300 nm, was successfully synthesized and characterized by XRD, Raman spectroscopy, EDX and SEM analyses. This route was also used to successfully synthesize the Co3O4 and a mixture of Fe2O3 and Fe3O4. HER characteristics were assessed using LSV, Tafel slope (TS), electric double-layer capacitance (Cdl), and EIS. The CoFe2O4 electrocatalyst synthesized in this work required an overpotential of 440 mV; a TS of 98 mV dec−1, a Cdl = 0.43 mF cm−2, a charge transfer resistance Rct = 147 U and good stability with an overpotential loss of only 13.07 mV after 12 h. By comparing these data with those found in the literature, we can conclude that the CoFe2O4 electrocatalyst synthesized from the rotten passion juice fruit is a suitable catalyst for the hydrogen evolution reaction, which is a renewable and clean energy source for the environment. These characteristics could be improved by adjusting certain parameters such as the calcination temperature and the cooling time of the material after calcination. Such synthesis from the juice of rotten passion fruits is easy, sustainable and it can be an illustration of a promising step towards a totally green technology.Author contributions
Rochelin Prosper Medang: investigation and draft preparation. Roussin Lontio Fomekong: investigation, resources and writing – original draft. Hypolite Mathias Tedjieukeng Kamta: methodology, data curation and formal analysis. Cédrik Ngnintedem Yonti: data curation, visualization and formal analysis. Edwin Akongnwi Nforna: data curation, resources and formal analysis. Patrice Kenfack Tsobnang: conceptualization, methodology and editing. John Ngolui Lambi: supervision, reviewing and editing. Dieudonné Bitondo: supervision, reviewing and editing.Conflicts of interest
The authors declare that they have no known competing interests.Acknowledgements
The authors acknowledge Professor Zdenek Sofer for the characterization facilities used in this work. The authors also acknowledge the RSC Research Fund Grant no. R23-1928872283 for electrochemical facilities.References
- B. Hamza, Y. Messaoudi, R. M. Khelladi and A. Azizi, Int. J. Hydrogen Energy, 2022, 47, 20129 CrossRef.
- R. Bao-Ping, G. Yang, L. Zhou-Yan, L. Zheng-Yan, H. Zhang, S. Li-Ping and L. Hai-Yang, Int. J. Hydrogen Energy, 2023, 152, 110663 Search PubMed.
- M. Nemiwal, V. Gosu, T. C. Zhang and D. Kumar, Int. J. Hydrogen Energy, 2021, 46, 10216 CrossRef CAS.
- F. Dawood, M. Anda and G. M. Shafiullah, Int. J. Hydrogen Energy, 2020, 45, 3847 CrossRef CAS.
- C. Li and J. B. Baek, ACS Omega, 2020, 5, 31–40 CrossRef CAS PubMed.
- J. Li, S. Wang, J. Chang and L. Feng, Adv. Powder Mater., 2022, 1, 00030 Search PubMed.
- D. Li, H. Liu and L. Feng, Energy Fuels, 2020, 34, 13491 CrossRef CAS.
- D. Y. Li, L. L. Liao, H. Q. Zhou, Y. Zhao, F. M. Cai, J. S. Zeng, F. Liu, H. Wu, D. S. Tang and F. Yu, Mater. Today Phys., 2021, 16, 100314 CrossRef CAS.
- J. Yu, T. Le, N. Tran and H. Lee, Chem. – Eur. J., 2020, 26, 6423 CrossRef CAS PubMed.
- P. Babar, A. Lokhande, V. Karade, B. Pawar, M. G. Gang, S. Pawar and J. H. Kim, Chem. Eng., 2019, 7, 10035 CAS.
- P. Babar, K. Patil, J. Mahmood, S. Kim, J. Kim and C. Yavuz, Cell Rep. Phys. Sci., 2022, 3, 100762 CrossRef CAS.
- P. Palade, C. Comanescu, A. Kuncser, D. Berger, C. Matei, N. Lacob and V. Kuncser, J. Nanomater., 2020, 10, 476 CrossRef CAS PubMed.
- E. Gopalan, P. Joy, I. Al-omari, D. Kumar, Y. Yoshida and M. Anantharaman, J. Alloys Compd., 2009, 485, 711–717 CrossRef CAS.
- O. Cofe and S. Jovanovic, J. Alloys Compd., 2014, 589, 271–277 CrossRef.
- R. Sani, A. Beitollahi, Y. Maksimov and I. Suzdalev, J. Mater. Sci., 2007, 42, 2126–2131 CrossRef CAS.
- T. Prabhakaran and J. Hemalatha, J. Alloys Compd., 2011, 509, 7071–7077 CrossRef CAS.
- I. Gul, A. Maqsood, M. Naeem and M. Ashiq, J. Alloys Compd., 2010, 507, 201–206 CrossRef CAS.
- H. M. Tedjieukeng, P. T. Kenfack, R. L. Fomekong, E. P. Ekane, A. Pattayil, A. Delcorte and J. N. Lambi, RSC Adv., 2018, 67, 38621 RSC.
- C. N. Yonti, P. K. Tsobnang, R. L. Fomekong, F. Devred, E. Mignolet, Y. Larondelle, S. Hermans, A. Delcorte and J. N. Lambi, J. Nanomater., 2021, 11, 2833 CrossRef PubMed.
- E. P. Ekane, T. J. Foba, N. V. Beckley, Y. D. Mbom, H. M. Tedjieukeng, R. L. Fomekong and J. N. Lambi, J. Nanomater., 2020, 7, 8830136 Search PubMed.
- F. E. El-Belely, M. S. Farag, A. H. Said, A. S. Amin, E. Azab, A. A. Gobouri and A. Fouda, J. Nanomater., 2021, 11, 95 CrossRef PubMed.
- S. A. Fahmy, I. M. Fawzy, B. M. Saleh, M. Y. Issa, U. Bakowsky and H. M. El-Said Azzazy, J. Nanomater., 2021, 11, 965 CrossRef CAS PubMed.
- A. Franco, R. Luque and C. Carrillo-Carrión, J. Nanomater., 2021, 11, 1259 CrossRef CAS PubMed.
- J. L. Coffer and L. T. Canham, J. Nanomater., 2021, 11, 553 CrossRef PubMed.
- S. M. Alsaggaf, A. M. Diab, E. F. B. ElSaied, A. A. Tayel and H. S. Moussa, J. Nanomater., 2021, 11, 385 CrossRef PubMed.
- F. Renia, V. Alexandra, K. Chatzi, H. Mohamed, N. Chalmpes, D. Moschovas, K. Spyrou, C. Angeliki, A. Apostolos, D. Gournisand and H. Stamatis, J. Nanomater., 2021, 11, 458 CrossRef PubMed.
- J. Favier, Irue de NRA-147, l’Université-75338 Paris Cedex 07, 1993.
- J. Coates, Interprétation des spectres infrarouges, une approche pratique, in Encyclopedia of Analytical Chemistry, ed. R. A. Meyers, John Wiley & Sons Ltd, Chichester, 2000, pp. 10815–10837 Search PubMed.
- S. Dragan and A. Fitch, J. Chem., 1998, 75, 1018–1021 CAS.
- M. A. Berube, D. Schorr, R. J. Ball, V. Landry and P. Blanchet, J. Polym. Environ., 2018, 26, 970–979 CrossRef CAS.
- P. M. Eduardo, S. D. LetÃcia, M. L. de Souza, J. K. Ribeiro, P. W. Marques, D. P. Rodrigo, S. S. Porto, C. J. R. Proveti and C. E. Passamani, J. Cleaner Prod., 2020, 265, 121712 CrossRef.
- S. S. Banifatemi, F. Davar, B. Aghabarari, A. J. Segura, J. F. Alonso and M. S. Ghoreishi, Ceram. Int., 2021, 47, 19198–19204 CrossRef CAS.
- K. Kombaiah, V. J. Judith, L. J. Kennedy, M. Bououdina, R. J. Ramalingam and H. Al-Lohedan, Mater. Chem. Phys., 2017, 204, 410–419 CrossRef.
- P. Chandramohan, M. Srinivasan, S. Velmurugan and S. Narasimhan, J. Solid State Chem., 2011, 184, 89–96 CrossRef CAS.
- W. Cook and M. Manley, J. Solid State Chem., 2010, 183, 322–326 CrossRef CAS.
- C. Sanaz, K. Maasoumeh, S. P. Naeimeh and A. Umut, ACS Omega, 2021, 6, 33024–33032 CrossRef PubMed.
- S. Azhar, S. Sumaiya, U. Noor, S. Muhammad, L. Yihan, K. Amir and K. Majid, J. Mater. Sci. Eng. B, 2023, 294, 116508 CrossRef.
- A. Lasia, in Handbook of Fuel Cells, ed. W. Vielstich, A. Lamm, H. A. Gasteiger, and H. Yokokawa, 2003, pp. 414–440 Search PubMed.
- G. Q. Han, X. Li, Y. R. Liu, B. Dong, W. H. Hu, X. Shang, X. Zhao, Y. M. Chai, Y. Q. Liu and U. C. G. Liu, RSC Adv., 2016, 6, 52761 RSC.
- A. Panda, H. Kyu and H. Kim, Int. J. Mol. Sci., 2023, 24, 9585 CrossRef CAS PubMed.
Footnote |
| † Electronic supplementary information (ESI) available: FTIR and TGA spectra of Co- and Fe-precursors, PXRD pattern of the residue of Co-, Fe- and Co–Fe-precursors, SEM images of the Co3O4 and Fe2O3/Fe3O4, and cyclic voltammetric curves of CoFe2O4 at different scanning speeds. See DOI: https://doi.org/10.1039/d3ya00450c |
| This journal is © The Royal Society of Chemistry 2024 |

